

| This presentation contains statements that constitute "forward-looking statements" within the meaning of Section 27A of the Securities Act of 1933 and Section 21E of the Securities Exchange Act of 1934. These forward-looking statements are not historical facts, but only predictions by our company and/or our company's management. These statements generally can be identified by lead-in words such as "believe," "expect" "anticipate," "intend," "plan," "foresee" and other similar words. Similarly, statements that describe our company's objectives, plans or goals are also forward-looking statements. You are cautioned that these forward-looking statements are not guarantees of future performance and involve risks and uncertainties, and that actual results may differ materially from those projected in the forward-looking statements as a result of various factors. Among others, factors that could materially adversely affect actual results and performance include those risk factors that are listed in Sonic Automotive's Form 10-Q filed on October 30, 2009. Cautionary Notice - Forward-Looking Statements |
| Fourth Quarter 2009 Earnings Review February 23, 2010 |
| Sonic Automotive Q4 2009 Quarter in Review Financial Review Operations Review Closing Comments |
| Overall Results - Q4 New retail vehicle margins up 60 bps from last year Used vehicle unit volume up 18.3% Revolver completely paid off Used vehicle line paid down below available capacity Credit facility renewal completed in January Recorded non-cash charges related to lease exit accruals (primarily related to GM terminations), fixed asset impairments, debt restructuring, and tax items |
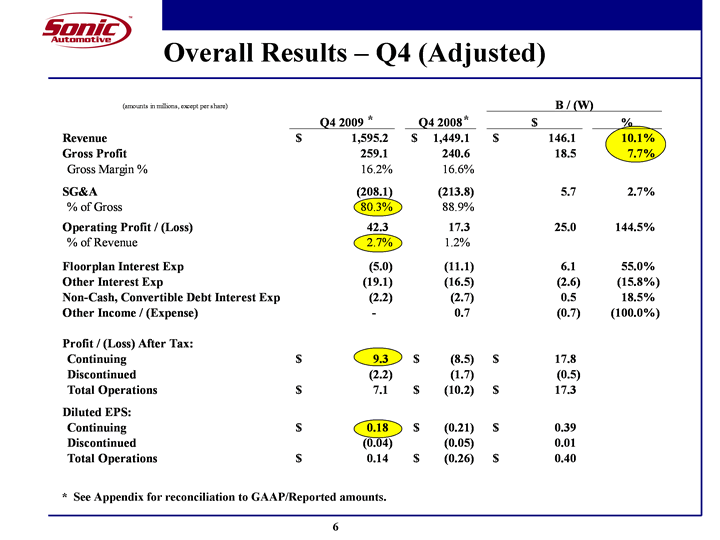
| Overall Results - Q4 (Adjusted) * * * See Appendix for reconciliation to GAAP/Reported amounts. |
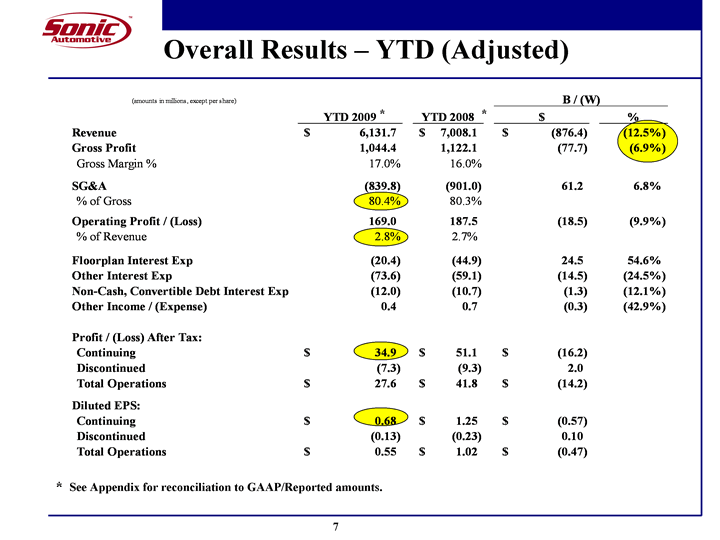
| Overall Results - YTD (Adjusted) * See Appendix for reconciliation to GAAP/Reported amounts. * * |
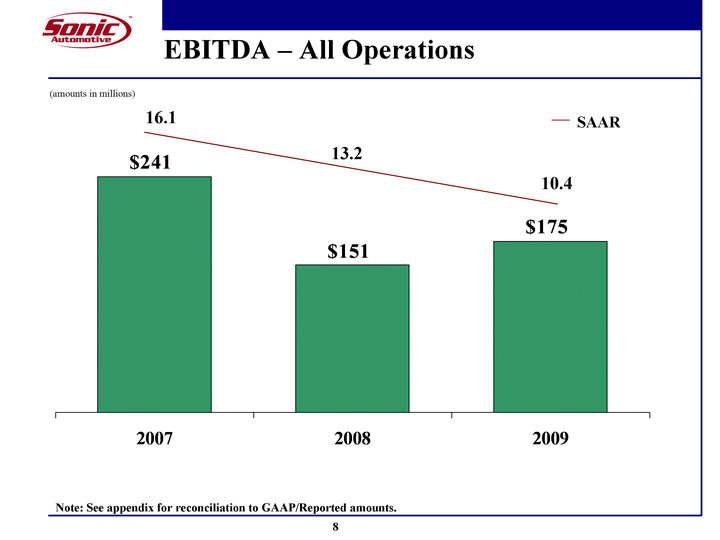
| Stack 1 SAAR Column 3 Column 4 Column 5 Column 6 Column 7 Column 8 Column 9 Column 10 Column 11 Column 12 Column 13 Column 14 Column 15 Column 16 2007 241 16.1 2008 151 13.2 2009 175 10.4 EBITDA - All Operations (amounts in millions) Note: See appendix for reconciliation to GAAP/Reported amounts. 16.1 13.2 10.4 SAAR |
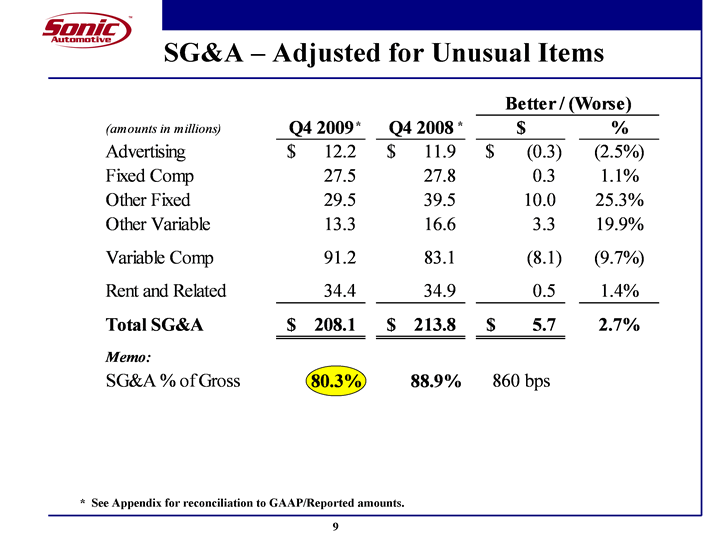
| SG&A - Adjusted for Unusual Items * See Appendix for reconciliation to GAAP/Reported amounts. * * |
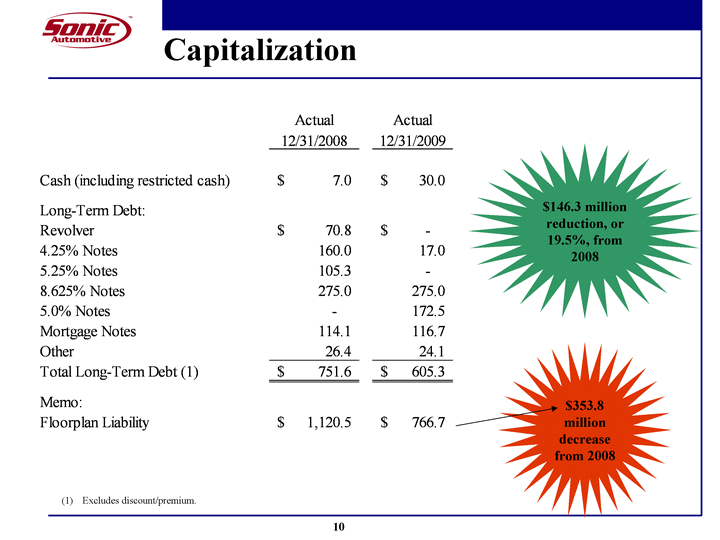
| Capitalization Excludes discount/premium. $146.3 million reduction, or 19.5%, from 2008 $353.8 million decrease from 2008 |
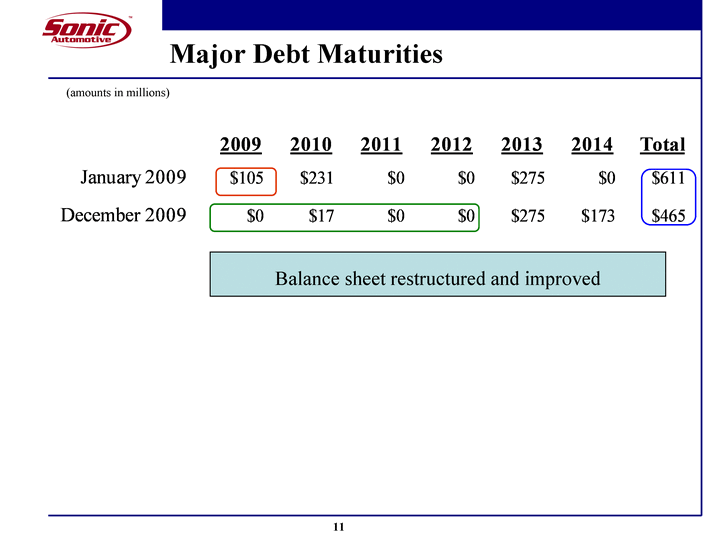
| Major Debt Maturities Balance sheet restructured and improved (amounts in millions) |
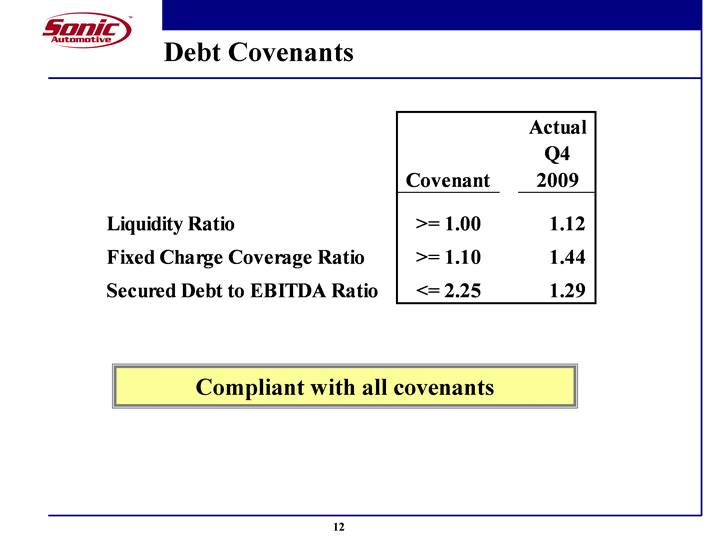
| Debt Covenants Compliant with all covenants |
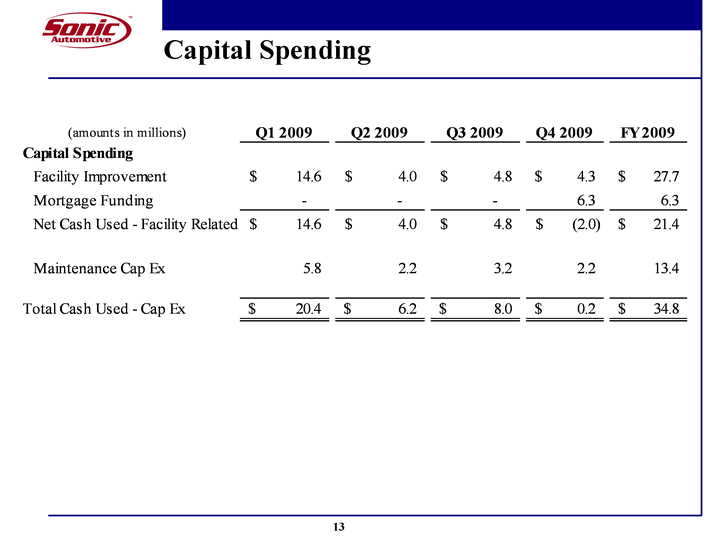
| Capital Spending |
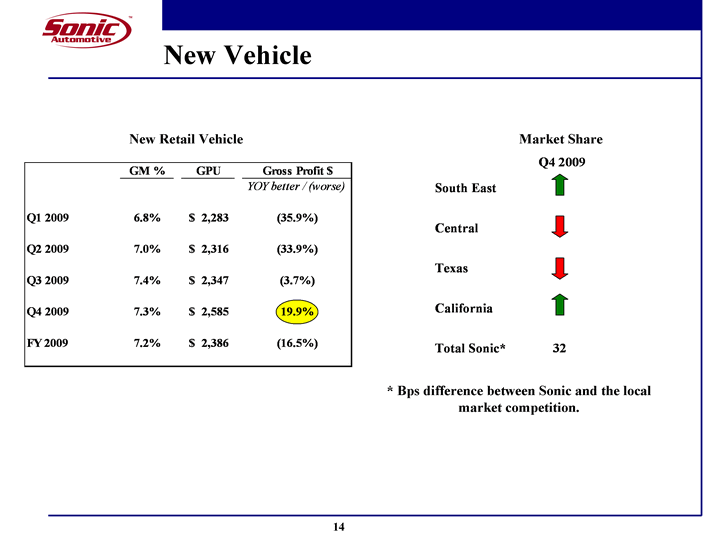
| New Vehicle * Bps difference between Sonic and the local market competition. Market Share New Retail Vehicle |
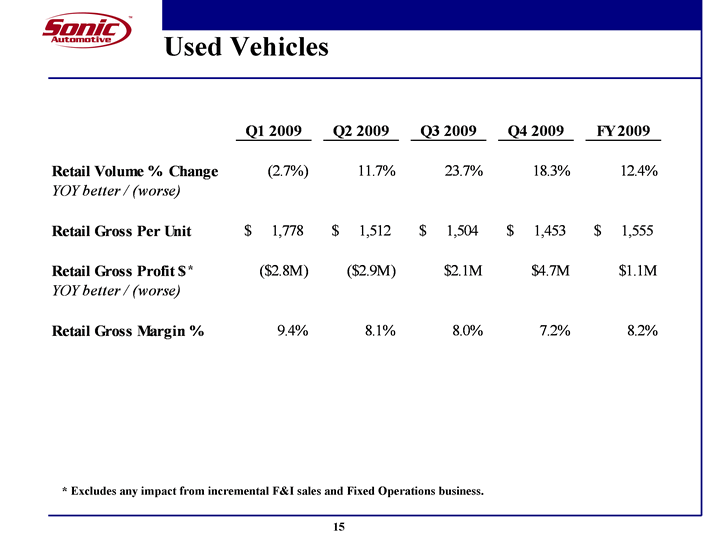
| Used Vehicles * Excludes any impact from incremental F&I sales and Fixed Operations business. * |
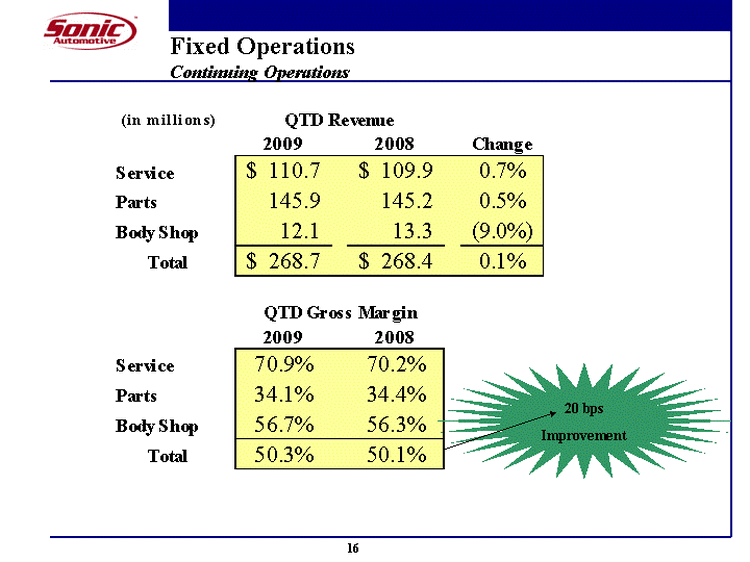
| Fixed Operations Continuing Operations 20 bps Improvement (in millions) QTD Revenue 2009 2008 Change Service Parts Body Shop Total $110.7 145.9 12.1 $268.7 $109.9 145.2 13.3 $268.4 0.7% 0.5% (9.0%) 0.1% QTD Gross Margin 2009 2008 Service Parts Body Shop Total 70.9% 34.1% 56.7% 50.3% 70.2% 34.4% 56.3% 50.1% |
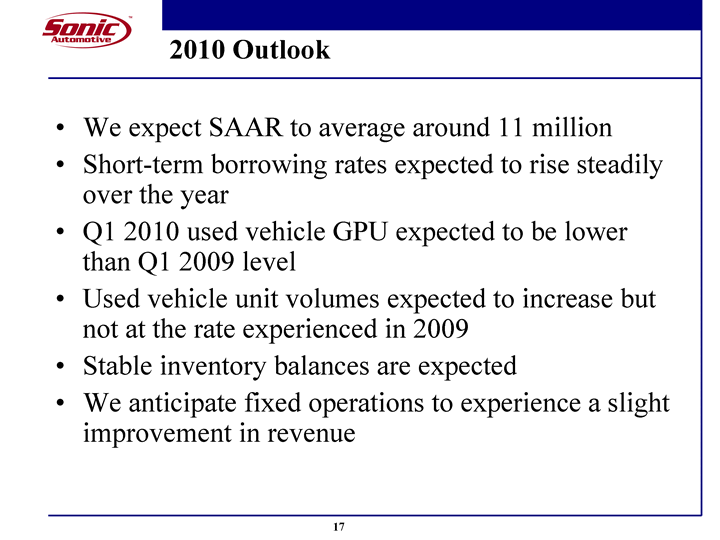
| 2010 Outlook We expect SAAR to average around 11 million Short-term borrowing rates expected to rise steadily over the year Q1 2010 used vehicle GPU expected to be lower than Q1 2009 level Used vehicle unit volumes expected to increase but not at the rate experienced in 2009 Stable inventory balances are expected We anticipate fixed operations to experience a slight improvement in revenue |
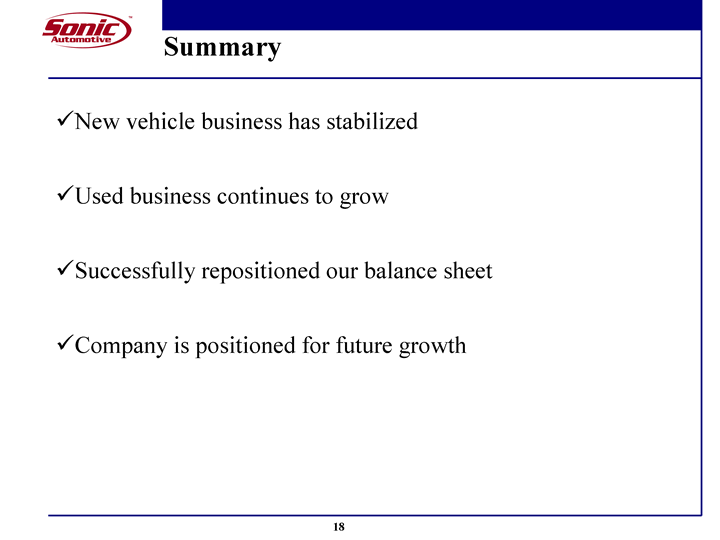
| Summary New vehicle business has stabilized Used business continues to grow Successfully repositioned our balance sheet Company is positioned for future growth |
| APPENDIX |
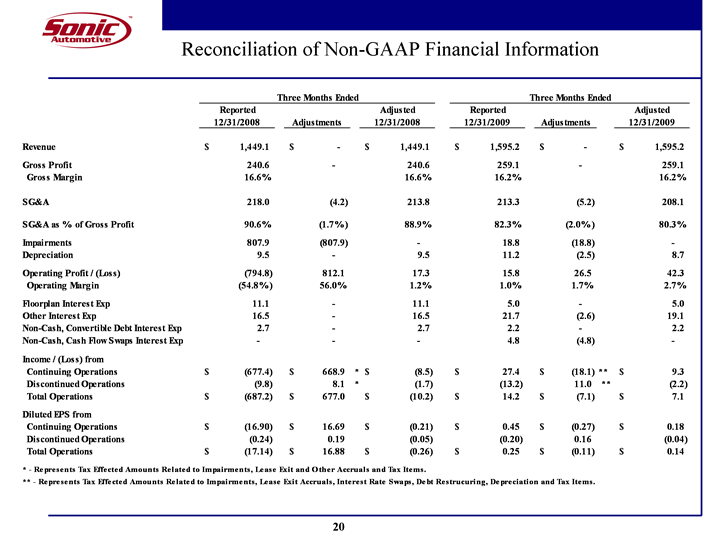
| Reconciliation of Non-GAAP Financial Information |
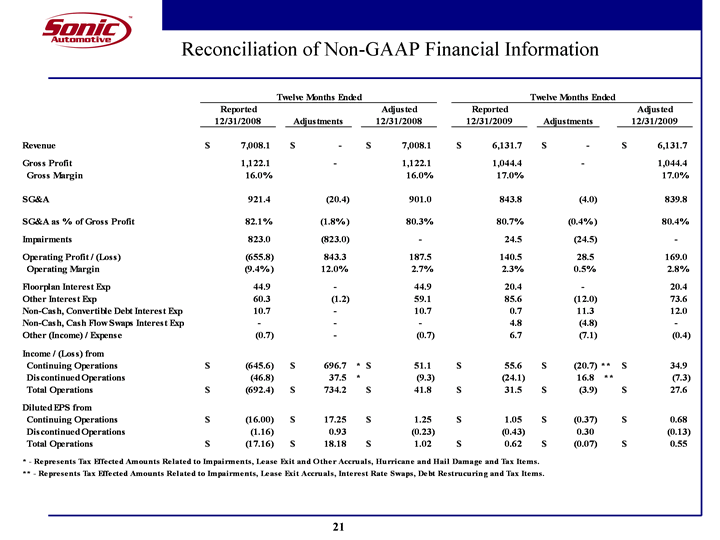
| Reconciliation of Non-GAAP Financial Information |
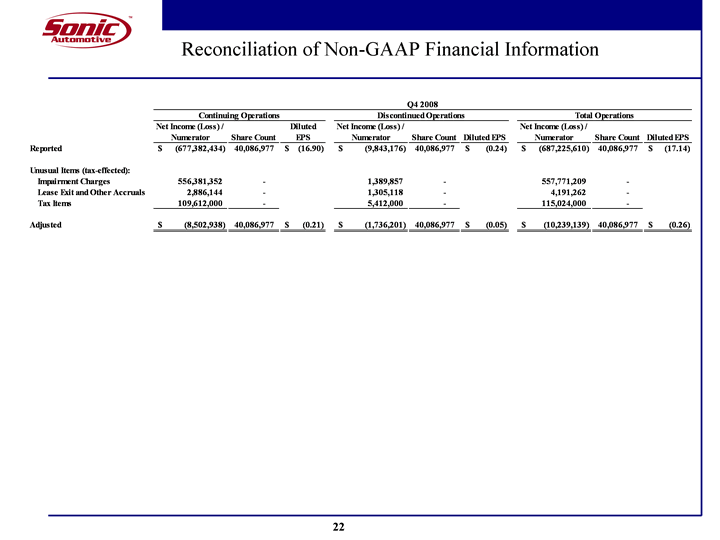
| Reconciliation of Non-GAAP Financial Information |
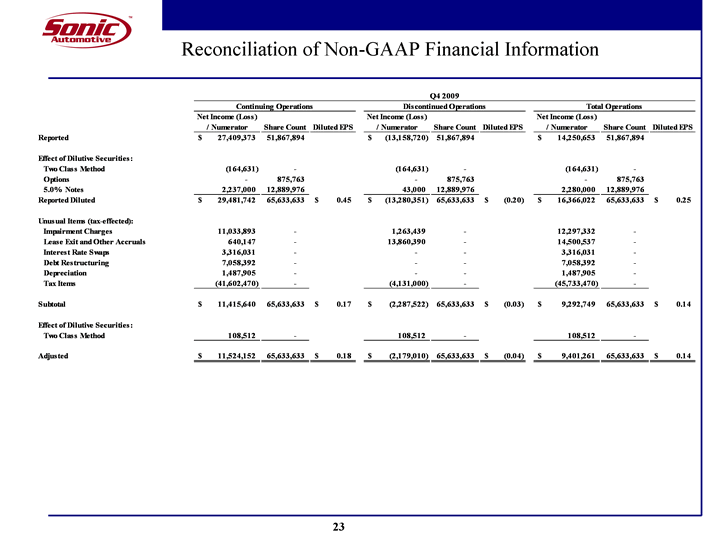
| Reconciliation of Non-GAAP Financial Information |
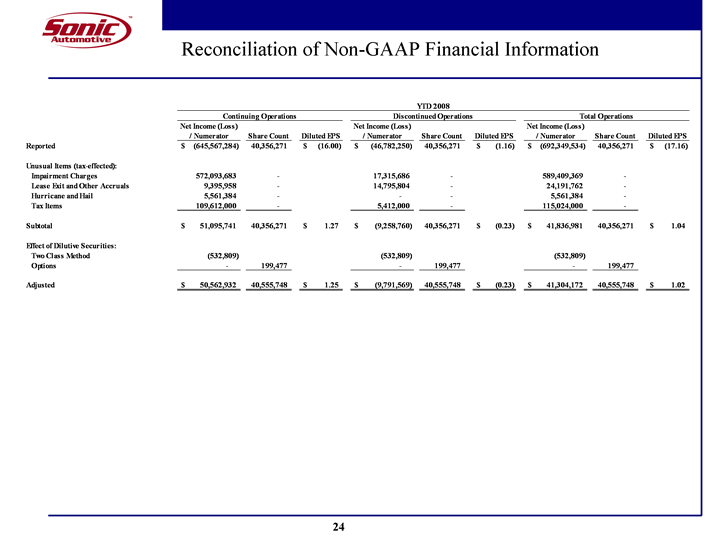
| Reconciliation of Non-GAAP Financial Information |
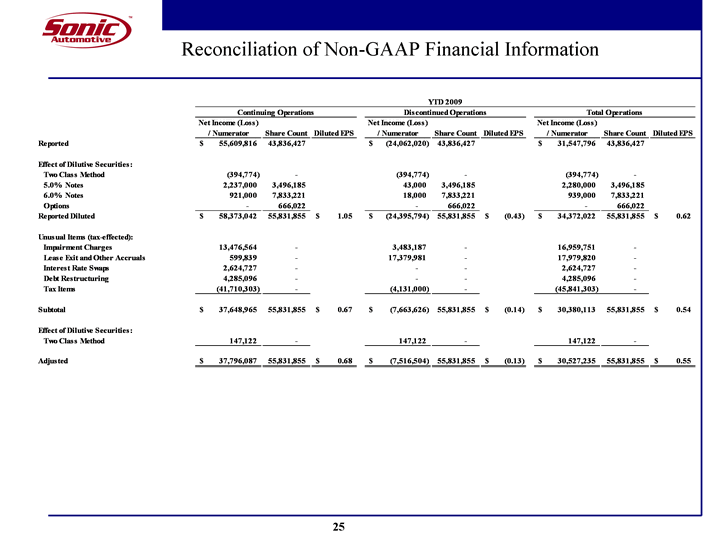
| Reconciliation of Non-GAAP Financial Information |
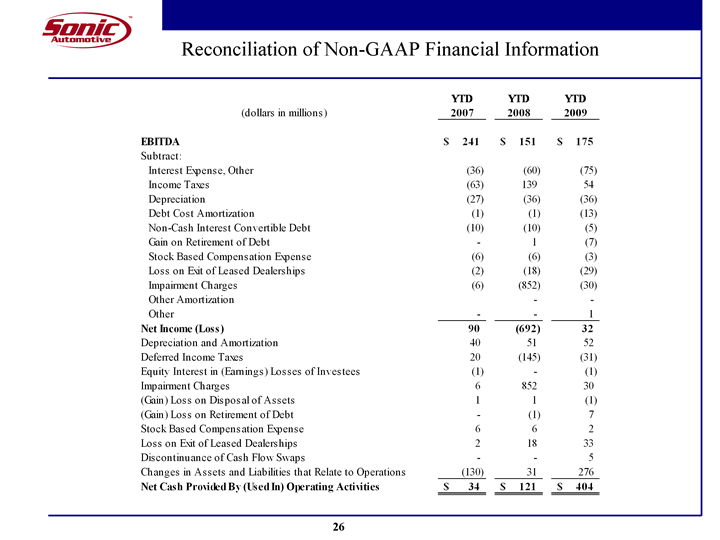
| Reconciliation of Non-GAAP Financial Information |
