
| Exhibit 99.2 |
| This presentation contains statements that constitute "forward-looking statements" within the meaning of Section 27A of the Securities Act of 1933 and Section 21E of the Securities Exchange Act of 1934. These forward-looking statements are not historical facts, but only predictions by our company and/or our company's management. These statements generally can be identified by lead-in words such as "believe," "expect" "anticipate," "intend," "plan," "foresee" and other similar words. Similarly, statements that describe our company's objectives, plans or goals are also forward-looking statements. You are cautioned that these forward-looking statements are not guarantees of future performance and involve risks and uncertainties, and that actual results may differ materially from those projected in the forward-looking statements as a result of various factors. Among others, factors that could materially adversely affect actual results and performance include those risk factors that are listed in Sonic Automotive's Form 10-K for the year ending December 31, 2009. Cautionary Notice: Forward-Looking Statements |
| First Quarter 2010 Earnings Review April 27, 2010 |
| Sonic Automotive Q1 2010 Quarter in Review Financial Review Operations Review Closing Comments |
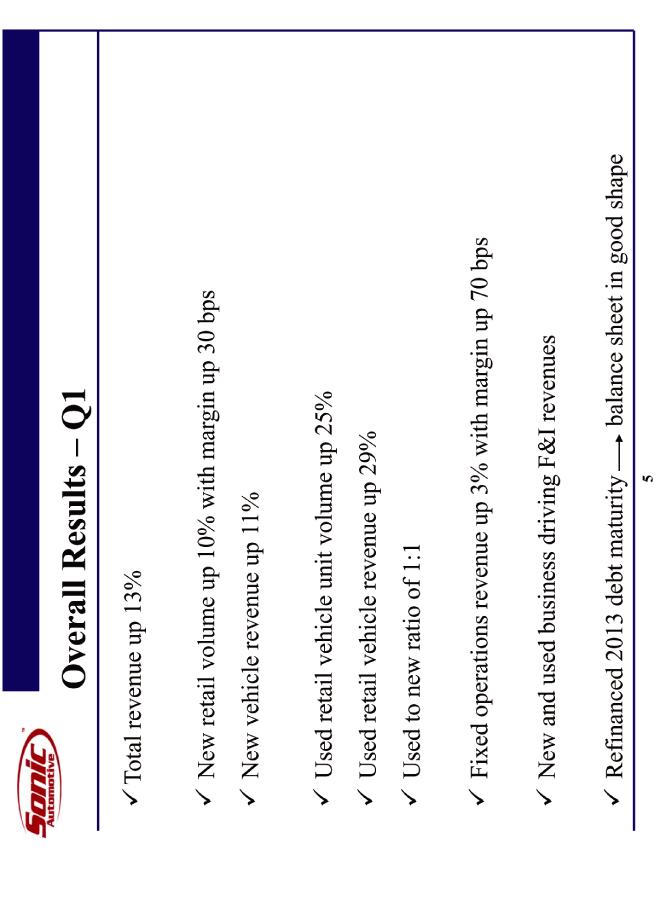
| Overall Results - Q1 Total revenue up 13% New retail volume up 10% with margin up 30 bps New vehicle revenue up 11% Used retail vehicle unit volume up 25% Used retail vehicle revenue up 29% Used to new ratio of 1:1 Fixed operations revenue up 3% with margin up 70 bps New and used business driving F&I revenues Refinanced 2013 debt maturity balance sheet in good shape |
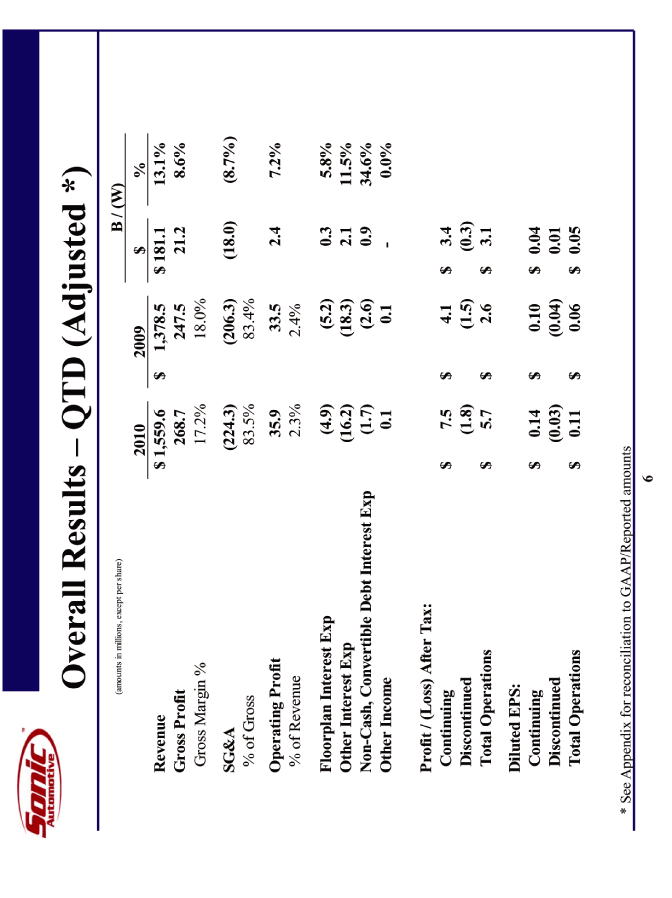
| Overall Results - QTD (Adjusted *) * See Appendix for reconciliation to GAAP/Reported amounts |
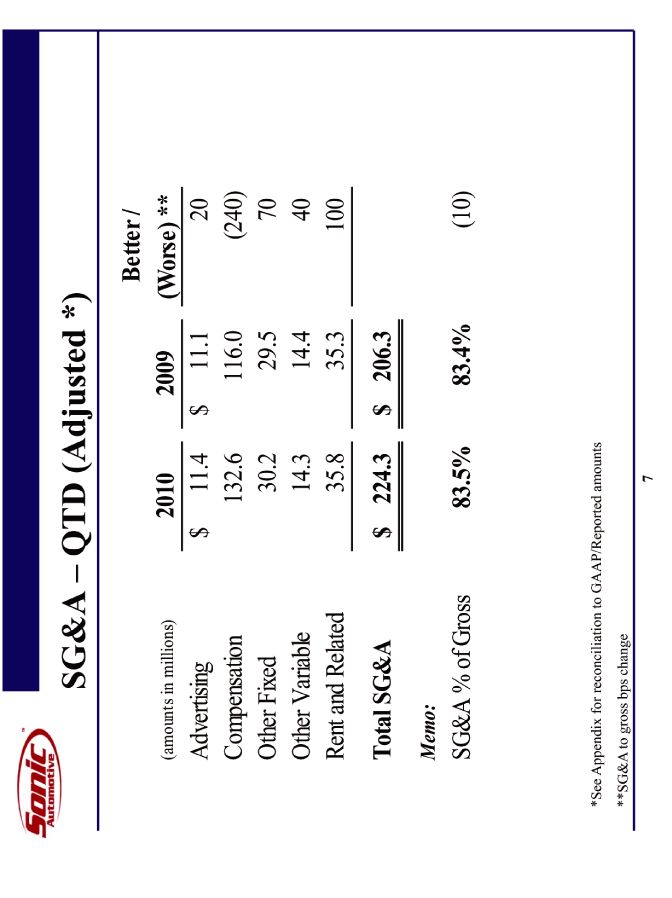
| SG&A - QTD (Adjusted *) *See Appendix for reconciliation to GAAP/Reported amounts **SG&A to gross bps change |
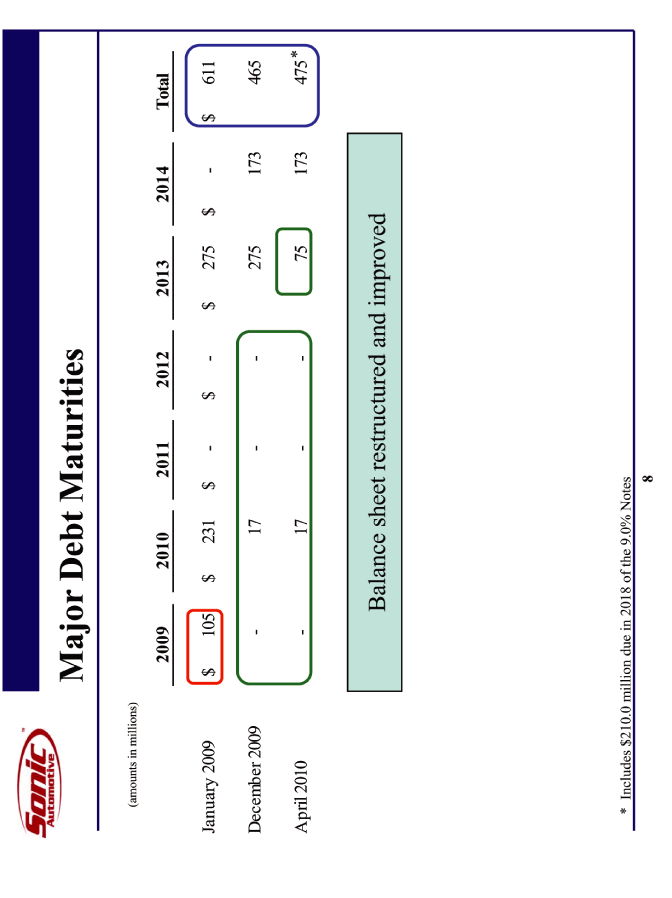
| Major Debt Maturities Balance sheet restructured and improved (amounts in millions) * * Includes $210.0 million due in 2018 of the 9.0% Notes |
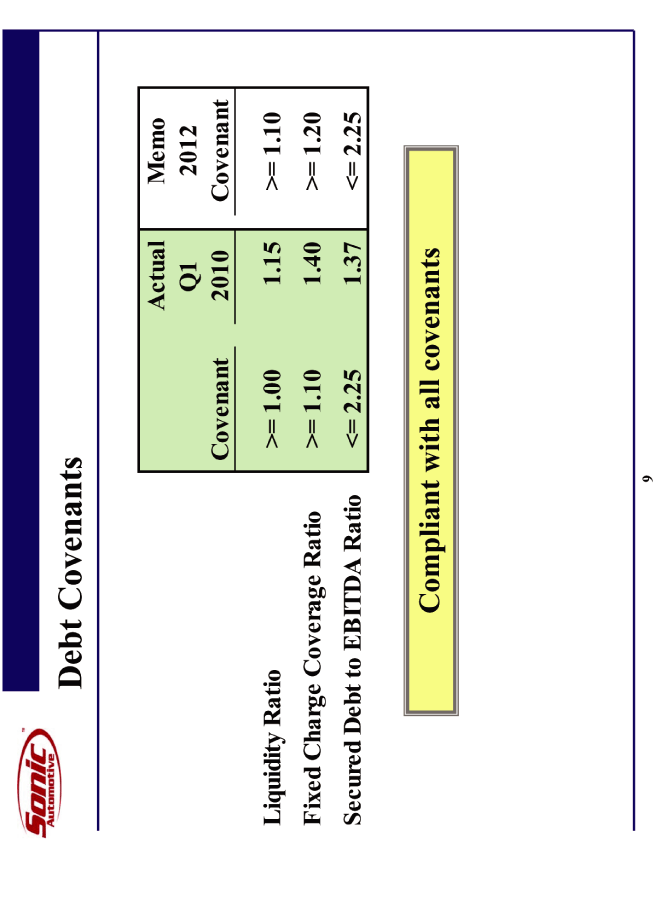
| Debt Covenants Compliant with all covenants |
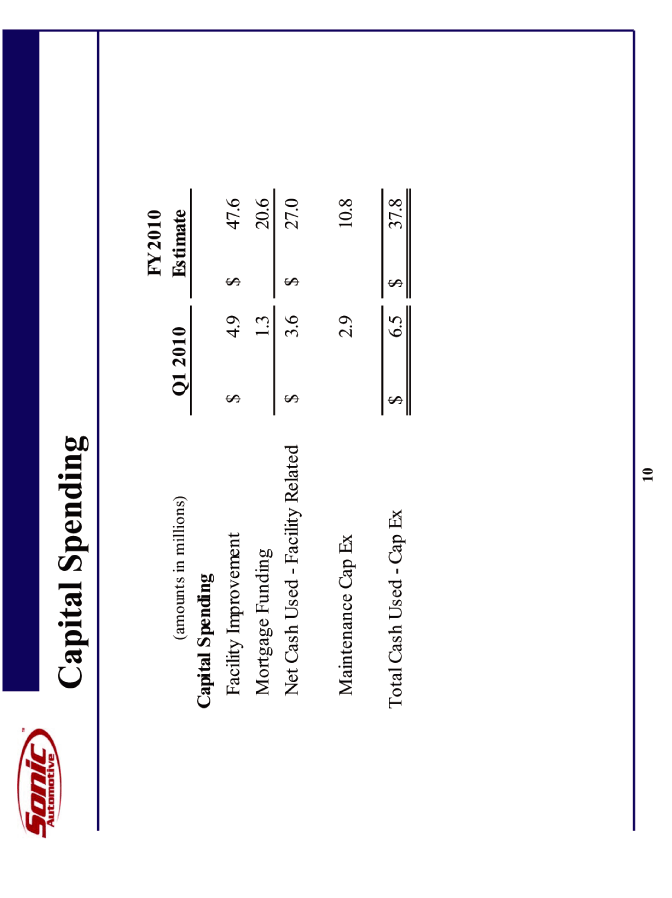
| Capital Spending |
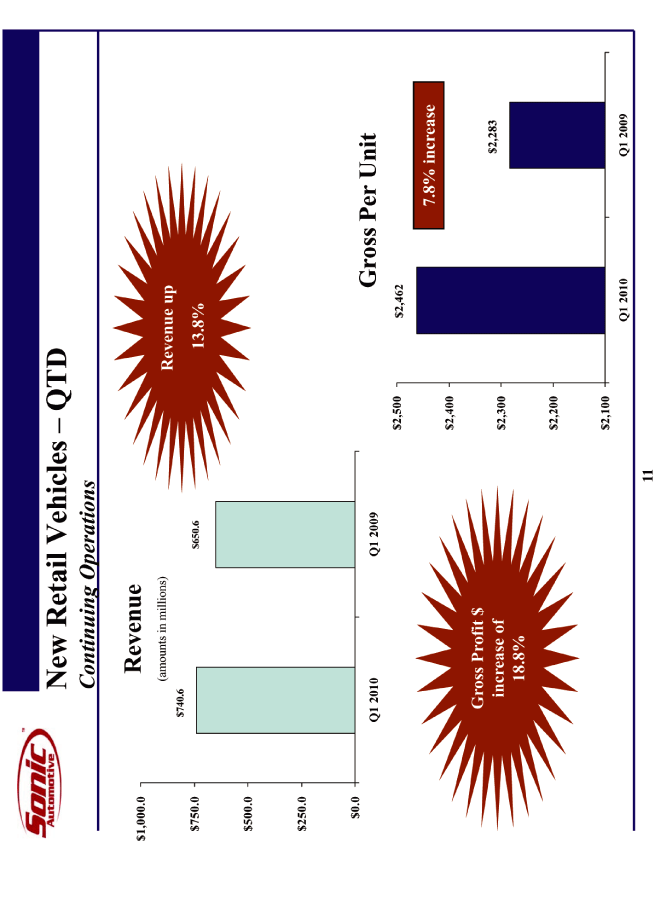
| New Retail Vehicles - QTD Continuing Operations Q1 2010 Q1 2009 740.6 650.6 Q1 2010 Q1 2009 2462 2283 Revenue (amounts in millions) Gross Per Unit Revenue up 13.8% Gross Profit $ increase of 18.8% 7.8% increase |
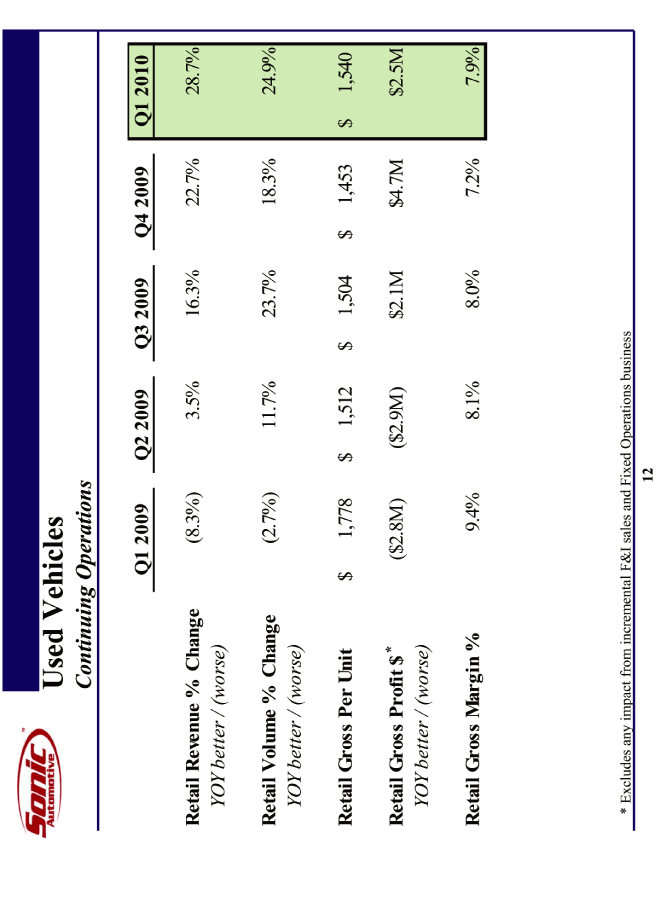
| Used Vehicles Continuing Operations * Excludes any impact from incremental F&I sales and Fixed Operations business * |
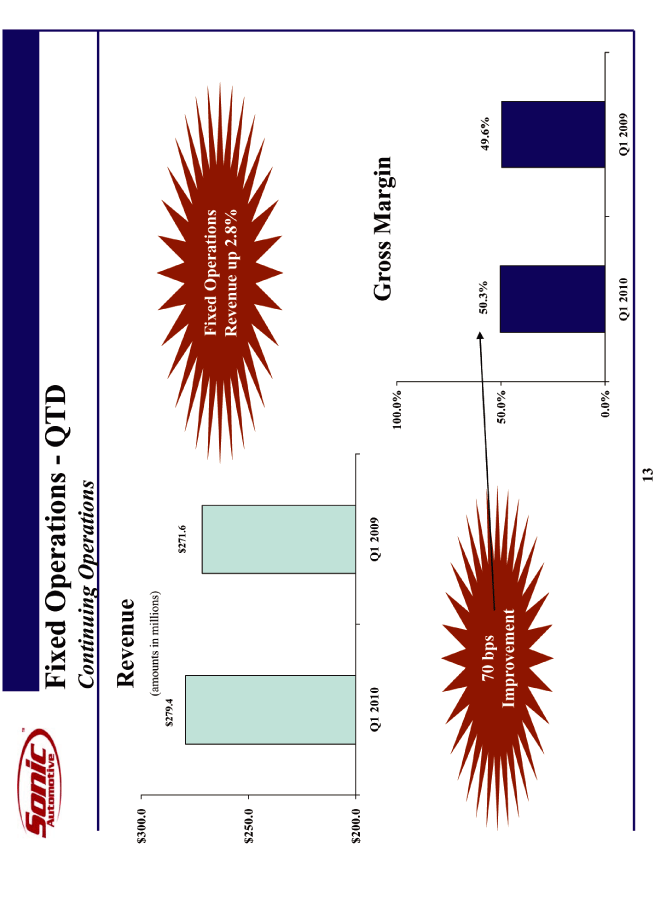
| Fixed Operations - QTD Continuing Operations Q1 2010 Q1 2009 279.4 271.6 Revenue (amounts in millions) Q1 2010 Q1 2009 0.503 0.496 Gross Margin 70 bps Improvement Fixed Operations Revenue up 2.8% |
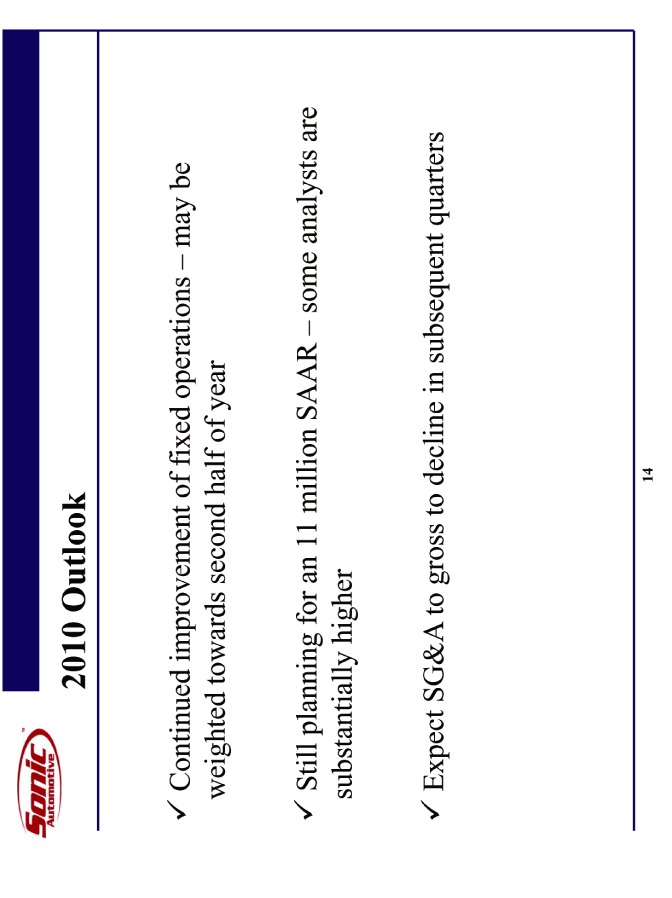
| 2010 Outlook Continued improvement of fixed operations - may be weighted towards second half of year Still planning for an 11 million SAAR - some analysts are substantially higher Expect SG&A to gross to decline in subsequent quarters |

| Summary Operational playbooks continue to drive revenue and gross gains Used business continues to grow Investments in associates and turnover reductions will benefit the future Balance sheet continues to improve - debt maturity repositioning complete |

| APPENDIX |
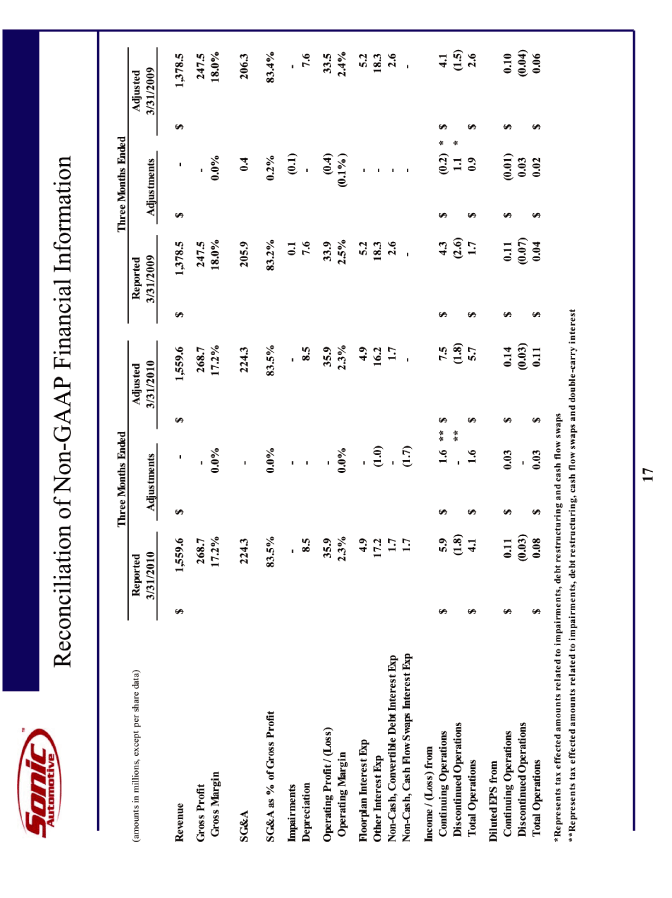
| Reconciliation of Non-GAAP Financial Information |
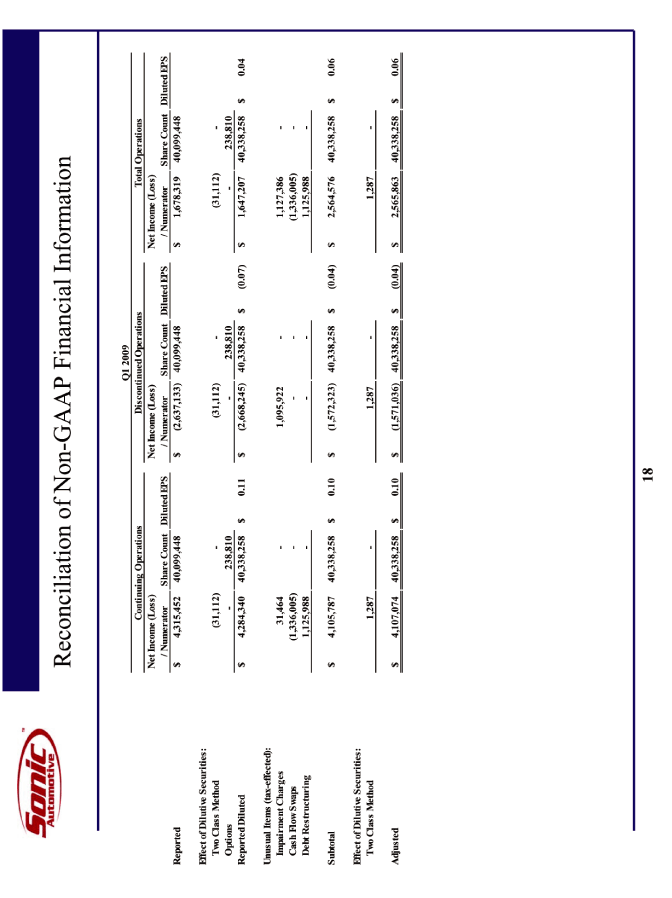
| Reconciliation of Non-GAAP Financial Information |
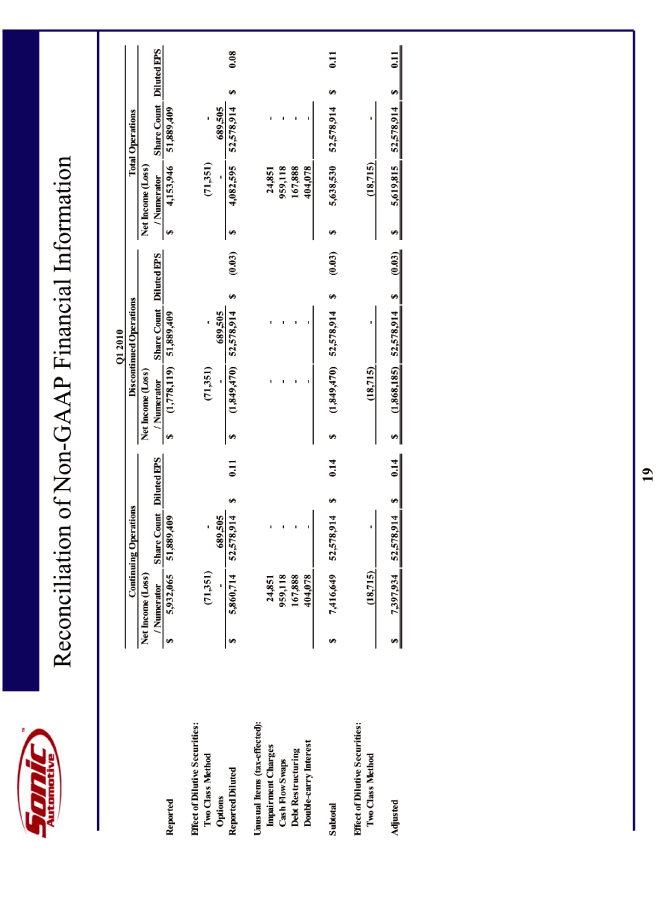
| Reconciliation of Non-GAAP Financial Information |
