UNITED STATES
SECURITIES AND EXCHANGE COMMISSION
WASHINGTON, D.C. 20549
FORM 10-K
FOR ANNUAL AND TRANSITION REPORTS PURSUANT TO SECTIONS 13 OR 15(d)
OF THE SECURITIES EXCHANGE ACT OF 1934
| x | ANNUAL REPORT PURSUANT TO SECTION 13 OR 15(d) OF THE SECURITIES EXCHANGE ACT OF 1934 |
For the year ended December 31, 2002
OR
| ¨ | TRANSITION REPORT PURSUANT TO SECTION 13 OR 15(d) OF THE SECURITIES EXCHANGE ACT OF 1934 |
For the transition period from to
Commission file number 1-13395
SONIC AUTOMOTIVE, INC.
(Exact Name of Registrant as Specified in its Charter)
| DELAWARE |
56-2010790 | |
| (State or Other Jurisdiction of Incorporation or Organization) |
(I.R.S. Employer Identification No.) | |
| 5401 EAST INDEPENDENCE BOULEVARD |
||
| P.O. BOX 18747 |
||
| CHARLOTTE, NORTH CAROLINA |
28212 | |
| (Address of Principle Executive Offices) |
(Zip Code) |
(704) 566-2400
(Registrant’s telephone number, including area code)
SECURITIES REGISTERED PURSUANT TO SECTION 12(b) OF THE ACT:
| TITLE OF EACH CLASS |
NAME OF EACH EXCHANGE WHICH REGISTERED | |
| Class A Common Stock, $.01 Par Value |
New York Stock Exchange |
Indicate by check mark whether the registrant: (1) has filed all reports required to be filed by Section 13 or 15(d) of the Securities Exchange Act of 1934 during the preceding 12 months (or for such shorter period that the registrant was required to file such reports), and (2) has been subject to such filing requirements for the past 90 days. x Yes ¨ No
Indicate by check mark if disclosure of delinquent filers pursuant to Item 405 of Regulation S-K is not contained herein, and will not be contained, to the best of registrant’s knowledge, in definitive proxy or information statements incorporated by reference in Part III of this Form 10-K or any amendment to this Form 10-K. x
Indicate by checkmark whether the registrant is an accelerated filer (as defined in Exchange Act Rule 12b-2). Yes x No ¨
The aggregate market value of the voting common stock held by non-affiliates of the registrant was approximately $768,084,095 based upon the closing sales price of the registrant’s Class A common stock on June 28, 2002 of $25.75 per share. As of March 11, 2003 there were 28,741,344 shares of Class A common stock, par value $.01 per share, and 12,029,375 shares of Class B common stock, par value $.01 per share, outstanding.
Documents incorporated by reference. Portions of the registrant’s Proxy Statement for the Annual Meeting of Stockholders to be held April 22, 2003 are incorporated by reference into Part III of this Form 10-K.
| PAGE | ||||
| PART I |
||||
| Item 1. |
4 | |||
| Item 2. |
12 | |||
| Item 3. |
12 | |||
| Item 4. |
12 | |||
| PART II |
||||
| Item 5. |
Market for the Registrant’s Common Equity and Related Stockholder Matters |
12 | ||
| Item 6. |
13 | |||
| Item 7. |
Management’s Discussion and Analysis of Financial Condition and Results of Operations |
14 | ||
| Item 7A. |
30 | |||
| Item 8. |
31 | |||
| Item 9. |
Changes in and Disagreements with Accountants on Accounting and Financial Disclosure |
31 | ||
| PART III |
||||
| Item 10. |
31 | |||
| Item 11. |
31 | |||
| Item 12. |
Security Ownership of Certain Beneficial Owners and Management and Related Stockholder Matters |
31 | ||
| Item 13. |
31 | |||
| Item 14. |
32 | |||
| Item 15. |
Exhibits, Financial Statement Schedules, and Reports on Form 8-K |
32 | ||
| 36 | ||||
| CERTIFICATIONS PURSUANT TO SECTION 302 OF SARBANES-OXLEY ACT OF 2002 |
37 | |||
| F-1 | ||||
2
This Annual Report on Form 10-K contains numerous “forward-looking statements” within the meaning of the Private Litigation Securities Reform Act of 1995. These forward looking statements address our future objectives, plans and goals, as well as our intent, beliefs and current expectations regarding future operating performance, and can generally be identified by words such as “may,” “will,” “should,” “believe,” “expect,” “anticipate,” “intend,” “plan,” “foresee” and other similar words or phrases. Specific events addressed by these forward-looking statements include, but are not limited to:
| • | future acquisitions; |
| • | industry trends; |
| • | general economic trends, including employment rates and consumer confidence levels; |
| • | vehicle sales rates and same store sales growth; |
| • | our financing plans; and |
| • | our business and growth strategies. |
These forward-looking statements are based on our current estimates and assumptions and involve various risks and uncertainties. As a result, you are cautioned that these forward looking statements are not guarantees of future performance, and that actual results could differ materially from those projected in these forward looking statements. Factors which may cause actual results to differ materially from our projections include those risks described in Exhibit 99.1 of this Form 10-K and elsewhere in this report, as well as:
| • | our ability to generate sufficient cash flows or obtain additional financing to support acquisitions, capital expenditures, our share repurchase program, and general operating activities; |
| • | the reputation and financial condition of vehicle manufacturers whose brands we represent, and their ability to design, manufacture, deliver and market their vehicles successfully; |
| • | our relationships with manufacturers which may affect our ability to complete additional acquisitions; |
| • | changes in laws and regulations governing the operation of automobile franchises, accounting standards, taxation requirements, and environmental laws; |
| • | general economic conditions in the markets in which we operate, including fluctuations in interest rates, employment levels, the level of consumer spending and consumer credit availability; |
| • | high competition in the automotive retailing industry which not only creates pricing pressures on the products and services we offer, but on businesses we seek to acquire; and |
| • | our ability to successfully integrate recent and potential future acquisitions. |
3
PART I
Sonic Automotive, Inc. was incorporated in Delaware in 1997. We are one of the largest automotive retailers in the United States. As of March 11, 2003, we operated 186 dealership franchises at 139 dealership locations, representing 34 different brands of cars and light trucks, and 45 collision repair centers in 15 states. Each of our dealerships provides comprehensive services including (1) sales of both new and used cars and light trucks, (2) sales of replacement parts and performance of vehicle maintenance, warranty, paint and repair services and (3) arrangement of extended warranty contracts and financing and insurance (“F&I”) for our automotive customers.
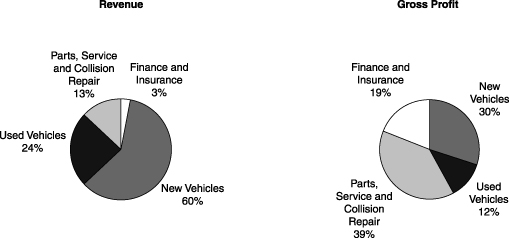
As compared to automotive manufacturers, we and other automotive retailers exhibit relatively low earnings volatility. This is primarily due to a higher ratio of variable costs that allows us to manage the majority of our expenses, such as advertising, sales commissions and vehicle carrying costs, as demand patterns change. We also have a greater diversity in our sources of revenue compared to automobile manufacturers. In addition to new vehicle sales, our revenues include used vehicle sales and parts, service and collision repair, which carry higher gross margins and are less sensitive to economic cycles and seasonal influences than are new vehicle sales. The following charts depict the diversity of our sources of revenue and gross profit for the year ended December 31, 2002:
BUSINESS STRATEGY
Further Develop Strategic Markets and Brands. Our growth strategy is focused on metropolitan markets, predominantly in the Southeast, Southwest, Midwest and California, that on average are experiencing population growth that exceeds the national average. Where practicable, we also seek to acquire franchises that we believe have above average sales prospects. We have a dealership portfolio of 34 American, European and Asian brands. A majority of our dealerships are either luxury or mid-line import brands. Our dealership network is organized into divisional and regional dealership groups. As of December 31, 2002, we operated dealerships in the following geographic areas:
4
| Region |
Number of Dealerships |
Number of Franchises |
Percent of 2002 Total Revenue |
||||
| Carolinas |
11 |
16 |
8.0 |
% | |||
| South Carolina/ Georgia |
11 |
17 |
6.3 |
% | |||
| West Florida |
8 |
8 |
7.7 |
% | |||
| East Florida |
6 |
11 |
1.8 |
% | |||
| Birmingham/Tennessee |
10 |
13 |
5.2 |
% | |||
| Alabama |
9 |
15 |
4.4 |
% | |||
| Southeastern Division |
55 |
80 |
33.4 |
% | |||
| Ohio |
6 |
10 |
3.1 |
% | |||
| Michigan |
3 |
4 |
2.7 |
% | |||
| Mid-Atlantic |
4 |
5 |
3.2 |
% | |||
| Northern Division |
13 |
19 |
9.0 |
% | |||
| Houston |
9 |
11 |
10.3 |
% | |||
| Dallas |
9 |
10 |
8.8 |
% | |||
| Oklahoma |
7 |
7 |
5.2 |
% | |||
| Colorado |
4 |
6 |
1.8 |
% | |||
| Central Division |
29 |
34 |
26.1 |
% | |||
| Northern California |
19 |
25 |
16.5 |
% | |||
| Los Angeles |
15 |
20 |
9.9 |
% | |||
| San Diego/Nevada |
8 |
8 |
5.1 |
% | |||
| Western Division |
42 |
53 |
31.5 |
% | |||
| 139 |
186 |
100.0 |
% | ||||
During 2002, we acquired 31 dealerships representing 44 franchises, and we disposed of nine dealerships representing 16 franchises.
We generally seek to acquire larger, well managed dealerships or multiple franchise dealership groups located in metropolitan or high growth suburban markets (“hub” acquisitions). We also look to acquire single franchise dealerships that will allow us to capitalize upon professional management practices and provide greater breadth of products and services in our existing markets (“spoke” acquisitions).
The automotive retailing industry remains highly fragmented. We believe that further consolidation in the auto retailing industry is likely and we intend to seek acquisitions consistent with our business strategy. We believe that attractive acquisition opportunities continue to exist for dealership groups with the capital and experience to identify, acquire, and professionally manage dealerships. We believe our “hub and spoke” acquisition strategy allows us to realize economies of scale, offer a greater breadth of products and services and increase brand diversity. We also intend to acquire dealerships that have under performed the industry average but represent attractive franchises or have attractive locations that would immediately benefit from our professional management practices.
Increase Sales of Higher Margin Products and Services. We continue to pursue opportunities to increase our sales of higher-margin products and services by expanding the following:
Finance and Insurance (“F&I”): Each sale of a new or used vehicle provides us with an opportunity to earn financing fees and to sell extended warranty service contracts. We currently offer a wide range of nonrecourse financing, leasing and insurance products to our customers. We believe there are opportunities at acquired dealerships to increase earnings from the sale of finance, insurance and warranty products. As a
5
| result of our size and scale, we have also negotiated higher commissions on the origination of customer vehicle financing, insurance policies and extended warranty contracts. |
Parts, Service & Repair (“fixed operations”): Each of our dealerships offers a fully integrated service and parts department. Manufacturers permit warranty work to be performed only at franchised dealerships. As a result, our dealerships are uniquely qualified to perform work covered by manufacturer warranties on increasingly complex vehicles. We believe we can continue to grow our profitable parts and service business by using variable rate pricing structures, focusing on customer service and efficiently managing our parts inventory.
In addition, we operated collision repair centers at 45 locations at March 11, 2003 and are in the process of constructing additional collision repair centers in order to increase capacity. We believe we can improve these operations by capitalizing on the synergies between our franchised dealerships and our collision repair centers. These synergies include access to customer networks, ready access to parts and the ability to share employees.
Emphasize Expense Control. We continually focus on controlling expenses and expanding margins at the dealerships we acquire and integrate into our organization. Approximately 63.3% of our selling, general and administrative expenses for the year ended December 31, 2002 were variable. We are able to adjust these expenses as the operating or economic environment impacting our dealerships changes. We manage variable costs, such as advertising and non-salaried compensation expenses, so that they are generally related to vehicle sales and can be adjusted in response to changes in vehicle sales volume. Salespersons, sales managers, service managers, parts managers, service advisors, service technicians and all other non-clerical dealership personnel are paid either a commission or a modest salary plus commissions. In addition, dealership management compensation is tied to individual dealership profitability.
Effectively Manage Inventory Levels. Maintaining appropriate levels of both vehicle and parts inventories has a direct impact on profitability. We believe that vehicle gross margins decline as inventory levels increase and more pressure is exerted on the sales staff to close deals. In addition, net profitability is negatively affected by the higher costs (floor plan interest and insurance) of carrying that inventory. We have implemented financial reporting systems that give us the ability to analyze our vehicle inventory on a consolidated basis.
Train, Develop and Motivate Qualified Management. We believe that our well-trained dealership personnel are key to our long-term prospects. We require all of our employees, from service technicians to regional vice presidents, to participate in our in-house training programs each year. We have expanded our Sonic Dealer Academy to include modules not only for our dealer operators but also for general sales managers and fixed operations managers. We believe that our comprehensive training of all employees and professional, multi-tiered management structure provide us with a competitive advantage over other dealership groups. This training and organizational structure provides high-level supervision over the dealerships, accurate financial reporting and the ability to maintain effective controls as we expand. In order to motivate management, we employ an incentive compensation program for each officer, vice president and dealer operator, a portion of which is provided in the form of Sonic stock options with additional incentives based on the performance of individual profit centers. We believe that this organizational structure, together with the opportunity for promotion within our large organization and for equity participation, serve as a strong motivation for our employees.
Achieve High Levels of Customer Satisfaction. We focus on maintaining high levels of customer satisfaction. Our personalized sales process is designed to satisfy customers by providing high-quality vehicles in a positive, “consumer friendly” buying environment. Some manufacturers offer specific financial incentives on a per vehicle basis if certain Customer Satisfaction Index (“CSI”) levels (which vary by manufacturer) are achieved by a dealer. In addition, all manufacturers consider CSI scores in approving acquisitions. In order to keep management focused on customer satisfaction, we include CSI results as a
6
component of our incentive compensation programs. Our success in this area is evident by the number of manufacturer awards our dealerships have received. In 2002, a number of our dealerships received BMW’s Center of Excellence award, Chrysler’s Five Star Certification, the Lexus Elite Award, Toyota’s President’s Award, Honda’s President’s Award and Infiniti’s Reward of Excellence.
Dealership Management
Our dealership operations are overseen by regional or divisional vice presidents for a particular geographic area. These vice presidents are geographically aligned with regional and divisional controllers who are responsible for maintaining effective internal controls and accurate financial reporting at each dealership. Our divisional and regional management teams use our computer-based information systems to monitor each dealership’s sales, profitability, inventory and other financial and operating data. We believe this management structure gives us a competitive advantage over many individually-owned dealerships. It allows us to effectively oversee our operations, recruit new employees and implement best practices using employees that have a thorough understanding of the local market. In addition, it gives us the ability to quickly field an experienced team of professionals to lead our acquisition due diligence and integration efforts thereby increasing the speed with which we deploy our operating strategy at acquired dealerships.
Each of our dealerships is managed by a dealer operator who is responsible for the operations of the dealership and the dealership’s financial and customer satisfaction performance. The dealer operator is responsible for selecting, training and retaining dealership personnel. All dealer operators report to Sonic’s regional vice presidents.
Each dealer operator is complemented by a team that generally includes two senior managers who aid in the operation of the dealership. The general sales manager is primarily responsible for the operations, personnel, financial performance and customer satisfaction performance of the new vehicle sales, used vehicle sales, and finance and insurance departments. The parts and service director is primarily responsible for the operations, personnel, financial and customer satisfaction performance of the service, parts and collision repair departments (if applicable). Each of the departments of the dealership typically has a manager or managers who reports to the general sales manager or parts and service director.
Sonic’s dealer operators are also supported by national directors of finance and insurance, fixed operations, field operations and sales, respectively. Each of these national directors assist the dealer operators in implementing organizational best practices. Regional directors of finance and insurance, fixed operations and collision repair centers support the national directors.
Sales and Marketing
Sonic’s marketing and advertising activities vary among our dealerships and among our markets. We advertise primarily through television, newspapers, radio and direct mail and regularly conduct special promotions designed to focus vehicle buyers on our product offerings. We also utilize computer technology to aid sales people in prospecting for customers.
Relationships with Manufacturers
Each of Sonic’s dealerships operates under a separate franchise or dealer agreement that governs the relationship between the dealership and the manufacturer. In general, each dealer agreement specifies the location of the dealership for the sale of vehicles and for the performance of certain approved services in a specified market area. The designation of such areas generally does not guarantee exclusivity within a specified territory. In addition, most manufacturers allocate vehicles on a “turn and earn” basis that rewards high volume. A dealer agreement requires the dealer to meet specified standards regarding showrooms, the facilities and equipment for servicing vehicles, inventories, minimum net working capital, personnel training and other aspects
7
of the business. The dealer agreement with each dealership also gives the related manufacturer the right to approve the dealership’s general manager and any material change in management or ownership of the dealership. Each manufacturer may terminate a dealer agreement under certain circumstances, such as a change in control of the dealership without manufacturer approval, the impairment of the reputation or financial condition of the dealership, the death, removal or withdrawal of the dealership’s general manager, the conviction of the dealership or the dealership’s owner or general manager of certain crimes, the failure to adequately operate the dealership or maintain wholesale financing arrangements, insolvency or bankruptcy of the dealership or a material breach of other provisions of the dealer agreement.
Many automobile manufacturers have developed policies regarding public ownership of dealerships. To the extent that new or amended manufacturer policies restrict the number of dealerships which may be owned by a dealership group, or the transferability of Sonic’s common stock, such policies could have a material adverse effect on us. Sonic believes that it will be able to renew at expiration all of its existing franchise and dealer agreements. Policies implemented by manufacturers include the following restrictions:
| • | The ability to force the sale of their respective franchises upon a change in control or a material change in the composition of Sonic’s Board of Directors |
| • | The ability to force the sale of their respective franchises if an automobile manufacturer or distributor acquires more than 5% of the voting power of Sonic’s securities. |
| • | The ability to force the sale of their respective franchises if an individual or entity acquires more than 20% of the voting power of Sonic’s securities, and the manufacturer disapproves of such individual’s or entity’s ownership interest. |
Many states have placed limitations upon manufacturers’ and distributors’ ability to sell new motor vehicles directly to customers in their respective states in an effort to protect dealers from practices they believe constitute unfair competition. In general, these statutes make it unlawful for a manufacturer or distributor to compete with a new motor vehicle dealer in the same brand operating under an agreement or franchise from the manufacturer or distributor in the relevant market area.
Certain states, such as Florida, Georgia, Oklahoma, South Carolina, North Carolina and Virginia, limit the amount of time that a manufacturer may temporarily operate a dealership. Further, certain states require a person who is attempting to acquire a dealership from a manufacturer or distributor to invest a specified amount of money in the dealership.
In addition, all of the states in which Sonic dealerships currently do business require manufacturers to show “good cause” for terminating or failing to renew a dealer’s franchise agreement. Further, each of the states provides some method for dealers to challenge manufacturers’ attempts to establish dealerships of the same line-make in their relevant market area.
Competition
The retail automotive industry is highly competitive. Depending on the geographic market, we compete both with dealers offering the same brands and product lines as ours and dealers offering other manufacturers’ vehicles. We also compete for vehicle sales with auto brokers and leasing companies, and with internet companies that provide customer referrals to other dealerships or who broker vehicle sales between customers and other dealerships. We compete with small, local dealerships and with large multi-franchise auto dealerships. Some of our competitors may utilize marketing techniques, such as “no negotiation” sales methods, not extensively used by us.
We believe that the principal competitive factors in vehicle sales are the marketing campaigns conducted by manufacturers, the ability of dealerships to offer a wide selection of the most popular vehicles, the location of
8
dealerships and the quality of customer service. Other competitive factors include customer preference for makes of automobiles, pricing (including manufacturer rebates and other special offers) and warranties.
In addition to competition for vehicle sales, we also compete with other auto dealers, service stores, auto parts retailers and independent mechanics in providing parts and service. We believe that the principal competitive factors in parts and service sales are price, the use of factory-approved replacement parts, the familiarity with a dealer’s makes and models and the quality of customer service. A number of regional and national chains offer selected parts and service at prices that may be lower than our prices.
In arranging or providing financing for our customers’ vehicle purchases, we compete with a broad range of financial institutions. In addition, financial institutions are now offering F&I products through the internet, which may reduce our profits on these items. We believe that the principal competitive factors in providing financing are convenience, interest rates and contract terms.
Our success depends, in part, on national and regional automobile-buying trends, local and regional economic factors and other regional competitive pressures. Conditions and competitive pressures affecting the markets in which we operate, such as price-cutting by dealers in these areas, or in any new markets we enter, could adversely affect us, although the retail automobile industry as a whole might not be affected.
Governmental Regulations and Environmental Matters
Numerous federal and state regulations govern Sonic’s business of marketing, selling, financing and servicing automobiles. Sonic also is subject to laws and regulations relating to business corporations generally.
Under the laws of the states in which we currently operate as well as the laws of other states into which we may expand, we must obtain a license in order to establish, operate or relocate a dealership or operate an automotive repair service. These laws also regulate our conduct of business, including our sales, operating, advertising, financing and employment practices. These laws also include federal and state wage-hour, anti-discrimination and other employment practices laws.
Our operations are also subject to certain consumer protection laws known as “Lemon Laws.” These laws typically require a manufacturer or dealer to replace a new vehicle or accept it for a full refund within one year after initial purchase if the vehicle does not conform to the manufacturer’s express warranties and the dealer or manufacturer, after a reasonable number of attempts, is unable to correct or repair the defect. Federal laws require certain written disclosures to be provided on new vehicles, including mileage and pricing information.
The imported automobiles purchased by us are subject to United States customs duties and, in the ordinary course of our business, we may, from time to time, be subject to claims for duties, penalties, liquidated damages, or other charges.
Our financing activities with customers are subject to federal truth-in-lending, consumer privacy, consumer leasing and equal credit opportunity regulations as well as state and local motor vehicle finance laws, installment finance laws, usury laws and other installment sales laws. Some states regulate finance fees that may be paid as a result of vehicle sales.
Federal, state and local environmental regulations, including regulations governing air and water quality, the clean-up of contaminated property and the use, storage, handling, recycling and disposal of gasoline, oil and other materials, also apply to us and our dealership properties.
We believe that we comply in all material respects with the laws affecting our business. However, claims arising out of actual or alleged violations of laws may be asserted against us or our dealerships by individuals or
9
governmental entities, and may expose us to significant damages or other penalties, including possible suspension or revocation of our licenses to conduct dealership operations and fines.
As with automobile dealerships generally, and service, parts and body shop operations in particular, our business involves the use, storage, handling and contracting for recycling or disposal of hazardous or toxic substances or wastes and other environmentally sensitive materials. Our business also involves the past and current operation and/or removal of above ground and underground storage tanks containing such substances or wastes. Accordingly, we are subject to regulation by federal, state and local authorities that establish health and environmental quality standards, provide for liability related to those standards, and in certain circumstances provide penalties for violations of those standards. We are also subject to laws, ordinances and regulations governing remediation of contamination at facilities we own or operate or to which we send hazardous or toxic substances or wastes for treatment, recycling or disposal.
We believe that we do not have any material environmental liabilities and that compliance with environmental laws and regulations will not, individually or in the aggregate, have a material adverse effect on our results of operations or financial condition. However, soil and groundwater contamination is known to exist at certain properties used by us. Further, environmental laws and regulations are complex and subject to frequent change. In addition, in connection with our acquisitions, it is possible that we will assume or become subject to new or unforeseen environmental costs or liabilities, some of which may be material. We cannot assure you that compliance with current or amended, or new or more stringent, laws or regulations, stricter interpretations of existing laws or the future discovery of environmental conditions will not require additional expenditures by Sonic, or that such expenditures will not be material.
Executive Officers of the Registrant
The executive officers are elected annually by, and serve at the discretion of, Sonic’s Board of Directors. Sonic’s executive officers as of the date of this Form 10-K, are as follows:
| NAME |
AGE |
POSITION(S) WITH SONIC | ||
| O. Bruton Smith |
76 |
Chairman, Chief Executive Officer and Director | ||
| B. Scott Smith. |
35 |
Vice Chairman, Chief Strategic Officer and Director | ||
| Theodore M. Wright. |
40 |
President, Chief Financial Officer and Director | ||
| Jeffrey C. Rachor |
41 |
Executive Vice President, Chief Operating Officer and Director | ||
| Mark J. Iuppenlatz. |
43 |
Senior Vice President of Corporate Development |
O. Bruton Smith, 76, is the Chairman, Chief Executive Officer and a director of Sonic and has served as such since Sonic’s organization in January 1997, and he currently is a director and executive officer of many of Sonic’s subsidiaries. Mr. Smith has worked in the retail automobile industry since 1966. Mr. Smith is also the Chairman and Chief Executive Officer, a director and controlling stockholder of Speedway Motorsports, Inc. (“SMI”). SMI is a public company traded on the New York Stock Exchange (the “NYSE”). Among other things, it owns and operates the following NASCAR racetracks: Atlanta Motor Speedway, Bristol Motor Speedway, Lowe’s Motor Speedway, Las Vegas Motor Speedway, Infineon Raceway and Texas Motor Speedway. He is also an executive officer and a director of each of SMI’s operating subsidiaries.
B. Scott Smith, 35, is the Vice Chairman and Chief Strategic Officer of Sonic. Prior to his appointment as Vice Chairman and Chief Strategic Officer in October 2002, Mr. Smith was the President and Chief Operating Officer of Sonic from April 1997 until May 2002. Mr. Smith has been a Sonic director since its organization in January 1997. Mr. Smith also serves as a director and executive officer of many of Sonic’s subsidiaries. Mr. Smith, who is the son of Bruton Smith, has been an executive officer of Town and Country Ford since 1993, and was a minority owner of both Town and Country Ford and Fort Mill Ford before Sonic’s acquisition of those dealerships in 1997. Mr. Smith became the General Manager of Town & Country Ford in November 1992 where he remained until his appointment as President and Chief Operating Officer of Sonic in April 1997. Mr. Smith has over 16 years experience in the automobile dealership industry.
10
Theodore M. Wright, 40, is the President and Chief Financial Officer of Sonic. He was appointed as President in October 2002 and has been the Chief Financial Officer of Sonic since April 1997. Mr. Wright has been a Sonic director since June 1997. He was the Vice President and Treasurer of Sonic from April 1997 until May 2002. He served as Sonic’s Secretary until February 9, 2000. Mr. Wright also serves as a director and executive officer of many of Sonic’s subsidiaries. Before joining Sonic, Mr. Wright was a Senior Manager and in charge of the Columbia, South Carolina office of Deloitte & Touche LLP. Before joining the Columbia office, Mr. Wright was a Senior Manager in Deloitte & Touche LLP’s National Office of Accounting Research and SEC Services Departments from 1994 to 1995.
Jeffrey C. Rachor, 41, is the Executive Vice President and Chief Operating Officer of Sonic. Prior to being appointed as Executive Vice President and Chief Operating Officer in October 2002, Mr. Rachor was Sonic’s Executive Vice President of Retail Operations. In May 1999, Mr. Rachor was appointed a director of Sonic and promoted to executive officer status. He originally joined Sonic as its Regional Vice President—Mid-South Region upon Sonic’s 1997 acquisition of dealerships in Chattanooga, Tennessee and was subsequently promoted to Vice President of Retail Operations in September 1998 and again promoted to Executive Vice President – Retail Operations in October 1999. Mr. Rachor has over 17 years of experience in automobile retailing and was the Chief Operating Officer of the Chattanooga dealerships from 1989 until their acquisition by Sonic in 1997. During this period, Mr. Rachor also served at various times as the general manager of Toyota, Saturn and Chrysler-Plymouth-Jeep-Eagle dealerships. Before then, Mr. Rachor was an assistant regional manager with America Suzuki Motor Corporation from 1987 to 1989 and held a variety of sales and marketing positions with GM’s Buick Motor Division from 1983 to 1987.
Mark J. Iuppenlatz, 43, is Sonic’s Senior Vice President of Corporate Development. Prior to being appointed to this position in May 2002, he served as Sonic’s Vice President of Corporate Development from August 1999. Before joining Sonic, Mr. Iuppenlatz served as the Executive Vice President — Acquisitions and Chief Operating Officer of Mar Mar Realty Trust (“MMRT”), a real estate investment trust specializing in sale/leaseback financing of automotive-related real estate, from September 1998 to August 1999. From 1996 to September 1998, Mr. Iuppenlatz was employed by Brookdale Living Communities, Inc., a company that owns, operates, develops and manages luxury senior housing communities, where he was responsible for the company’s development operations. From 1994 to 1996, he served as Vice President of Schlotzky’s, Inc., a publicly traded restaurant chain. From 1991 to 1994, Mr. Iuppenlatz served in Spain as the director of marketing and the assistant director of development for Kepro S.A., a real estate development company.
Employees
As of March 11, 2003, Sonic employed 12,133 people. We believe that many dealerships in the retail automobile industry have difficulty in attracting and retaining qualified personnel for a number of reasons, including the historical inability of dealerships to provide employees with an equity interest in the profitability of the dealership. We provide certain executive officers, managers and other employees with stock options and all employees with a stock purchase plan. We believe this type of equity incentive is attractive to our existing and prospective employees.
We believe that our relationships with our employees are good. Approximately 310 of our employees, primarily service technicians in our Northern California markets, are represented by a labor union. Because of our dependence on the manufacturers, however, we may be affected by labor strikes, work slowdowns and walkouts at the manufacturer’s manufacturing facilities.
Company Information
Our website is located at www.sonicautomotive.com. Our annual report on Form 10-K, quarterly reports on Form 10-Q, current reports on Form 8-K and all amendments to those reports, as well as proxy statements and other information we file with the Securities and Exchange Commission (“SEC”) are available free of charge on
11
our website. We make these documents available as soon as reasonably practicable after we file them with, or furnished them to, the SEC. Except as otherwise stated in these documents, the information contained on our website or available by hyperlink from our website is not incorporated into this Annual Report on Form 10-K or other documents we file with, or furnish to, the SEC.
Sonic’s principal executive offices are located at 5401 East Independence Boulevard, Charlotte, North Carolina 28212, and our telephone number is (704) 566-2400. We lease these offices from affiliates of Capital Automotive REIT.
Our dealerships are generally located along major U.S. or interstate highways. One of the principal factors considered by Sonic in evaluating an acquisition candidate is its location. We prefer to acquire dealerships located along major thoroughfares, primarily interstate highways with ease of access, which can be easily visited by prospective customers.
We lease substantially all of the properties utilized by our dealership operations. Our leased properties are leased from affiliates of Capital Automotive REIT and other individuals and entities. We believe that our facilities are adequate for our current needs.
Under the terms of our franchise agreements, Sonic must maintain an appropriate appearance and design of its facilities and is restricted in its ability to relocate its dealerships.
Sonic is involved, and will continue to be involved, in numerous legal proceedings arising in the ordinary course of our business, including litigation with customers, employment related lawsuits, contractual disputes and actions brought by governmental authorities. Currently, no legal proceedings are pending against or involve the Company that, in the opinion of management, could reasonably be expected to have a material adverse effect on our business, financial condition or results of operations. However, the results of these proceedings cannot be predicted with certainty, and an unfavorable resolution of one or more of these proceedings could have a material adverse effect on our business, financial condition, results of operations, cash flows and prospects.
Item 4: Submission of Matters to a Vote of Security Holders.
Not Applicable.
PART II
Item 5: Market for the Registrant’s Common Equity and Related Stockholder Matters.
Sonic’s Class A common stock is currently traded on the NYSE under the symbol “SAH.”
As of March 11, 2003, there were 28,741,344 shares of Sonic’s Class A common stock and 12,029,375 shares of Sonic’s Class B common stock outstanding. As of March 11, 2003, there were 90 record holders of the Class A common stock and four record holders of the Class B common stock. As of March 11, 2003, the closing stock price for the Class A common stock was $13.84.
Sonic intends to retain future earnings to provide funds for operations and future acquisitions. As a holding company, Sonic will depend on dividends and other payments from its subsidiary dealership operations to pay cash dividends to stockholders, as well as to meet debt service and operating expense requirements.
We do not anticipate paying any dividends in the foreseeable future. The credit agreement related to our revolving credit facility prohibits us from paying dividends to our stockholders, and the indentures governing the term of our senior subordinated notes due 2008 restrict the amount of any such dividends.
12
The following table sets forth the high and low closing sales prices for Sonic’s Class A common stock for each calendar quarter during the periods indicated as reported by the NYSE Composite Tape.
| 2002 |
High |
Low | ||
| First Quarter |
32.30 |
20.94 | ||
| Second Quarter |
38.60 |
25.50 | ||
| Third Quarter. |
25.28 |
17.11 | ||
| Fourth Quarter |
17.66 |
14.05 | ||
| 2001 |
High |
Low | ||
| First Quarter. |
8.45 |
6.00 | ||
| Second Quarter |
19.10 |
7.69 | ||
| Third Quarter. |
22.75 |
10.90 | ||
| Fourth Quarter |
23.86 |
13.00 |
During 2002, all issuances of equity securities by Sonic were registered under the Securities Act.
Item 6: Selected Financial Data.
In accordance with accounting principles generally accepted in the United States of America, the selected consolidated financial data have been retroactively restated to reflect Sonic’s two-for-one common stock split that occurred on January 25, 1999. This selected consolidated financial data should be read in conjunction with “Management’s Discussion and Analysis of Financial Condition and Results of Operations” and the consolidated financial statements and related notes included elsewhere in this Form 10-K.
We have accounted for all of our dealership acquisitions using the purchase method of accounting and, as a result, we do not include in our financial statements the results of operations of these dealerships prior to the date they were acquired by us. The selected consolidated financial data of Sonic discussed on the following page reflect the results of operations and financial positions of each of our dealerships acquired prior to December 31, 2002. As a result of the effects of our acquisitions and other potential factors in the future, the historical consolidated financial information described in selected consolidated financial data is not necessarily indicative of the results of operations and financial position of Sonic in the future or the results of operations and financial position that would have resulted had such acquisitions occurred at the beginning of the periods presented in the selected consolidated financial data.
| Year Ended December 31, | |||||||||||||||
| 1998 |
1999 |
2000 |
2001 |
2002(2) | |||||||||||
| (dollars and shares in thousands except per share amounts) | |||||||||||||||
| Income Statement Data (1): |
|||||||||||||||
| Total revenues |
$ |
1,401,991 |
$ |
2,977,276 |
$ |
5,444,301 |
$ |
5,879,909 |
$ |
7,071,015 | |||||
| Operating income |
$ |
47,525 |
$ |
108,773 |
$ |
200,544 |
$ |
200,238 |
$ |
235,207 | |||||
| Income from continuing operations before income taxes |
$ |
26,751 |
$ |
69,994 |
$ |
117,893 |
$ |
133,163 |
$ |
175,330 | |||||
| Net income from continuing operations |
$ |
16,743 |
$ |
42,797 |
$ |
72,880 |
$ |
81,487 |
$ |
108,509 | |||||
| Basic net income per share from continuing operations |
$ |
0.73 |
$ |
1.35 |
$ |
1.71 |
$ |
2.01 |
$ |
2.60 | |||||
| Diluted net income per share from continuing operations |
$ |
0.67 |
$ |
1.21 |
$ |
1.66 |
$ |
1.96 |
$ |
2.51 | |||||
| Consolidated Balance Sheet Data (3): |
|||||||||||||||
| Total assets |
$ |
576,103 |
$ |
1,501,102 |
$ |
1,784,576 |
$ |
1,810,369 |
$ |
2,375,308 | |||||
| Long-term debt (4) |
|
145,790 |
|
425,894 |
|
493,309 |
|
519,963 |
|
645,809 | |||||
| Total liabilities |
|
433,674 |
|
1,098,529 |
|
1,333,654 |
|
1,293,108 |
|
1,738,130 | |||||
| Stockholders’ equity (5) |
|
142,429 |
|
402,573 |
|
450,922 |
|
517,261 |
|
637,178 | |||||
13
| (1) | In accordance with the provisions of Statement of Financial Accounting Standards (SFAS) No. 144: Accounting for the Impairment or Disposal of Long-Lived Assets, adopted January 1, 2002, income statement data in prior years reflect the reclassification of the results of operations of all dealerships sold during 2002 and held for sale as of December 31, 2002 to income from discontinued operations. |
| (2) | In accordance with the provisions of SFAS No. 142: Goodwill and Other Intangible Assets, effective January 1, 2002, goodwill is no longer amortized. See Note 1 to the accompanying consolidated financial statements. |
| (3) | Certain prior year amounts have been reclassified to conform with the current year presentation. See Note 1 to our Consolidated Financial Statements. |
| (4) | Long-term debt includes current maturities of long-term debt and the note payable to Sonic's Chairman. See Sonic's Consolidated Financial Statements and related notes included elsewhere in this Form 10-K. |
| (5) | No cash dividends were paid in the 5 years presented. |
Item 7: Management’s Discussion and Analysis of Financial Condition and Results of Operations.
The following discussion and analysis of the results of operations and financial condition should be read in conjunction with the Sonic Automotive, Inc. and Subsidiaries Consolidated Financial Statements and the related notes thereto appearing elsewhere in this report.
Overview
We are one of the largest automotive retailers in the United States. As of March 11, 2003 we operated 186 dealership franchises, representing 34 different brands of cars and light trucks, at 139 locations and 45 collision repair centers in 15 states. Our dealerships provide comprehensive services including sales of both new and used cars and light trucks, sales of replacement parts, performance of vehicle maintenance, warranty, paint and collision repair services, and arrangement of extended warranty contracts, financing and insurance for our customers. Our brand diversity allows us to offer a broad range of products at a wide range of prices from lower priced, or economy vehicles, to luxury vehicles. We believe that this diversity reduces the risk of changes in customer preferences, product supply shortages and aging products. In addition, although vehicle sales are cyclical and are affected by many factors, including general economic conditions, consumer confidence, levels of discretionary personal income, interest rates and available credit, our parts, service and collision repair services are not closely tied to vehicle sales and are not dependent upon near-term sales volume. As a result, we believe the diversity of these products and services reduces the risk of periodic economic downturns.
14
The following table depicts the breakdown of our new vehicle revenues by brand for each of the past three years:
| Percentage of New Vehicle Revenues |
|||||||||
| Year Ended December 31, |
|||||||||
| Brand (1) |
2000 |
2001 |
2002 |
||||||
| General Motors (2) |
10.6 |
% |
12.0 |
% |
21.8 |
% | |||
| Ford |
13.9 |
% |
18.9 |
% |
17.1 |
% | |||
| Honda |
14.7 |
% |
13.2 |
% |
13.2 |
% | |||
| Toyota |
8.9 |
% |
11.7 |
% |
10.4 |
% | |||
| BMW |
11.3 |
% |
11.5 |
% |
10.3 |
% | |||
| Chrysler (3) |
11.8 |
% |
8.1 |
% |
6.4 |
% | |||
| Lexus |
5.8 |
% |
5.7 |
% |
4.5 |
% | |||
| Nissan |
5.6 |
% |
4.9 |
% |
3.1 |
% | |||
| Other Luxury (4) |
11.1 |
% |
9.0 |
% |
8.3 |
% | |||
| Other (5) |
6.3 |
% |
5.0 |
% |
4.9 |
% | |||
| Total |
100.0 |
% |
100.0 |
% |
100.0 |
% | |||
| (1) | In accordance with the provisions of SFAS No. 144, adopted January 1, 2002, revenue data in prior years reflects the reclassification of the results of operations of all dealerships sold during 2002 or held for sale as of December 31, 2002 to discontinued operations. |
| (2) | Includes Buick, Cadillac, Chevrolet, GMC, Oldsmobile, and Pontiac. |
| (3) | Includes Chrysler, Dodge, Jeep, and Plymouth. |
| (4) | Includes Acura, Audi, Hummer, Infiniti, Land Rover, Mercedes, Porsche, Saab, and Volvo. |
| (5) | Includes Hyundai, Isuzu, KIA, Lincoln, Mazda, Mercury, Mitsubishi, Subaru, and Volkswagen. |
We sell similar products and services, use similar processes in selling our products and services and sell our products and services to similar classes of customers. As a result of this and the way we manage our business, we have aggregated our results into a single segment for purposes of reporting financial condition and results of operations.
We have accounted for all of our dealership acquisitions using the purchase method of accounting and, as a result, we do not include in our consolidated financial statements the results of operations of these dealerships prior to the date they were acquired. Our consolidated financial statements discussed below reflect the results of operations, financial position and cash flows of each of our dealerships acquired prior to December 31, 2002. As a result of the effects of our acquisitions and other potential factors in the future, the historical consolidated financial information described in “Management’s Discussion and Analysis of Financial Condition and Results of Operations” is not necessarily indicative of the results of operations, financial position and cash flows which would have resulted had such acquisitions occurred at the beginning of the periods presented, nor is it indicative of future results of operations, financial position and cash flows.
Use of Estimates and Critical Accounting Policies
The preparation of financial statements in conformity with accounting principles generally accepted in the United States of America requires management to make estimates and assumptions that affect the reported amounts of assets and liabilities and disclosure of contingent assets and liabilities at the date of the financial statements and the reported amounts of revenues and expenses during the reporting period. Actual results could differ from those estimates.
Critical accounting policies are those that are both most important to the portrayal of our financial position and results of operations and require the most subjective and complex judgments. Following is a discussion of
15
what we believe are our critical accounting policies and estimates. See Note 1 to our consolidated financial statements for additional discussion regarding our accounting policies.
Finance and Service Contracts—We arrange financing for customers through various financial institutions and receive a commission from the lender equal to the difference between the actual interest rates charged to customers and the predetermined base rates set by the financing institution. We also receive commissions from the sale of various insurance contracts and non-recourse third party extended service contracts to customers. Under these contracts, the applicable manufacturer or third party warranty company is directly liable for all warranties provided within the contract.
In the event a customer terminates a financing, insurance or warranty contract prior to the original termination date, we may be required to return a portion of the commission revenue originally recorded to the third party provider (“chargebacks”). The commission revenue for the sale of these products and services is recorded net of estimated chargebacks at the time of sale. Our estimate of future chargebacks is established based on our historical chargeback rates and the termination provisions of the applicable contracts. While chargeback rates vary depending on the type of contract sold, a 100 basis point increase in the estimated chargeback rates used in determining our estimates of future chargebacks would have resulted in an additional $0.6 million in recorded chargebacks.
Goodwill—Goodwill and other intangible assets having indefinite useful lives are tested for impairment at least annually, or more frequently when events or circumstances indicate that impairment might have occurred. In evaluating goodwill for impairment, we compare the carrying value to the fair value of the underlying businesses. We use various assumptions in determining fair value, including estimates of future earnings, future growth rates, earnings multiples and discount factors. We are subject to financial statement risk to the extent goodwill balances are impaired due to decreases in the fair market value of the underlying businesses.
Insurance Reserves—We have various self-insured and high deductible insurance programs which require us to make estimates in determining the ultimate liability we may incur for claims arising under these programs. These insurance reserves are estimated by management using actuarial evaluations based on historical claims experience, claims processing procedures, medical cost trends and, in the case of reserves for workers’ compensation claims, a discount factor. At December 31, 2002, we had $10.6 million reserved for such programs. For each one percentage point increase in the assumed medical trend rate, the reserve for our medical insurance program would increase by $52,000. Each one day increase in the average claim lag would cause the reserve to increase by $87,000. We used an experience modification factor in estimating reserves for workers’ compensation claims of 0.73. A change of five basis points in this factor would change the reserve by $300,000. We also used a discount rate of 5.0% to calculate the present value of our estimated workers’ compensation claims. A change of 100 basis points in the discount rate would change the reserve by $150,000.
Legal Proceedings—Sonic is involved, and will continue to be involved, in numerous legal proceedings arising in the ordinary course of our business, including litigation with customers, employment related lawsuits, contractual disputes and actions brought by governmental authorities. Currently, no legal proceedings are pending against or involve Sonic that, in the opinion of management, could reasonably be expected to have a material adverse effect on our business, financial condition or results of operations. However, the results of these proceedings cannot be predicted with certainty, and an unfavorable resolution of one or more of these proceedings could have a material adverse effect on our business, financial condition, results of operations, cash flows and prospects.
Recent Accounting Pronouncements
The Financial Accounting Standards Board (“FASB”) issued Statement of Financial Accounting Standards (“SFAS”) No. 142, Goodwill and Other Intangible Assets in June 2001. Among other things, SFAS 142 no longer permits the amortization of goodwill, but requires that the carrying amount of goodwill be reviewed and
16
reduced with a charge against operations if it is found to be impaired. SFAS 142 also requires the amortization of intangible assets other than goodwill over their useful economic lives, unless the useful economic life is determined to be indefinite. Intangible assets determined to have a finite life are required to be reviewed for impairment in accordance with SFAS 144: Accounting for Impairment or Disposal of Long-Lived Assets. Intangible assets that are determined to have an indefinite economic life are not amortized and must be reviewed for impairment in accordance with the terms of SFAS 142. We have not recognized any impairment related to the goodwill or other intangible assets recorded on our balance sheet.
The provisions of SFAS 142 applied immediately to all acquisitions completed after June 30, 2001. Goodwill and intangible assets with indefinite lives existing at June 30, 2001 were amortized until December 31, 2001. Effective January 1, 2002, such amortization ceased, as all of the provisions became effective on that date.
We also adopted the provisions of SFAS No. 144: Accounting for the Impairment or Disposal of Long-Lived Assets as of January 1, 2002. SFAS 144 establishes a single accounting model for assets to be disposed of by sale whether previously held and used or newly acquired. SFAS 144 requires certain long-lived assets to be reported at the lower of carrying amount or fair value, less cost to sell, and provides guidance in asset valuation and measuring impairment. The results of operations of those dealerships disposed of and those dealerships held for sale are now required to be reflected in discontinued operations as shown in the accompanying consolidated statements of income.
In April 2002, the FASB issued SFAS No. 145: Rescission of FASB Statements No. 4, 44 and 64, Amendment of FASB Statement No. 13, and Technical Corrections. Prior to adoption, gains or losses resulting from extinguishment of debt were required to be classified as extraordinary items, net of related tax effects. Upon adoption of SFAS 145, however, the classification of such gains or losses as extraordinary must be evaluated based on the criteria established in APB Opinion No. 30. Gains and losses not meeting that criterion, including gains and losses classified as extraordinary in prior periods, must be classified in income from operations. We adopted the provisions of SFAS 145 effective July 1, 2002. Accordingly, gains or losses incurred on the early extinguishment of debt (debt repurchases) have been included in other income in the accompanying consolidated statements of income.
In June 2002, the FASB issued SFAS No. 146, “Accounting for Costs Associated with Exit or Disposal Activities.” SFAS 146 requires the recognition of a liability for costs associated with an exit or disposal activity at the time the liability is incurred, rather than at the date of the entity’s commitment to the exit or disposal plan. The provisions of SFAS 146 are effective for exit or disposal activities initiated after December 31, 2002. We do not expect the adoption of SFAS 146 to have a material effect on our consolidated operating results, financial position, or cash flows.
In November 2002, the FASB issued FASB Interpretation (“FIN”) No. 45, “Guarantor’s Accounting and Disclosure Requirements for Guarantees of Indebtedness of Others.” FIN 45 requires the recognition of a liability for certain guarantees issued after December 31, 2002, or for modifications made after December 31, 2002 to previously issued guarantees, and clarifies disclosure requirements for certain guarantees. The disclosure provisions of FIN 45 are effective for fiscal years ended after December 15, 2002. We have adopted the disclosure provisions of FIN 45 as of December 31, 2002.
In January 2003, the FASB issued FIN 46, “Consolidation of Variable Interest Entities, an Interpretation of APB No. 50.” FIN 46 requires the consolidation of certain variable interest entities by the primary beneficiary if the equity investors do not have a controlling financial interest or sufficient equity at risk to finance the entities’ activities without additional subordinated financial support of other parties. The provisions of FIN 46 are effective for all variable interest entities created or acquired after January 31, 2003. For variable interest entities created or acquired prior to that date, the provisions of FIN 46 must be applied for the first interim or annual period beginning after June 15, 2003. The adoption of FIN 46 is not expected to have a material impact on our consolidated results of operations, financial position or cash flows.
17
Results of Operations
The following table summarizes the percentages of total revenues represented by certain items reflected in our Consolidated Statements of Income.
| Percentage of Total Revenues for the Year Ended December 31, |
|||||||||
| 2000 |
2001 |
2002 |
|||||||
| Revenues: |
|||||||||
| New vehicles |
59.2 |
% |
60.0 |
% |
60.4 |
% | |||
| Used vehicles |
19.5 |
% |
18.2 |
% |
17.2 |
% | |||
| Wholesale vehicles |
7.0 |
% |
6.5 |
% |
6.7 |
% | |||
| Parts, service and collision repair |
11.5 |
% |
12.3 |
% |
12.8 |
% | |||
| Finance and insurance and other |
2.8 |
% |
3.0 |
% |
2.9 |
% | |||
| Total revenues |
100.0 |
% |
100.0 |
% |
100.0 |
% | |||
| Cost of sales |
85.0 |
% |
84.6 |
% |
84.6 |
% | |||
| Gross profit |
15.0 |
% |
15.4 |
% |
15.4 |
% | |||
| Selling, general and administrative |
10.9 |
% |
11.6 |
% |
12.0 |
% | |||
| Depreciation |
0.1 |
% |
0.1 |
% |
0.1 |
% | |||
| Goodwill amortization |
0.3 |
% |
0.3 |
% |
0.0 |
% | |||
| Operating income |
3.7 |
% |
3.4 |
% |
3.3 |
% | |||
| Interest expense, floor plan |
0.8 |
% |
0.5 |
% |
0.3 |
% | |||
| Interest expense, other |
0.7 |
% |
0.6 |
% |
0.5 |
% | |||
| Income from continuing operations before income taxes |
2.2 |
% |
2.3 |
% |
2.5 |
% | |||
| Income tax expense |
0.9 |
% |
0.9 |
% |
1.0 |
% | |||
| Net income from continuing operations |
1.3 |
% |
1.4 |
% |
1.5 |
% | |||
See Note 1 to the accompanying consolidated financial statements.
During the year ended December 31, 2002, we disposed of 16 franchises and had approved, but not completed, the disposition of ten additional franchises. In accordance with the provisions of SFAS 144, the results of operations of these dealerships, including gains or losses on disposition, have been included in net income from discontinued operations in the accompanying Consolidated Statements of Income for all periods presented. In addition to these dispositions, during the year ended December 31, 2001 and 2000, we disposed of 15 and 8 franchises, respectively. However, because the provisions of SFAS 144 do not permit retroactive application to dispositions occurring before January 1, 2002, the results of operations of these dealerships have been included in net income from continuing operations in the accompanying Consolidated Statements of Income. As a result, a comparison of the results of operations based on the information presented in the accompanying Consolidated Statements of Income is not meaningful since the information presented for 2001 and 2000 includes results of operations for dealerships disposed in those years that were not in existence in 2002. Therefore, in order to provide a more meaningful comparison, the tables included within the discussion below disaggregate the impact of the dealerships disposed in prior years in order to arrive at a comparison of only the results of operations of “ongoing” operations.
Annual “same store” results of operations represent the aggregate of the same store results for each quarter. Same store results for each quarter include dealerships that were owned and operated for the entire quarter in both periods.
18
Revenues
| For the Year Ended |
$ Change |
% Change |
For the Year Ended |
$ Change |
% Change |
|||||||||||||||||||
| 12/31/2002 |
12/31/2001 |
12/31/2001 |
12/31/2000 |
|||||||||||||||||||||
| Total Revenues (in thousands) |
||||||||||||||||||||||||
| Same Store |
$ |
5,454,243 |
$ |
5,636,898 |
(182,655 |
) |
(3.2 |
%) |
$ |
4,944,395 |
$ |
5,181,438 |
(237,043 |
) |
(4.6 |
%) | ||||||||
| Acquisitions |
|
1,616,772 |
|
158,011 |
1,458,761 |
|
923.2 |
% |
|
850,514 |
|
79,514 |
771,000 |
|
969.6 |
% | ||||||||
| Total Ongoing Dealerships |
|
7,071,015 |
|
5,794,909 |
1,276,106 |
|
22.0 |
% |
|
5,794,909 |
|
5,260,952 |
533,957 |
|
10.1 |
% | ||||||||
| Disposed prior to 2002 |
|
— |
|
85,000 |
|
85,000 |
|
183,349 |
||||||||||||||||
| Total As Reported |
$ |
7,071,015 |
$ |
5,879,909 |
1,191,106 |
|
20.3 |
% |
$ |
5,879,909 |
$ |
5,444,301 |
435,608 |
|
8.0 |
% | ||||||||
Revenues from ongoing dealerships increased in 2002 as a result of acquired dealerships, while same store revenues declined compared to 2001, which was the second best year in history for sales of light vehicles in the United States. The primary factor causing this decline was reduced consumer spending resulting from a downturn in economic conditions (as described in more detail below). Reduced consumer spending may continue to affect future revenues as economic conditions remain uncertain. In addition, uncertainty associated with potential U.S. military action in the Middle East may also affect future revenues.
Revenues from ongoing dealerships increased in 2001 as a result of acquired dealerships, while same store revenues declined compared to 2000, driven by lower vehicle revenues primarily in our Northern California and Carolina regions.
New Vehicles
| For the Year Ended |
Units or $ Change |
% Change |
For the Year Ended |
Units or $ Change |
% Change |
|||||||||||||||||||
| 12/31/2002 |
12/31/2001 |
12/31/2001 |
12/31/2000 |
|||||||||||||||||||||
| Total New Vehicle Units |
||||||||||||||||||||||||
| Same Store |
|
121,987 |
|
127,871 |
(5,884 |
) |
(4.6 |
%) |
|
109,652 |
|
119,829 |
(10,177 |
) |
(8.5 |
%) | ||||||||
| Acquisitions |
|
31,007 |
|
2,964 |
28,043 |
|
946.1 |
% |
|
21,183 |
|
996 |
20,187 |
|
2026.8 |
% | ||||||||
| Total Ongoing Dealerships |
|
152,994 |
|
130,835 |
22,159 |
|
16.9 |
% |
|
130,835 |
|
120,825 |
10,010 |
|
8.3 |
% | ||||||||
| Disposed prior to 2002 |
|
— |
|
1,902 |
|
1,902 |
|
3,447 |
||||||||||||||||
| Total As Reported |
|
152,994 |
|
132,737 |
20,257 |
|
15.3 |
% |
|
132,737 |
|
124,272 |
8,465 |
|
6.8 |
% | ||||||||
| Total New Vehicle Revenues (in thousands) |
||||||||||||||||||||||||
| Same Store |
$ |
3,332,242 |
$ |
3,406,190 |
(73,948 |
) |
(2.2 |
%) |
$ |
2,956,141 |
$ |
3,103,261 |
(147,120 |
) |
(4.7 |
%) | ||||||||
| Acquisitions |
|
941,654 |
|
76,970 |
864,684 |
|
1123.4 |
% |
|
527,019 |
|
26,695 |
500,324 |
|
1874.2 |
% | ||||||||
| Total Ongoing Dealerships |
|
4,273,896 |
|
3,483,160 |
790,736 |
|
22.7 |
% |
|
3,483,160 |
|
3,129,956 |
353,204 |
|
11.3 |
% | ||||||||
| Disposed prior to 2002 |
|
— |
|
43,680 |
(43,680 |
) |
(100.0 |
%) |
|
43,680 |
|
92,359 |
(48,679 |
) |
(52.7 |
%) | ||||||||
| Total As Reported |
$ |
4,273,896 |
$ |
3,526,840 |
747,056 |
|
21.2 |
% |
$ |
3,526,840 |
$ |
3,222,315 |
304,525 |
|
9.5 |
% | ||||||||
| Total New Vehicle Unit Price |
||||||||||||||||||||||||
| Same Store |
$ |
27,316 |
$ |
26,638 |
678 |
|
2.5 |
% |
$ |
26,959 |
$ |
25,897 |
1,062 |
|
4.1 |
% | ||||||||
| Total Ongoing Dealerships |
$ |
27,935 |
$ |
26,623 |
1,313 |
|
4.9 |
% |
$ |
26,623 |
$ |
25,905 |
718 |
|
2.8 |
% | ||||||||
The decline in same store unit sales during the year ended December 31, 2002 was consistent with an industry-wide decline in new vehicle sales. This decline was particularly evident in domestic brands, which are generally more sensitive to economic conditions than import and luxury brands. Sales of domestic non-luxury brands declined approximately 6.9% for the year ended December 31, 2002 and accounted for approximately 66.2% of the total decline in same store unit sales. Regional performance continued to be negatively affected by weaker economic conditions in our Northern California region, evidenced by significantly higher unemployment rates compared to the rest of the country. Same store unit sales in that region declined by 3,712 units, or 12.5%. Similar economic conditions in the Dallas market resulted in same store unit sales declines of 2,309 units or 16.2%. Our Ohio and Carolinas regions experienced same store declines of 21.2% and 3.0% respectively, due
19
primarily to a predominance of domestic brand stores in those markets. These decreases were partially offset by increases in unit sales in regions whose portfolios are dominated by import and luxury brands, primarily San Diego/Nevada, where units sales increased 1,048 units, or 15.2%, and South Carolina/Georgia, where units sales increased 710 units, or 11.9%, compared to the same period last year. We expect declines in same store new vehicle sales to continue during 2003.
In 2001, the decline in same store unit sales was primarily isolated to domestic brands. Sales of domestic brands on a same store basis declined by 8,073 units, or 15.8%, and accounted for 79.3% of the total decline in same store unit sales. As such, our regions dominated by domestic brands, such as Northern California and Carolinas, were particularly affected. Same store unit sales declined by 4,569 units or, 13.6%, and by 2,618 units, or 19.7%, in those two regions respectively, compared to 2000. Sales of import brands on a same store basis declined by only 2,104 units, or 3.1%, in 2001.
Used Vehicles
| For the Year Ended |
Units or $ Change |
% Change |
For the Year Ended |
Units or $ Change |
% Change |
|||||||||||||||||||
| 12/31/2002 |
12/31/2001 |
12/31/2001 |
12/31/2000 |
|||||||||||||||||||||
| Total Used Vehicle Units |
||||||||||||||||||||||||
| Same Store |
|
60,497 |
|
69,752 |
(9,255 |
) |
(13.3 |
%) |
|
61,296 |
|
66,820 |
(5,524 |
) |
(8.3 |
%) | ||||||||
| Acquisitions |
|
17,406 |
|
2,348 |
15,058 |
|
641.3 |
% |
|
10,804 |
|
1,457 |
9,347 |
|
641.5 |
% | ||||||||
| Total Ongoing Dealerships |
|
77,903 |
|
72,100 |
5,803 |
|
8.0 |
% |
|
72,100 |
|
68,277 |
3,823 |
|
5.6 |
% | ||||||||
| Disposed prior to 2002 |
|
— |
|
1,366 |
|
1,366 |
|
3,022 |
||||||||||||||||
| Total As Reported |
|
77,903 |
|
73,466 |
4,437 |
|
6.0 |
% |
|
73,466 |
|
71,299 |
2,167 |
|
3.0 |
% | ||||||||
| Total Used Vehicle Revenues (in thousands) |
||||||||||||||||||||||||
| Same Store |
$ |
918,550 |
$ |
1,022,018 |
(103,468 |
) |
(10.1 |
%) |
$ |
908,917 |
$ |
996,597 |
(87,680 |
) |
(8.8 |
%) | ||||||||
| Acquisitions |
|
295,784 |
|
32,160 |
263,624 |
|
819.7 |
% |
|
145,261 |
|
19,739 |
125,522 |
|
635.9 |
% | ||||||||
| Total Ongoing Dealerships |
|
1,214,334 |
|
1,054,178 |
160,156 |
|
15.2 |
% |
|
1,054,178 |
|
1,016,336 |
37,842 |
|
3.7 |
% | ||||||||
| Disposed prior to 2002 |
|
— |
|
18,679 |
(18,679 |
) |
(100.0 |
%) |
|
18,679 |
|
42,764 |
(24,085 |
) |
(56.3 |
%) | ||||||||
| Total As Reported |
$ |
1,214,334 |
$ |
1,072,857 |
141,477 |
|
13.2 |
% |
$ |
1,072,857 |
$ |
1,059,100 |
13,757 |
|
1.3 |
% | ||||||||
| Total Used Vehicle Unit Price |
||||||||||||||||||||||||
| Same Store |
$ |
15,183 |
$ |
14,652 |
531 |
|
3.6 |
% |
$ |
14,828 |
$ |
14,915 |
(87 |
) |
(0.6 |
%) | ||||||||
| Total Ongoing Dealerships |
$ |
15,588 |
$ |
14,621 |
967 |
|
6.6 |
% |
$ |
14,621 |
$ |
14,885 |
(264 |
) |
(1.8 |
%) | ||||||||
During 2002, used vehicle unit sales were negatively affected by a lack of adequate consumer credit availability. This was caused by many of the manufacturers’ captive finance companies focusing their financing of new vehicle sales and, to a lesser extent, used vehicle sales only at those dealerships selling their brands and tightening of credit standards by other finance companies. These factors have adversely affected consumers’ ability to finance used vehicle purchases, which reduces retail activity. Also contributing to the decline in used vehicle sales were competitive pressures from strong manufacturer incentives and interest rate subsidies on new vehicles. Our Oklahoma region, which has historically been heavily dependent on used vehicle sales, especially the sub-prime market, was particularly affected by these trends. Same store unit sales declined 1,737 units, or 21.7%. Unit sales in our Southeast division declined 3,640 units, or 16.2%. These regions accounted for 58.1% of the total decline in same store unit sales for 2002.
During 2001, 73.5% of the decline in same store unit sales was the Southeast Division, primarily the Carolinas region which declined 1,359 units, or 17.7%, the South Carolina/Georgia region which declined 1,264 units, or 21.8%, and the Birmingham/Tennessee region which declined 735 units, or 15.8%, compared to 2000.
20
Wholesale Vehicles
| For the Year Ended |
Units or $ Change |
% Change |
For the Year Ended |
Units or $ |
% Change |
|||||||||||||||||||
| 12/31/2002 |
12/31/2001 |
12/31/2001 |
12/31/2000 |
|||||||||||||||||||||
| Total Wholesale Vehicle Units |
||||||||||||||||||||||||
| Same Store |
|
51,540 |
|
56,052 |
(4,512 |
) |
(8.0 |
%) |
|
49,237 |
|
52,534 |
(3,297 |
) |
(6.3 |
%) | ||||||||
| Acquisitions |
|
14,465 |
|
2,185 |
12,280 |
|
562.0 |
% |
|
9,000 |
|
4,084 |
4,916 |
|
120.4 |
% | ||||||||
| Total Ongoing Dealerships |
|
66,005 |
|
58,237 |
7,768 |
|
13.3 |
% |
|
58,237 |
|
56,618 |
1,619 |
|
2.9 |
% | ||||||||
| Disposed prior to 2002 |
|
— |
|
1,663 |
|
1,663 |
|
3,381 |
||||||||||||||||
| Total As Reported |
|
66,005 |
|
59,900 |
6,105 |
|
10.2 |
% |
|
59,900 |
|
59,999 |
(99 |
) |
(0.2 |
%) | ||||||||
| Total Wholesale Vehicle Revenues (in thousands) |
||||||||||||||||||||||||
| Same Store |
$ |
342,061 |
$ |
348,403 |
(6,342 |
) |
(1.8 |
%) |
$ |
310,164 |
$ |
348,131 |
(37,967 |
) |
(10.9 |
%) | ||||||||
| Acquisitions |
|
130,110 |
|
25,400 |
104,710 |
|
412.2 |
% |
|
63,639 |
|
17,893 |
45,746 |
|
255.7 |
% | ||||||||
| Total Ongoing Dealerships |
|
472,171 |
|
373,803 |
98,368 |
|
26.3 |
% |
|
373,803 |
|
366,024 |
7,779 |
|
2.1 |
% | ||||||||
| Disposed prior to 2002 |
|
— |
|
9,251 |
(9,251 |
) |
(100.0 |
%) |
|
9,251 |
|
17,638 |
(8,387 |
) |
(47.6 |
%) | ||||||||
| Total As Reported |
$ |
472,171 |
$ |
383,054 |
89,117 |
|
23.3 |
% |
$ |
383,054 |
$ |
383,662 |
(608 |
) |
(0.2 |
%) | ||||||||
| Total Wholesale Unit Price |
||||||||||||||||||||||||
| Same Store |
$ |
6,637 |
$ |
6,216 |
421 |
|
6.8 |
% |
$ |
6,299 |
$ |
6,627 |
(328 |
) |
(4.9 |
%) | ||||||||
| Total Ongoing Dealerships |
$ |
7,154 |
$ |
6,419 |
735 |
|
11.4 |
% |
$ |
6,419 |
$ |
6,465 |
(46 |
) |
(0.7 |
%) | ||||||||
During 2002, the decrease in same store wholesale vehicle revenues is due to a decrease in units sold, offset by an increase in average price per unit, primarily resulting from wholesaling higher end models in order to liquidate aged units and maintain appropriate inventory levels.
During 2001, the majority of the decline in same store sales resulted from a decline in units sold, coupled with a lower selling price caused by the declines in values of used units at the wholesale level, especially in the fourth quarter.
Fixed Operations
| For the Year Ended |
$ Change |
% Change |
For the Year Ended |
$ Change |
% Change |
|||||||||||||||||||
| 12/31/2002 |
12/31/2001 |
12/31/2001 |
12/31/2000 |
|||||||||||||||||||||
| Total Parts, Service and Collision Repair (in thousands) |
||||||||||||||||||||||||
| Same Store |
$ |
701,659 |
$ |
693,939 |
7,720 |
|
1.1 |
% |
$ |
620,012 |
$ |
590,951 |
29,061 |
|
4.9 |
% | ||||||||
| Acquisitions |
|
207,103 |
|
15,559 |
191,544 |
|
1231.1 |
% |
|
89,486 |
|
10,980 |
78,506 |
|
715.0 |
% | ||||||||
| Total Ongoing Dealerships |
|
908,762 |
|
709,498 |
199,264 |
|
28.1 |
% |
|
709,498 |
|
601,931 |
107,567 |
|
17.9 |
% | ||||||||
| Disposed prior to 2002 |
|
— |
|
11,737 |
(11,737 |
) |
(100.0 |
%) |
|
11,737 |
|
26,928 |
(15,191 |
) |
(56.4 |
%) | ||||||||
| Total As Reported |
$ |
908,762 |
$ |
721,235 |
187,527 |
|
26.0 |
% |
$ |
721,235 |
$ |
628,859 |
92,376 |
|
14.7 |
% | ||||||||
Same store parts, service and collision repair revenues increased during 2002, resulting primarily from increases in warranty sales arising in part from BMW expanding their warranty to cover all new vehicle maintenance and Honda extending its warranty on two models due to problems with its V6 engines. In addition, we continued implementation of our best practices and investments in real estate and construction projects on collision facilities, which allowed us to increase our overall service and parts capacity. These increases were partially offset by significant declines in our Ford stores of $9.8 million, or 8.3%, resulting from unusually high parts and service sales generated in 2001 by the Firestone tire recall and other recalls. In addition, collision revenues were adversely affected by rising insurance premiums that have caused consumers to obtain higher deductible policies. Lower collision revenues in 2002 are a result of customers choosing not to perform minor repair work that historically would have been covered by lower deductible policies, as well as a change in insurance company trends whereby vehicles are being declared totaled rather than repaired at a greater percentage than in prior years.
21
Same store revenues increased during 2001, resulting in part from investments in real estate and construction projects on collision facilities, which allowed us to increase our overall service and parts capacity, as well as an increase at our Ford stores of $3.9 million or 5.0%, resulting in part from unusually high parts and service sales generated in 2001 by the Firestone tire recall and other recalls.
Finance and Insurance
| For the Year Ended |
$ Change |
% Change |
For the Year Ended |
$ Change |
% Change |
|||||||||||||||||||
| 12/31/2002 |
12/31/2001 |
12/31/2001 |
12/31/2000 |
|||||||||||||||||||||
| Total Finance & Insurance Revenue (in thousands) |
||||||||||||||||||||||||
| Same Store |
$ |
159,732 |
$ |
166,349 |
(6,617 |
) |
(4.0 |
%) |
$ |
149,161 |
$ |
142,498 |
6,663 |
|
4.7 |
% | ||||||||
| Acquisitions |
|
42,120 |
|
7,921 |
34,199 |
|
431.8 |
% |
|
25,109 |
|
4,206 |
20,903 |
|
497.0 |
% | ||||||||
| Total Ongoing Dealerships |
|
201,852 |
|
174,270 |
27,582 |
|
15.8 |
% |
|
174,270 |
|
146,704 |
27,566 |
|
18.8 |
% | ||||||||
| Disposed prior to 2002 |
|
— |
|
1,653 |
(1,653 |
) |
(100.0 |
%) |
|
1,653 |
|
3,661 |
(2,008 |
) |
(54.8 |
%) | ||||||||
| Total As Reported |
$ |
201,852 |
$ |
175,923 |
25,929 |
|
14.7 |
% |
$ |
175,923 |
$ |
150,365 |
25,558 |
|
17.0 |
% | ||||||||
| Total F&I per Unit |
||||||||||||||||||||||||
| Same Store |
$ |
875 |
$ |
842 |
33 |
|
3.9 |
% |
$ |
873 |
$ |
763 |
110 |
|
14.4 |
% | ||||||||
| Total Ongoing Dealerships |
$ |
874 |
$ |
859 |
15 |
|
1.8 |
% |
$ |
859 |
$ |
776 |
83 |
|
10.7 |
% | ||||||||
Same store finance and insurance revenues decreased during 2002 primarily due to lower retail vehicle unit sales. Unit sales were negatively impacted by the decline in retail vehicle unit sales in our Northern California market, and in our Ohio, Carolinas and Dallas regions. Finance and insurance revenues in these markets declined $3.1 million or 7.9%, $1.8 million or 17.1%, $1.7 million or 11.4% and $1.4 million or 8.1%, respectively, compared to 2001. These declines were offset by strong performance in our San Diego/Nevada region, driven by a higher import and luxury brand mix, where revenues increased $2.3 million or 23.2% compared to 2001.
During 2001, the increase in same store finance and insurance revenues was primarily due to an increase in per unit revenue, which reflected our continued focus on training programs for finance and insurance sales people along with our ability to negotiate higher commissions on the origination of customer vehicle financing, insurance polices and extended warranty contracts.
Gross Profit and Gross Margins
| For the Year Ended |
$ Change |
% Change |
For the Year Ended |
$ Change |
% Change |
|||||||||||||||||||
| 12/31/2002 |
12/31/2001 |
12/31/2001 |
12/31/2000 |
|||||||||||||||||||||
| Total Gross Profit (in thousands) |
||||||||||||||||||||||||
| Same Store |
$ |
849,218 |
$ |
867,480 |
(18,262 |
) |
(2.1 |
%) |
$ |
773,710 |
$ |
771,976 |
1,734 |
|
0.2 |
% | ||||||||
| Acquisitions |
|
241,712 |
|
26,676 |
215,036 |
|
806.1 |
% |
|
120,446 |
|
18,028 |
102,418 |
|
568.1 |
% | ||||||||
| Total Ongoing Dealerships |
|
1,090,930 |
|
894,156 |
196,774 |
|
22.0 |
% |
|
894,156 |
|
790,004 |
104,152 |
|
13.2 |
% | ||||||||
| Disposed prior to 2002 |
|
— |
|
10,504 |
(10,504 |
) |
(100.0 |
%) |
|
10,504 |
|
26,585 |
(16,081 |
) |
(60.5 |
%) | ||||||||
| Total As Reported |
$ |
1,090,930 |
$ |
904,660 |
186,270 |
|
20.6 |
% |
$ |
904,660 |
$ |
816,589 |
88,071 |
|
10.8 |
% | ||||||||
Our overall gross profit and gross profit as a percentage of revenues (“gross margins”) generally vary depending on changes in our revenue mix. Although sales of new vehicles comprise the majority of our total revenues, new vehicles generally carry the lowest margin of any product or service we offer, generally averaging between 7.5% and 8.5%. As a result, sales of new vehicles comprise a relatively small portion of total gross profits. Retail sales of used vehicles generally carry a slightly higher gross margin than new vehicles, averaging between 11% and 11.5%. Parts, service, and collision repair carry the next highest margins, averaging between 45% and 47%. Commission revenues from the sale of finance, insurance and extended warranty products carry the highest margin at 100%. As a result, as our mix of revenues shifts between lower margin products and services to higher margin products and services, overall gross margins fluctuate accordingly.
22
During 2002, gross margins from ongoing dealerships remained stable at 15.4%. We experienced an increase during 2002 in the percentage of revenues contributed by parts, service and collision repair services. In addition, the gross profit percentage earned on our parts, service, and collision repair services increased to 47.5% in 2002 from 46.0% in 2001. This was offset by a slight decrease in the percentage of revenues contributed by our finance and insurance products to 2.9% in 2002 from 3.0% in 2001, and an increase in the percentage of revenues contributed by new vehicle sales to 60.4% in 2002 from 60.1% in 2001.
Ongoing dealership gross margin during 2001 increased to 15.4% from 15.0% due primarily to an increase in the percentage of revenues contributed by parts, service, collision repair services and finance and insurance products. Parts, service and collision repair revenues as a percentage of total revenues increased to 12.2% in 2001 from 11.4% in 2000. Finance and insurance revenues as a percentage of total revenues increased to 3.0% in 2001 from 2.8% in 2000. In addition, the gross profit percentage earned on our parts, service, and collision repair and finance and insurance products increased to 56.7% in 2001 from 55.3% in 2000.
Selling, General & Administrative Expenses
| For the Year Ended |
$ Change |
% Change |
For the Year Ended |
$ Change |
% Change |
|||||||||||||||||||
| 12/31/2002 |
12/31/2001 |
12/31/2001 |
12/31/2000 |
|||||||||||||||||||||
| Total SG&A (in thousands) |
||||||||||||||||||||||||
| Same Store |
$ |
632,832 |
$ |
619,915 |
12,917 |
|
2.1 |
% |
$ |
555,805 |
$ |
538,342 |
17,463 |
|
3.2 |
% | ||||||||
| Acquisitions |
|
214,363 |
|
46,269 |
168,094 |
|
363.3 |
% |
|
110,379 |
|
29,871 |
80,508 |
|
269.5 |
% | ||||||||
| Total Ongoing Dealerships |
|
847,195 |
|
666,184 |
181,011 |
|
27.2 |
% |
|
666,184 |
|
568,213 |
97,971 |
|
17.2 |
% | ||||||||
| Disposed prior to 2002 |
|
— |
|
13,892 |
(13,892 |
) |
(100.0 |
%) |
|
13,892 |
|
26,718 |
(12,826 |
) |
(48.0 |
%) | ||||||||
| Total As Reported |
$ |
847,195 |
$ |
680,076 |
167,119 |
|
24.6 |
% |
$ |
680,076 |
$ |
594,931 |
85,145 |
|
14.3 |
% | ||||||||
Of our total selling, general and administrative expenses from ongoing dealerships in 2002, approximately 63.3% were variable, comprised primarily of non-salaried sales compensation and advertising, and approximately 36.7% were fixed, comprised primarily of fixed compensation and rent expense. We manage these variable expenses so that they are generally related to vehicle sales gross profit and can be adjusted in response to changes in vehicle sales gross profit. Salespersons, sales managers, service managers, parts managers, service advisors, service technicians and all other non-clerical dealership personnel are paid either a commission or a modest salary plus commissions. In addition, dealership management compensation is tied to individual dealership profitability.
As a percentage of gross profits, variable expenses from ongoing dealerships increased to 49.1% in 2002 from 47.6% in 2001. This was primarily due to increases in compensation expense as a percentage of gross profits to 39.3% in 2002, from 38.2% in 2001. This resulted primarily from higher sales incentives at our Massey dealerships acquired in March 2002, which are expected to more closely align with Sonic best practices as integration continues, as well as additional sales incentives designed to increase sales volume and achieve optimal inventory levels. Variable expenses from ongoing dealerships also increased due to an increase in advertising expense. As a percentage of gross profits, advertising expense increased to 5.7% in 2002 from 5.2% in 2001. This resulted from a determined effort, primarily in the first half of 2002, to stimulate consumer traffic into our dealerships through advertising. Our advertising expenditures began to stabilize in the second half of 2002.
Fixed expenses from ongoing dealerships increased as a percentage of gross profits to 28.5% in 2002 from 26.9% in 2001. This was primarily the result of significant investments in regional and divisional management personnel in advance of our recent acquisitions, including the Massey acquisition, in order to support our acquisition growth and integration plans, and was also impacted by a softer vehicle sales environment which led to reduced gross profit dollars, especially in the fourth quarter.
23
Of our total selling, general and administrative expenses in 2001, approximately 63.9% were variable, and approximately 36.1% were fixed. As a percentage of gross profits, variable expenses declined slightly in 2001 to 47.6% from 47.8% in 2000. These declines were offset by fixed expenses, which increased as a percentage of gross profits to 26.9% in 2001 from 24.2% in 2000, primarily as a result of increases in rent expense due to investments in dealership facilities and increases in medical insurance costs.
Depreciation and Amortization
| For the Year Ended |
$ Change |
% Change |
For the Year Ended |
$ Change |
% Change |
||||||||||||||||||
| 12/31/2002 |
12/31/2001 |
12/31/2001 |
12/31/2000 |
||||||||||||||||||||
| Total Depreciation (in thousands) |
|||||||||||||||||||||||
| Same Store |
$ |
6,016 |
$ |
5,813 |
203 |
|
3.5 |
% |
$ |
5,370 |
$ |
4,225 |
1,145 |
27.1 |
% | ||||||||
| Acquisitions |
|
2,512 |
|
785 |
1,728 |
|
220.1 |
% |
|
1,228 |
|
1,032 |
196 |
19.0 |
% | ||||||||
| Total Ongoing Dealerships |
|
8,528 |
|
6,598 |
1,931 |
|
29.3 |
% |
|
6,598 |
|
5,257 |
1,341 |
25.5 |
% | ||||||||
| Disposed prior to 2002 |
|
— |
|
181 |
(181 |
) |
(100.0 |
%) |
|
181 |
|
115 |
66 |
57.4 |
% | ||||||||
| Total As Reported |
$ |
8,528 |
$ |
6,779 |
1,750 |
|
25.8 |
% |
$ |
6,779 |
$ |
5,372 |
1,407 |
26.2 |
% | ||||||||
During 2002, the balance of gross property and equipment, excluding land and construction in process, increased $11.6 million, or 12.5%. Approximately $20.3 million of this increase resulted from additional capital expenditures and approximately $8.9 million from dealership acquisitions. These increases were offset by $17.6 million of disposals and other adjustments, including transfers to assets held for sale of $5.8 million. As a percentage of total revenues depreciation expense was 0.1% in both 2002 and 2001.
During 2001, the balance of gross property and equipment, excluding land and construction in process, increased approximately $17.6 million. Approximately $7.4 million of this increase resulted from dealership acquisitions and approximately $9.5 million from additional capital expenditures. As a percentage of total revenues, depreciation expense was at 0.1% in 2000 and 2001.
In accordance with SFAS 142, beginning January 1, 2002, goodwill is no longer amortized. Accordingly, no amortization expense was recorded during 2002. Amortization expense from ongoing operations in 2001 was $17.9 million an increase of 16.7% compared to 2000. The increase was primarily attributable to additional goodwill arising from acquisitions completed prior to July 1, 2001.
Floor Plan Interest Expense
| For the Year Ended |
$ Change |
% Change |
For the Year Ended |
$ Change |
% Change |
|||||||||||||||||||
| 12/31/2002 |
12/31/2001 |
12/31/2001 |
12/31/2000 |
|||||||||||||||||||||
| Interest Expense, floor plan (in thousands) |
||||||||||||||||||||||||
| Total Ongoing Dealerships |
$ |
24,524 |
$ |
31,799 |
(7,275 |
) |
(22.9 |
%) |
$ |
31,799 |
$ |
39,945 |
(8,146 |
) |
(20.4 |
%) | ||||||||
| Disposed prior to 2002 |
|
— |
|
701 |
|
701 |
|
1,976 |
||||||||||||||||
| Total As Reported |
$ |
24,524 |
$ |
32,500 |
(7,976 |
) |
(24.5 |
%) |
$ |
32,500 |
$ |
41,921 |
(9,421 |
) |
(22.5 |
%) | ||||||||
The average interest rate incurred by ongoing dealerships was 3.6% for the year ended December 31, 2002, compared to 5.8% for the year ended December 31, 2001, which reduced interest expense by approximately $12.2 million. This decrease was partially offset by an increase in floor plan balances during 2002. The average floor plan balance increased from $552.1 million at December 31, 2001 to $690.2 million at December 31, 2002, resulting in an increase in expense of approximately $4.9 million.
The average interest rate incurred by ongoing dealerships was 5.8% for the year ended December 31, 2001, compared to 8.1% for the year ended December 31, 2000, which reduced interest expense by approximately $11.4 million. This decrease was partially offset by an increase in floor plan balances during 2001. The average floor plan balance increased from $496.0 million at December 31, 2000 to $552.1 million at December 31, 2001, resulting in an increase in expense of approximately $3.2 million.
24
Our floor plan expenses are substantially offset by amounts received from manufacturers in the form of floor plan assistance. These payments are credited against our cost of sales. During the year ended December 31, 2002, the amounts we received from floor plan assistance exceeded our floor plan interest expense by approximately $15.0 million. Conversely, in the year ended December 31, 2001, floor plan interest expense exceeded amounts received for floor plan assistance by approximately $1.7 million.
Other Interest Expense
During 2002, other interest expense from ongoing operations increased $4.0 million, or 11.6%, compared to the same period last year. Interest expense increased $12.8 million as a result of the issuance of an additional $75.0 million in 11% senior subordinated notes in November 2001 and an additional $149.5 million in 5.25% convertible senior subordinated notes in May 2002, but was offset partially by a $10.6 million decrease in interest expense on our revolving credit facility. Of this decrease, approximately $7.8 million was due to a decrease in the average interest rate from 6.9% in 2001 to 4.6% in 2002, and approximately $2.8 million was due to a decrease in the average outstanding balance resulting from the refinancing of a portion of our revolving facility using proceeds from the issuance of convertible senior subordinated notes discussed above, offset partially by borrowings used to finance acquisition activities. The decrease in the weighted average interest rates and average balances was offset by the effective conversion of $200.0 million of our variable rate debt to a fixed rate through two separate $100.0 million interest rate swap agreements entered into on January 15, 2002 and June 6, 2002, whereby we receive interest payments based on LIBOR and make interest payments at fixed rates of 3.88% and 4.50%, respectively. The effect of the swaps resulted in an additional $3.6 million in interest expense in 2002. In addition, the increase in interest expense was partially offset by an increase in the capitalization of interest cost on construction projects of $1.1 million in 2002.
During 2001, other interest expense from ongoing operations decreased by $6.1 million, or 15.0%, compared to 2000. Of the total decrease, approximately $7.0 million was attributable to the decrease in the average interest rate incurred on our revolving credit facility to approximately 6.9% in 2001 from 9.0% in 2000. This decrease was partially offset by an increase in the average outstanding balance of the revolving credit facility to $341.9 million in 2001 from $331.8 million in 2000 due to additional borrowings for acquisitions.
Liquidity and Capital Resources
We require cash to finance acquisitions and fund debt service and working capital requirements. We rely on cash flows from operations, borrowings under our various credit facilities and offerings of debt and equity securities to meet these requirements. Although not required under the terms of any credit agreement, our practice has been to apply all of our available cash to reduce the outstanding balance on our revolving credit facility for the purpose of maximizing the return on these funds and minimizing interest expense.
Because the majority of our consolidated assets are held by our subsidiaries, the majority of our cash flow from operations is generated by these subsidiaries. As a result, our cash flow and ability to service debt depends to a substantial degree on the results of operations of these subsidiaries and their ability to provide us with cash. Uncertainties in the economic environment as well as uncertainties associated with potential U.S. military action in the Middle East may affect our overall liquidity.
Contracts in Transit:
Contracts in transit represent customer finance contracts evidencing loan agreements or lease agreements between Sonic, as creditor, and the customer, as borrower, to acquire or lease a vehicle where a third-party finance source has given Sonic initial, non-binding approval to assume Sonic’s position as creditor. Funding and final approval from the finance source is provided upon the finance source’s review of the loan or lease agreement and related documentation executed by the customer at the dealership. These finance contracts are typically funded within ten days of the initial approval of the finance transaction given by the third-party finance
25
source. The finance source is not contractually obligated to make the loan or lease to the customer until it gives its final approval and funds the transaction, and until such final approval is given, the contracts in transit represent amounts due from the customer to Sonic. Based on our experience, there is minimal risk of these contracts in transit not being approved and funded by the initial finance source. In rare instances where the pre-approving initial finance source does not give final approval of the loan or lease agreement, we are typically able to arrange for financing through another third-party finance source. Because contracts in transit are typically funded within ten days after the initial approval given by the finance source, we do not believe that they have any meaningful impact on our liquidity.
Floor Plan Facilities:
We finance all of our new and certain of our used vehicle inventory through standardized floor plan credit facilities with Chrysler Financial Company, LLC (“Chrysler Financial”), Ford Motor Credit Company (“Ford Credit”), General Motors Acceptance Corporation (“GMAC”), Toyota Motor Credit Corporation (“Toyota Credit”) and Bank of America, N.A. These floor plan facilities bear interest at variable rates based on prime and LIBOR. The weighted average interest rate for our floor plan facilities was 3.58% for 2002 and 5.83% for 2001. Interest payments under each of our floor plan facilities are due monthly, and we are generally not required to make principal repayments prior to the sale of the vehicles.
The balances outstanding are due when the related vehicles are sold and are collateralized by vehicle inventories and other assets, excluding franchise agreements, of the relevant dealership subsidiary. The floor plan facilities contain a number of covenants, including, among others, covenants restricting us with respect to the creation of liens and changes in ownership, officers and key management personnel. We were in compliance with all restrictive covenants as of December 31, 2002.
Long-Term Debt and Credit Facilities:
The Revolving Facility: At December 31, 2002 Sonic’s revolving credit facility with Ford Credit, Chrysler Financial and Toyota Credit (the “Revolving Facility”) had a borrowing limit of $600 million, subject to a borrowing base calculated on the basis of our receivables, inventory and equipment and a pledge of certain additional collateral by an affiliate of Sonic (the borrowing base was approximately $490.5 million at December 31, 2002). The amounts outstanding under the Revolving Facility bore interest during 2002 at 2.50 percentage points above LIBOR. The Revolving Facility includes an annual commitment fee equal to 0.25% of the unused portion of the facility. The total outstanding balance was approximately $330.7 million as of December 31, 2002. Balances under our Revolving Facility are guaranteed by Sonic’s operating subsidiaries.
On February 5, 2003 we amended certain terms of our Revolving Facility. We added Bank of America, N.A. to the lending group and extended the term of the facility from October 31, 2004 to October 31, 2006. In addition, the overall borrowing limit was reduced to $500 million and the interest rate was changed to LIBOR plus 2.55 percentage points. The reduction in the overall limit had no impact on our borrowing base and thus, no effect on our borrowing availability at December 31, 2002. All of the other substantive provisions, including covenants, remained the same. We were in compliance with all of the restrictive and financial covenants under the Revolving Facility at December 31, 2002.
Senior Subordinated Notes: Our outstanding senior subordinated notes mature on August 1, 2008 and bear interest at a fixed rate of 11.0%. The notes are unsecured and are redeemable at our option after August 1, 2003. Our obligations under these notes are guaranteed by our operating subsidiaries. Interest payments are due semi-annually on February 1 and August 1. The notes are subordinated to all of our present and future senior indebtedness, including borrowing under the Revolving Facility. Redemption prices during the 12-month periods beginning August 1 are 105.500% in 2003, 103.667% in 2004, 101.833% in 2005 and 100% thereafter.
26
During 2002, we repurchased $17.6 million in aggregate principal amount of the senior subordinated notes on the open market for approximately $18.2 million. A resulting loss of $1.1 million, net of write-offs of unamortized discounts and deferred debt issuance costs, is included in other income in the accompanying consolidated statement of income for the year ended December 31, 2002. The outstanding principal balance of the senior subordinated notes at December 31, 2002 was $182.4 million. We were in compliance with all of the restrictive covenants under the indentures governing the senior subordinated notes at December 31, 2002.
Convertible Senior Subordinated Notes: On May 7, 2002, we issued $149.5 million in aggregate principal amount of 5.25% convertible senior subordinated notes with net proceeds, before expenses, of approximately $145.1 million. The net proceeds were used to repay a portion of the amounts outstanding under our Revolving Facility. The notes are unsecured obligations that rank equal in right of payment to all of Sonic’s existing and future senior subordinated indebtedness, mature on May 7, 2009, and are redeemable at Sonic’s option after May 7, 2005. Sonic’s obligations under these notes are not guaranteed by any of its subsidiaries. We were in compliance with all of the restrictive covenants under the indenture governing the convertible senior subordinated notes at December 31, 2002.
The notes are convertible into shares of Class A common stock, at the option of the holder, if as of the last day of the preceding fiscal quarter, the closing sale price of our Class A common stock for at least 20 trading days in a period of 30 consecutive trading days ending on the last trading day of such preceding fiscal quarter is more than 110% of the conversion price per share of Class A common stock on the last day of such preceding fiscal quarter. If this condition is satisfied, then the notes will be convertible at any time, at the option of the holder, through maturity. The initial conversion price per share is $46.87, which is subject to adjustment for certain distributions on, or changes in our Class A common stock, if any, prior to the conversion date. In addition, on or before May 7, 2007, a holder also may convert his notes into shares of our Class A common stock at any time after a 10 consecutive trading day period in which the average of the trading day prices for the notes for that 10 trading day period is less than 103% of the average conversion value for the notes during that period. The conversion value is equal to the product of the closing sale price for our Class A common stock on a given day multiplied by the then current conversion rate, which is the number of shares of Class A common stock into which each $1,000 principal amount of notes is then convertible. These notes were not convertible as of December 31, 2002.
In 2002, we repurchased $19.4 million in aggregate principal amount of the convertible notes on the open market for approximately $14.5 million. A resulting gain of $4.3 million, net of write-offs of unamortized discounts and deferred debt issuance costs, is included in other income in the accompanying consolidated statement of income for the year ended December 31, 2002. The outstanding principal balance of the convertible notes at December 31, 2002 was $130.1 million.
The Mortgage Facility: Prior to December 31, 2002, we had a $50 million revolving construction line of credit with Ford Credit bearing interest at 2.25 percentage points above LIBOR. In addition, we had a $50 million real estate acquisition line of credit with Ford Credit bearing interest at 2.00 percentage points above LIBOR. On December 31, 2002, we replaced the Ford Credit facilities with a revolving real estate acquisition and construction line of credit (the “Construction Loan”) and a related mortgage refinancing facility (the “Permanent Loan” and collectively with the Construction Loan, the “Mortgage Facility”) with Toyota Credit. Under the Construction Loan, our dealership development subsidiaries can borrow up to $50.0 million to finance land acquisition and dealership construction costs. Advances can be made under the Construction Loan until November 2007. All advances will mature on December 31, 2007, bear interest at 2.25 percentage points above LIBOR and are secured by Sonic’s guarantee and a lien on all of the borrowing subsidiaries’ real estate and other assets.
Under the Permanent Loan, we can refinance up to $100.0 million in advances under the Construction Loan once the projects are completed and can finance real estate acquisition costs to the extent these costs were not previously financed under the Construction Loan. Advances can be made under the Permanent Loan until December 2007. All advances under the Permanent Loan mature on December 31, 2012, bear interest at 2.00% above LIBOR and are secured by the same collateral given under the Construction Loan.
27
The Mortgage Facility allows us to borrow up to $100 million in the aggregate under the Construction Loan and the Permanent Loan. The Mortgage Facility is not cross-collateralized with the Revolving Facility; however, a default under one will cause a default under the other.
We were in compliance with all of the restrictive and financial covenants under the Mortgage Facility at December 31, 2002.
Dealership acquisitions:
During 2002, we acquired 31 dealerships for a combined purchase price of $213.5 million in cash and 1,336,151 shares of Class A common stock valued at approximately $34.5 million. The total purchase price for the acquisitions was based on our internally determined valuation of the dealerships and their assets. The cash portion of the purchase price was financed by cash generated from our existing operations and by borrowings under our Revolving Facility.
Sale-Leaseback Transactions:
In an effort to generate additional capital, we typically seek to structure our operations to minimize the ownership of real property. As a result, facilities either constructed by us or obtained in acquisitions are typically sold to third parties in sale-leaseback transactions. The resulting leases generally have initial terms of 10-15 years and include a series of five-year renewal options. We have no continuing obligations under these arrangements other than lease payments. The majority of our sale-leaseback transactions are done with Capital Automotive REIT, which is not affiliated with Sonic. In 2002, we sold $26.4 million in dealership properties in sale-leaseback transactions. There were no material gains or losses on these sales.
Capital Expenditures:
Our capital expenditures include the construction of new dealerships and collision repair centers, building improvements and equipment purchased for use in our dealerships. Capital expenditures in 2002 were approximately $92.5 million, of which approximately $72.2 million related to the construction of new dealerships and collision repair centers and real estate acquired in connection with such construction. Once completed, these new dealerships and collision repair centers are generally sold in sale-leaseback transactions. After considering proceeds from real estate sales and sale-leaseback transactions, as well as the balance of projects in progress expected to be sold in sale leaseback transactions, capital expenditures were $18.2 million. We do not expect any significant gains or losses from these sales.
Stock Repurchase Program:
Our board of directors has authorized Sonic to expend up to $145.0 million to repurchase shares of our Class A common stock or redeem securities convertible into Class A common stock. During 2002, we repurchased 1,803,900 shares of Class A common stock totaling approximately $33.8 million. Subsequent to December 31, 2002, we have repurchased an additional 432,800 shares of our Class A common stock for approximately $6.7 million. As of March 11, 2002 we had $31.4 million remaining under the board authorization.
Cash Flows:
Cash provided by operating activities includes net income adjusted for the effects of non-cash items such as depreciation and amortization, and the effects of changes in working capital. During 2002, net cash provided by operating activities was approximately $138.9 million. Changes in inventory in 2002, net of notes payable floor plan, resulted primarily from an increase in inventory levels created by lower demand. Changes in other working capital balances, including accounts receivable, accounts payable and other accrued liabilities, are attributed to differences in timing of payments.
28
Cash used for investing activities in 2002 was approximately $235.0 million, the majority of which was related to dealership acquisitions. Our other principal investing activities include capital expenditures and dealership dispositions.
During 2002, net cash provided by financing activities was approximately $106.7 million and primarily related to $145.1 million of proceeds received from the issuance of 5.25% convertible senior subordinated notes offset by repurchases of Class A common stock and repayments on our revolving credit facilities.
Guarantees
In accordance with the terms of our real estate lease agreements, our dealership subsidiaries, acting as lessees, generally agree to indemnify the lessor from certain liabilities arising as a result of the use of the leased premises, including environmental liabilities and repairs to leased property upon termination of the lease. Sonic’s exposure with respect to these items is difficult to quantify. In addition, Sonic has generally agreed to indemnify the lessor in the event of a breach of the lease by the dealership subsidiary.
In accordance with the terms of agreements entered into for the sale of our dealership franchises, Sonic generally agrees to indemnify the buyer from certain liabilities and costs arising from operations or events that occur prior to the sale but which may or may not be known at the time of sale, including environmental liabilities, and liabilities resulting from the breach of representations or warranties made under the agreement. These indemnifications generally expire within a period of one to two years following the date of sale, and Sonic’s exposure is generally limited to dollar amounts ranging from $25,000 to $5.0 million as specified within the agreements.
In connection with dealership dispositions, certain of our dealership subsidiaries have assigned or sublet to the buyer their interests in real property leases associated with such dealerships. In general, the subsidiaries retain responsibility for the performance of certain obligations under such leases, including rent payments, environmental remediation, and repairs to leased property upon termination of the lease, to the extent that the assignee or sublessee does not perform. While Sonic’s exposure with respect to environmental remediation and repairs is difficult to quantify, the total estimated rent payments remaining under such leases as of December 31, 2002 was approximately $17.1 million based on lease expiration dates ranging from October 31, 2007 to July 15, 2015. However, in accordance with the terms of the assignment and sublease agreements, the assignees and sublessees have generally agreed to indemnify Sonic and its subsidiaries in the event of non-performance.
Future Liquidity Outlook:
Our obligations under our existing credit facilities, indentures and leasing programs are as follows:
| (Amounts in thousands) | |||||||||||||||||||||
| 2003 |
2004 |
2005 |
2006 |
2007 |
Thereafter |
Total | |||||||||||||||
| Floorplan Financing |
$ |
850,162 |
$ |
— |
$ |
— |
$ |
— |
$ |
— |
$ |
— |
$ |
850,162 | |||||||
| Long-Term Debt |
|
2,764 |
|
1,011 |
|
142 |
|
330,799 |
|
76 |
|
312,523 |
|
647,315 | |||||||
| Operating Leases |
|
77,005 |
|
73,326 |
|
69,858 |
|
65,520 |
|
62,619 |
|
357,387 |
|
705,715 | |||||||
We believe our best source of liquidity for future growth remains cash flows generated from operations combined with our availability of borrowings under our floor plan financing (or any replacements thereof) and other credit arrangements. Though uncertainties in the economic environment as well as uncertainties associated with potential U.S. military action in the Middle East may affect our ability to generate cash from operations, we expect to generate more than sufficient cash flow to fund our debt service and working capital requirements and any seasonal operating requirements, including our currently anticipated internal growth for our existing businesses, for the foreseeable future. Once these needs are met, we may use remaining cash flow to support our acquisition strategy or repurchase shares of our Class A common stock or publicly traded debt securities, as market conditions warrant.
29
Seasonality:
Our operations are subject to seasonal variations. The first and fourth quarters generally contribute less revenue and operating profits than the second and third quarters. Weather conditions, the timing of manufacturer incentive programs and model changeovers cause seasonality in new vehicle demand. Parts and service demand remains more stable throughout the year.
Item 7A: Quantitative and Qualitative Disclosures About Market Risk
Interest Rate Risk. Our variable rate floor plan notes payable, revolving credit facility borrowings and other variable rate notes expose us to risks caused by fluctuations in the applicable interest rates. The total outstanding balance of such variable instruments after considering the effect of our interest rate swaps (see below) was approximately $990.5 million at December 31, 2002 and approximately $911.3 million at December 31, 2001. A change of 100 basis points in the underlying interest rate would have caused a change in interest expense of approximately $8.9 million in 2002 and approximately $9.7 million in 2001. Of the total change in interest expense, approximately $6.6 million in 2002 and approximately $6.2 million in 2001 would have resulted from floor plan notes payable.
Our exposure with respect to floor plan notes payable is mitigated by floor plan assistance payments received from manufacturers that are generally based on rates similar to those incurred under our floor plan financing arrangements. These payments are credited against our cost of sales. During 2002, the amounts we received from manufacturer floor plan assistance exceeded our floor plan interest expense by approximately $15.0 million. A change in interest rates of 100 basis points would have had an estimated impact on floor plan assistance of approximately $6.2 million in 2002.
In addition to our variable rate debt, we also have lease agreements on a portion of our dealership facilities where the monthly lease payment fluctuates based on LIBOR interest rates. Many of our lease agreements have interest rate floors whereby our lease expense would not fluctuate significantly in periods when LIBOR is relatively low.
In order to reduce our exposure to market risks from fluctuations in interest rates, we entered into two separate interest rate swap agreements on January 15, 2002 and June 6, 2002 to effectively convert a portion of our LIBOR-based variable rate debt to a fixed rate. The swaps each have a notional principal amount of $100 million and mature on October 31, 2004 and June 6, 2006, respectively. Under the terms of the swap agreement entered into on January 15, 2002, we receive interest payments on the notional amount at a rate equal to the one month LIBOR rate, adjusted monthly, and make interest payments at a fixed rate of 3.88%. Under the terms of the swap agreement entered into on June 6, 2002, we receive interest payments on the notional amount at a rate equal to the one month LIBOR rate, adjusted monthly, and make interest payments at a fixed rate of 4.50%. Incremental interest expense incurred (the difference between interest received and interest paid) as a result of these interest rate swaps was $3.6 million in 2002 and has been included in interest expense, other in the accompanying consolidated statement of income. The interest rate swaps have been designated and qualify as cash flow hedges and, as a result, changes in the fair value of the interest rate swaps have been recorded in other comprehensive loss, net of related income taxes, in our statement of stockholders’ equity.
30
Future maturities of variable and fixed rate debt, and related interest rate swaps are as follows:
| 2003 |
2004 |
2005 |
2006 |
2007 |
Thereafter |
Total |
Fair Value |
|||||||||||||||||
| (Amounts in thousands) |
||||||||||||||||||||||||
| Liabilities |
||||||||||||||||||||||||
| Long-term Debt: |
||||||||||||||||||||||||
| Fixed Rate |
— |
|
— |
|
— |
|
— |
|
— |
|
312,460 |
|
312,460 |
|
290,040 |
| ||||||||
| Average Interest Rate |
— |
|
— |
|
— |
|
— |
|
— |
|
8.61 |
% |
8.61 |
% |
||||||||||
| Variable Rate |
2,764 |
|
1,011 |
|
142 |
|
330,798 |
|
76 |
|
64 |
|
334,855 |
|
334,855 |
| ||||||||
| Average Interest Rate |
7.39 |
% |
5.84 |
% |
7.76 |
% |
3.88 |
% |
9.69 |
% |
— |
|
3.92 |
% |
||||||||||
| Interest Rate Derivatives |
||||||||||||||||||||||||
| Interest Rate Swaps: |
||||||||||||||||||||||||
| Variable to Fixed |
— |
|
100,000 |
|
— |
|
100,000 |
|
— |
|
— |
|
200,000 |
|
(10,569 |
) | ||||||||
| Average pay rate |
— |
|
3.88 |
% |
— |
|
4.50 |
% |
— |
|
— |
|
4.19 |
% |
||||||||||
| Average receive rate |
— |
|
1Month Libor |
|
— |
|
1Month Libor |
|
— |
|
— |
|
1Month Libor |
|
||||||||||
Item 8. Financial Statements and Supplementary Data.
See “Consolidated Financial Statements and Notes” that appears on page F-1 herein.
Item 9. Changes in and Disagreements with Accountants on Accounting and Financial Disclosure.
None.
PART III
Item 10. Directors and Executive Officers of the Registrant.
Information required by this item with respect to compliance by Sonic’s directors, executive officers and certain beneficial owners of Sonic’s Common Stock with Section 16(a) of the Securities Exchange Act of 1934 is furnished by incorporation by reference to all information under the captions entitled “Election of Directors” and “General—Ownership of Voting Stock” in the Proxy Statement (to be filed hereafter) for Sonic’s Annual Meeting of the Stockholders to be held on April 22, 2003 (the “Proxy Statement”). The information required by this item with respect to Sonic’s executive officers appears in Part I of this Annual Report on Form 10-K under the caption “Executive Officers of the Registrant.”
Item 11. Executive Compensation.
The information required by this item is furnished by incorporation by reference to all information under the captions entitled “Executive Compensation” and “Election of Directors” in the Proxy Statement.
Item 12. Security Ownership of Certain Beneficial Owners and Management.
The information required by this item is furnished by incorporation by reference to all information under the caption “General — Ownership of Voting Stock” in the Proxy Statement.
Item 13. Certain Relationships and Related Transactions.
The information required by this item is furnished by incorporation by reference to all information under the caption “Certain Transactions” in the Proxy Statement.
31
Item 14. Controls and Procedures
Our management, under the supervision and with the participation of our principal executive officer and principal financial officer, evaluated the effectiveness of the design and operation of our disclosure controls and procedures within 90 days of the filing date of this Annual Report on Form 10-K. Based on this evaluation, our principal executive officer and principal financial officer have concluded that the design and operation of our disclosure controls and procedures are effective. There were no significant changes in our internal controls or in other factors that could significantly affect these controls subsequent to the date the evaluation was completed.
Item 15. Exhibits, Financial Statement Schedules, and Reports on Form 8-K.
The exhibits and other documents filed as a part of this Annual Report on Form 10-K, including those exhibits that are incorporated by reference herein, are:
(a) (1) Financial Statements: Consolidated Balance Sheets as of December 31, 2001 and 2002. Consolidated Statements of Income for the Years Ended December 31, 2000, 2001 and 2002. Consolidated Statements of Stockholders’ Equity for the Years Ended December 31, 2000, 2001 and 2002. Consolidated Statements of Cash Flows for the Years Ended December 31, 2000, 2001 and 2002.
(2) Financial Statement Schedules: No financial statement schedules are required to be filed as part of this Annual Report on Form 10-K.
(3) Exhibits: Exhibits required in connection with this Annual Report on Form 10-K are listed below. Certain of such exhibits, indicated by an asterisk, are hereby incorporated by reference to other documents on file with the SEC with which they are physically filed, to be a part hereof as of their respective dates.
| Exhibit No. |
Description | ||
| 1.1 |
* |
Purchase Agreement dated as of May 1, 2002 between Sonic and Merrill Lynch & Co., Merrill Lynch, Pierce, Fenner & Smith, Incorporated, Banc of America Securities LLC and First Union Securities, Inc. (incorporated by reference to Exhibit 1.1 to Sonic’s Amended Current Report on Form 8-K/A filed on May 6, 2002 (the “May 2002 Form 8-K/A”)). | |
| 2.1 |
* |
Asset Purchase Agreement dated as of January 11, 2002 by and among Sonic and the Donald E. Massey Revocable Trust (the “Trust”) (incorporated by reference to Exhibit 2.1 to Sonic’s Current Report on Form 8-K filed on April 15, 2002 (the “April 2002 Form 8-K”)).** | |
| 2.2 |
* |
Stock Purchase Agreement dated as of January 11, 2002 by and among Sonic and the Trust (incorporated by reference to Exhibit 2.2 to the April 2002 Form 8-K).** | |
| 2.3 |
* |
Stock Purchase Agreement dated as of January 11, 2002 by and among Sonic and the Trust (incorporated by reference to Exhibit 2.3 to the April 2002 Form 8-K).** | |
| 3.1 |
* |
Amended and Restated Certificate of Incorporation of Sonic (incorporated by reference to Exhibit 3.1 to Sonic’s Registration Statement on Form S-1 (Reg. No. 333-33295) (the “Form S-1”)). | |
| 3.2 |
* |
Certificate of Amendment to Sonic’s Amended and Restated Certificate of Incorporation effective June 18, 1999 (incorporated by reference to Exhibit 3.2 to Sonic’s Annual Report on Form 10-K for the year ended December 31, 1999 (the “1999 Form 10-K”)). | |
| 3.3 |
* |
Certificate of Designation, Preferences and Rights of Class A Convertible Preferred Stock (incorporated by reference to Exhibit 4.1 to Sonic’s Quarterly Report on Form 10-Q for the quarter ended March 31, 1998). | |
| 3.4 |
* |
Bylaws of Sonic (as amended December 14, 2001) (incorporated by reference to Exhibit 3.4 to Sonic’s Annual Report on Form 10-K for the year ended December 31, 2001 (the “2001 Form 10-K”)). |
32
| Exhibit No. |
Description | ||
| 4.1 |
* |
Specimen Certificate representing Class A Common Stock (incorporated by reference to Exhibit 4.1 to the Form S-1). | |
| 4.2 |
* |
Form of 11% Senior Subordinated Note due 2008, Series B (incorporated by reference to Exhibit 4.3 to Sonic’s Registration Statement on Form S-4 (Reg. Nos. 333-64397 and 333-64397-001 through 333-64397-044) (the “1998 Exchange Offer Form S-4”)). | |
| 4.3 |
* |
Indenture dated as of July 1, 1998 among Sonic, as issuer, the subsidiaries of Sonic named therein, as guarantors, and U.S. Bank Trust National Association, as trustee (the “Trustee”), relating to the 11% Senior Subordinated Notes due 2008, Series A and Series B (incorporated by reference to Exhibit 4.2 to the 1998 Exchange Offer Form S-4). | |
| 4.4 |
* |
Subordination Agreement dated as of July 31, 1998 between O. Bruton Smith and the Trustee, acting for the benefit of the holders of the Senior Subordinated Notes, Series A and Series B, and acknowledged by Sonic, regarding the Smith Subordinated Note (incorporated by reference to Exhibit 10.89 to the 1998 Exchange Offer Form S-4). | |
| 4.5 |
* |
First Supplemental Indenture dated as of December 31, 1999 among Sonic, as issuer, the subsidiaries of Sonic named therein, as guarantors and additional guarantors, and the Trustee, relating to the 11% Senior Subordinated Notes due 2008 (incorporated by reference to Exhibit 4.2a to the 1999 Form 10-K). | |
| 4.6 |
* |
Second Supplemental Indenture dated as of September 15, 2000 among Sonic, as issuer, the subsidiaries of Sonic named therein, as guarantors and additional guarantors, and the Trustee, relating to the 11% Senior Subordinated Notes due 2008 (incorporated by reference to Exhibit 4.4 to Sonic’s Quarterly Report on Form 10-Q for the quarter ended September 30, 2000 (the “September 30, 2000 Form 10-Q”)). | |
| 4.7 |
* |
Third Supplemental Indenture dated as of March 31, 2001 among Sonic, as issuer, the subsidiaries of Sonic named therein, as guarantors and additional guarantors, and the Trustee, relating to the 11% Senior Subordinated Notes due 2008 (incorporated by reference to Exhibit 4.6 to Sonic’s Quarterly Report on Form 10-Q for the quarter ended June 30, 2001 (the “June 30, 2001 Form 10-Q”)). | |
| 4.8 |
* |
Fourth Supplemental Indenture dated as of November 19, 2001 among Sonic, as issuer, the subsidiaries of Sonic named therein, as guarantors and additional guarantors, and the Trustee, relating to the 11% Senior Subordinated Notes due 2008 (incorporated by reference to Exhibit 4.7 to Sonic’s Registration Statement on Form S-4 (Reg. Nos. 333-75220 and 333-75220-01 through 333-75220-I2) (the “2001/2002 Exchange Offer Form S-4”)). | |
| 4.9 |
* |
Form of 11% Senior Subordinated Note due 2008, Series D (incorporated by reference to Exhibit 4.9 to the 2001/2002 Exchange Offer Form S-4). | |
| 4.10 |
* |
Indenture dated as of November 19, 2001 among Sonic, as issuer, the subsidiaries of Sonic named therein, as guarantors, and the Trustee, relating to the 11% Senior Subordinated Notes due 2008, Series C and Series D (incorporated by reference to Exhibit 4.9 to the 2001/2002 Exchange Offer Form S-4). | |
| 4.11 |
* |
Subordination Agreement dated as of November 19, 2001 between O. Bruton Smith and the Trustee, acting for the benefit of the holders of the Senior Subordinated Notes, Series C and Series D, and acknowledged by Sonic, regarding the Smith Subordinated Note (incorporated by reference to Exhibit 4.13 to the 2001/2002 Exchange Offer Form S-4). | |
| 4.12 |
* |
Registration Rights Agreement dated as of June 30, 1997 among Sonic, O. Bruton Smith, Bryan Scott Smith, William S. Egan and Sonic Financial Corporation (incorporated by reference to Exhibit 4.2 to the Form S-1). | |
| 4.13 |
* |
Form of 5.25% Convertible Senior Subordinated Note due 2009 (incorporated by reference to Exhibit 4.2 to the May 2002 Form 8-K/A). |
33
| Exhibit No. |
Description | ||
| 4.14 |
* |
Supplemental Indenture by and among Sonic and U.S. Bank National Association (incorporated by reference to Exhibit 4.1 to the May 2002 Form 8-K/A). | |
| 4.15 |
* |
Subordination Agreement dated as of May 7, 2002 between O. Bruton Smith and U.S. Bank National Association (incorporated by reference to Exhibit 4.3 to the May 2002 Form 8-K/A). | |
| 10.1 |
|
Second Amended and Restated Credit Agreement dated as of February 5, 2003 (the “Second Amended and Restated Credit Agreement”) between Sonic, as Borrower, Ford Motor Credit Company (“Ford Credit”), as Agent and Lender, DaimlerChrysler Services North America LLC (“Chrysler Financial”), as Lender, Toyota Motor Credit Corporation (“Toyota Credit”), as Lender, and Bank of America, N.A. (“Bank of America”), as Lender. | |
| 10.2 |
|
Second Amended and Restated Promissory Note dated February 5, 2003 executed by Sonic in favor of Ford Credit pursuant to the Second Amended and Restated Credit Agreement. | |
| 10.3 |
|
Second Amended and Restated Promissory Note dated February 5, 2003 executed by Sonic in favor of Chrysler Financial pursuant to the Second Amended and Restated Credit Agreement. | |
| 10.4 |
|
Amended and Restated Promissory Note dated February 5, 2003 executed by Sonic in favor of Toyota Credit pursuant to the Second Amended and Restated Credit Agreement. | |
| 10.5 |
|
Promissory Note dated February 5, 2003 executed by Sonic in favor of Bank of America pursuant to the Second Amended and Restated Credit Agreement. | |
| 10.6 |
* |
Guaranty dated June 20, 2001 by the subsidiaries of Sonic named therein, as Guarantors, in favor of Ford Credit, as Agent for the Lenders under the Credit Agreement dated as of June 20, 2001 between Sonic, as Borrower, Ford Credit, as Agent and Lender, Chrysler Financial Company, L.L.C., as Lender, and Toyota Credit, as Lender (incorporated by reference to Exhibit 10.5 to the June 30, 2001 Form 10-Q). | |
| 10.7 |
|
Reaffirmation of Guaranty dated as of February 5, 2003 by the subsidiaries of Sonic named therein, as Guarantors, in favor of Ford Credit, as Agent for the Lenders under the Second Amended and Restated Credit Agreement. | |
| 10.8 |
|
Second Amended and Restated Security Agreement dated as of February 5, 2003 by Sonic in favor of Ford Credit, as Agent for the Lenders under the Second Amended and Restated Credit Agreement. | |
| 10.9 |
|
Second Amended and Restated Security Agreement dated as of February 5, 2003 by the subsidiaries of Sonic named therein in favor of Ford Credit, as Agent for the Lenders under the Second Amended and Restated Credit Agreement. | |
| 10.10 |
|
Master Loan Agreement dated as of December 31, 2002 (the “Master Loan Agreement”) among Sonic, as Guarantor, the subsidiaries of Sonic listed therein, as Borrowers, and Toyota Credit, as Lender. | |
| 10.11 |
|
Promissory Note relating to Construction Loan dated December 31, 2002 by the subsidiaries of Sonic listed therein, as Borrowers, in favor of Toyota Credit, as Lender, pursuant to the Master Loan Agreement. | |
| 10.12 |
|
Promissory Note relating to Permanent Loan dated December 31, 2002 by the subsidiaries of Sonic listed therein, as Borrowers, in favor of Toyota Credit, as Lender, pursuant to the Master Loan Agreement. | |
| 10.13 |
|
Continuing and Irrevocable Guaranty dated as of December 31, 2002 by Sonic, as Guarantor, in favor of Toyota Credit, as Lender, regarding the obligations of certain subsidiaries of Sonic, as borrowers, under the Master Loan Agreement. | |
| 10.14 |
|
Sonic Automotive, Inc. 1997 Stock Option Plan, Amended and Restated as of May 8, 2002. (1) | |
| 10.15 |
|
Sonic Automotive, Inc. Employee Stock Purchase Plan, Amended and Restated as of May 8, 2002. (1) |
34
| Exhibit No. |
Description | ||
| 10.16 |
|
Sonic Automotive, Inc. Nonqualified Employee Stock Purchase Plan, Amended and Restated as of October 23, 2002. (1) | |
| 10.17 |
* |
Sonic Automotive, Inc. Formula Stock Option Plan for Independent Directors (incorporated by reference to Exhibit 10.69 to Sonic’s Amended Annual Report on Form 10-K/A for the year ended December 31, 1997) (the “1997 Form 10-K/A”)). (1) | |
| 10.18 |
* |
FirstAmerica Automotive, Inc. 1997 Stock Option Plan, Amended and Restated as of December 10, 1999 (incorporated by reference to Exhibit 4.1 to Sonic’s Registration Statement on Form S-8 (Reg. No. 333-95791)). | |
| 10.19 |
* |
Employment Agreement between Sonic and Theodore M. Wright (incorporated by reference to Exhibit 10.20 to the 2000 Form 10-K). (1) | |
| 10.20 |
* |
Employment Agreement between Sonic and Jeffrey C. Rachor (incorporated by reference to Exhibit 10.22 to the 2001 Form 10-K). (1) | |
| 10.21 |
* |
Tax Allocation Agreement dated as of June 30, 1997 between Sonic and Sonic Financial Corporation (incorporated by reference to Exhibit 10.33 to the Form S-1). | |
| 10.22 |
* |
Subordinated Promissory Note dated December 1, 1997 (the “Smith Subordinated Note”) in the amount of $5.5 million by Sonic, as borrower, in favor of O. Bruton Smith, as lender (incorporated by reference to Exhibit 10.72 to the 1997 Form 10-K/A). | |
| 21.1 |
|
Subsidiaries of Sonic. | |
| 23.1 |
|
Consent of Deloitte & Touche LLP. | |
| 99.1 |
|
Risk Factors. | |
| 99.2 |
|
Certification of Mr. Theodore M. Wright pursuant to 18 U.S.C. Section 1350, as adopted pursuant to Section 906 of the Sarbanes-Oxley Act of 2002. | |
| 99.3 |
|
Certification of Mr. O. Bruton Smith pursuant to 18 U.S.C. Section 1350, as adopted pursuant to Section 906 of the Sarbanes-Oxley Act of 2002. |
| * | Filed Previously |
| ** | Certain portions of this exhibit have been omitted pursuant to an order issued by the SEC granting confidential treatment to the information subject to that order. |
(1) Indicates a management contract or compensatory plan or arrangement.
(b) Reports on Form 8-K
On November 14, 2002, we filed a Current Report on Form 8-K with the SEC to announce pursuant to Item 5 of Form 8-K the promotion of certain members of our senior management. A copy of the press release issued in connection with this announcement was attached as an exhibit to the Current Report on Form 8-K.
On December 18, 2002, we filed a Current Report on Form 8-K with the SEC to furnish pursuant to Item 9 of Form 8-K revised earnings targets for the fourth quarter of 2002, the full year ended December 31, 2002 and the full year ended December 31, 2003. A copy of the press release announcing these revised earnings targets was attached as an exhibit to the Current Report on Form 8-K.
35
Pursuant to the requirements of Section 13 or 15(d) of the Securities Exchange Act of 1934, the registrant has duly caused this report to be signed on its behalf by the undersigned, thereunto duly authorized.
| SONIC AUTOMOTIVE, INC | ||
| By: |
/s/ THEODORE M. WRIGHT | |
| Theodore M. Wright President and Chief Financial Officer | ||
Date: March 18, 2003
Pursuant to the requirements of the Securities Exchange Act of 1934, this report has been signed below by the following persons on behalf of the registrant and in the capacities and on the dates indicated.
| Signature |
Title |
Date | ||
| /s/ O. BRUTON SMITH O. Bruton Smith |
Chief Executive Officer (principal executive officer) and Chairman |
March 18, 2003 | ||
| /s/ B. SCOTT SMITH B. Scott Smith |
Vice Chairman, Chief Strategic Officer and Director |
March 18, 2003 | ||
| /s/ THEODORE M. WRIGHT Theodore M. Wright |
President and Chief Financial Officer (principal accounting officer) and Director |
March 18, 2003 | ||
| /s/ JEFFREY C. RACHOR Jeffrey C. Rachor |
Executive Vice President and Chief Operating Officer and Director |
March 18, 2003 | ||
| /s/ WILLIAM R. BROOKS William R. Brooks |
Director |
March 18, 2003 | ||
| /s/ WILLIAM P. BENTON William P. Benton |
Director |
March 18, 2003 | ||
| /s/ WILLIAM I. BELK William I. Belk |
Director |
March 18, 2003 | ||
| /s/ H. ROBERT HELLER H. Robert Heller |
Director |
March 8, 2003 | ||
| /s/ MARYANN N. KELLER Maryann N. Keller |
Director |
March 18, 2003 | ||
| /s/ ROBERT L. REWEY Robert L. Rewey |
Director |
March 18, 2003 | ||
| /s/ THOMAS P. CAPO Thomas P. Capo |
Director |
March 18, 2003 |
36
I, O. Bruton Smith, certify that:
1 I have reviewed this annual report on Form 10-K of Sonic Automotive, Inc.;
2. Based on my knowledge, this annual report does not contain any untrue statement of a material fact or omit to state a material fact necessary to make the statements made, in light of the circumstances under which such statements were made, not misleading with respect to the period covered by this annual report;
3. Based on my knowledge, the financial statements, and other financial information included in this annual report, fairly present in all material respects the financial condition, results of operations and cash flows of the registrant as of, and for, the periods presented in this annual report;
4. The registrant’s other certifying officer and I are responsible for establishing and maintaining disclosure controls and procedures (as defined in Exchange Act Rules 13a-14 and 15d-14) for the registrant and we have:
| (a) | Designed such disclosure controls and procedures to ensure that material information relating to the registrant, including its consolidated subsidiaries, is made known to us by others within those entities, particularly during the period in which this annual report is being prepared; |
| (b) | Evaluated the effectiveness of the registrant’s disclosure controls and procedures as of a date within 90 days prior to the filing date of this annual report (the “Evaluation Date”); and |
| (c) | Presented in this annual report our conclusions about the effectiveness of the disclosure controls and procedures based on our evaluation as of the Evaluation Date; |
5. The registrant’s other certifying officer and I have disclosed, based on our most recent evaluation, to the registrant’s auditors and the audit committee of registrant’s board of directors (or persons performing the equivalent function):
| (a) | All significant deficiencies in the design or operation of internal controls which could adversely affect the registrant’s ability to record, process, summarize and report financial data and have identified for the registrant’s auditors any material weaknesses in internal controls; and |
| (b) | Any fraud, whether or not material, that involves management or other employees who have a significant role in the registrant’s internal controls; and |
6. The registrant’s other certifying officer and I have indicated in this annual report whether or not there were significant changes in internal controls or in other factors that could significantly affect internal controls subsequent to the date of our most recent evaluation, including any corrective actions with regard to significant deficiencies and material weaknesses.
Date: March 18, 2003
| By: |
/s/ O. Bruton Smith | |
| O. Bruton Smith Chairman and Chief Executive Officer |
37
CERTIFICATION
I, Theodore M. Wright, certify that:
1. I have reviewed this annual report on Form 10-K of Sonic Automotive, Inc.;
2. Based on my knowledge, this annual report does not contain any untrue statement of a material fact or omit to state a material fact necessary to make the statements made, in light of the circumstances under which such statements were made, not misleading with respect to the period covered by this annual report;
3. Based on my knowledge, the financial statements, and other financial information included in this annual report, fairly present in all material respects the financial condition, results of operations and cash flows of the registrant as of, and for, the periods presented in this annual report;
4. The registrant’s other certifying officer and I are responsible for establishing and maintaining disclosure controls and procedures (as defined in Exchange Act Rules 13a-14 and 15d-14) for the registrant and we have:
| (a) | Designed such disclosure controls and procedures to ensure that material information relating to the registrant, including its consolidated subsidiaries, is made known to us by others within those entities, particularly during the period in which this annual report is being prepared; |
| (b) | Evaluated the effectiveness of the registrant’s disclosure controls and procedures as of a date within 90 days prior to the filing date of this annual report (the “Evaluation Date”); and |
| (c) | Presented in this annual report our conclusions about the effectiveness of the disclosure controls and procedures based on our evaluation as of the Evaluation Date; |
5. The registrant’s other certifying officer and I have disclosed, based on our most recent evaluation, to the registrant’s auditors and the audit committee of registrant’s board of directors (or persons performing the equivalent function):
| (a) | All significant deficiencies in the design or operation of internal controls which could adversely affect the registrant’s ability to record, process, summarize and report financial data and have identified for the registrant’s auditors any material weaknesses in internal controls; and |
| (b) | Any fraud, whether or not material, that involves management or other employees who have a significant role in the registrant’s internal controls; and |
6. The registrant’s other certifying officer and I have indicated in this annual report whether or not there were significant changes in internal controls or in other factors that could significantly affect internal controls subsequent to the date of our most recent evaluation, including any corrective actions with regard to significant deficiencies and material weaknesses.
Date: March 18, 2003
| By: |
/s/ Theodore M. Wright | |
| Theodore M. Wright, President and Chief Financial Officer |
38
TO THE BOARD OF DIRECTORS AND STOCKHOLDERS OF
SONIC AUTOMOTIVE, INC.
Charlotte, North Carolina
We have audited the accompanying consolidated balance sheets of Sonic Automotive, Inc. and Subsidiaries (the “Company”) as of December 31, 2001 and 2002, and the related consolidated statements of income, stockholders’ equity, and cash flows for each of the three years in the period ended December 31, 2002. These financial statements are the responsibility of the Company’s management. Our responsibility is to express an opinion on these financial statements based on our audits.
We conducted our audits in accordance with auditing standards generally accepted in the United States of America. Those standards require that we plan and perform the audit to obtain reasonable assurance about whether the financial statements are free of material misstatement. An audit includes examining, on a test basis, evidence supporting the amounts and disclosures in the financial statements. An audit also includes assessing the accounting principles used and significant estimates made by management, as well as evaluating the overall financial statement presentation. We believe that our audits provide a reasonable basis for our opinion.
In our opinion, the consolidated financial statements referred to above present fairly, in all material respects, the financial position of the Company as of December 31, 2001 and 2002, and the results of its operations and its cash flows for each of the three years in the period ended December 31, 2002 in conformity with accounting principles generally accepted in the United States of America.
As discussed in Note 1 to the consolidated financial statements, effective January 1, 2002 the Company adopted the provisions of Statement of Financial Accounting Standards No. 142, Goodwill and Other Intangible Assets, and No. 144, Accounting for the Impairment or Disposal of Long-Lived Assets.
DELOITTE & TOUCHE LLP
Charlotte, North Carolina
February 24, 2003
F-1
SONIC AUTOMOTIVE, INC. AND SUBSIDIARIES
CONSOLIDATED BALANCE SHEETS
December 31, 2001 and 2002
(Dollars in thousands)
| December 31, |
||||||||
| 2001 |
2002 |
|||||||
| ASSETS |
||||||||
| Current Assets: |
||||||||
| Cash |
$ |
— |
|
$ |
10,576 |
| ||
| Receivables, net |
|
270,307 |
|
|
297,859 |
| ||
| Inventories |
|
661,305 |
|
|
929,450 |
| ||
| Other current assets |
|
29,127 |
|
|
63,742 |
| ||
| Total current assets |
|
960,739 |
|
|
1,301,627 |
| ||
| Property and Equipment, net |
|
98,972 |
|
|
121,936 |
| ||
| Goodwill, net |
|
727,503 |
|
|
875,894 |
| ||
| Other Intangible Assets, net |
|
10,600 |
|
|
61,800 |
| ||
| Other Assets |
|
12,555 |
|
|
14,051 |
| ||
| Total Assets |
$ |
1,810,369 |
|
$ |
2,375,308 |
| ||
| LIABILITIES AND STOCKHOLDERS' EQUITY |
||||||||
| Current Liabilities: |
||||||||
| Notes payable—floor plan |
$ |
587,914 |
|
$ |
850,162 |
| ||
| Trade accounts payable |
|
52,198 |
|
|
58,560 |
| ||
| Accrued interest |
|
9,676 |
|
|
13,306 |
| ||
| Other accrued liabilities |
|
89,322 |
|
|
113,592 |
| ||
| Current maturities of long-term debt |
|
2,586 |
|
|
2,764 |
| ||
| Total current liabilities |
|
741,696 |
|
|
1,038,384 |
| ||
| Long-Term Debt |
|
511,877 |
|
|
637,545 |
| ||
| Other Long-Term Liabilities |
|
5,836 |
|
|
16,085 |
| ||
| Payable to the Company’s Chairman |
|
5,500 |
|
|
5,500 |
| ||
| Deferred Income Taxes |
|
28,199 |
|
|
40,616 |
| ||
| Commitments and Contingencies |
||||||||
| Stockholders’ Equity: |
||||||||
| Class A Convertible Preferred Stock, none issued |
||||||||
| Class A Common Stock, 34,850,738 shares issued at December 31, 2001 and 37,245,706 shares issued at December 31, 2002 |
|
348 |
|
|
371 |
| ||
| Class B Common Stock, 12,029,375 shares at December 31, 2001 and December 31, 2002, issued and outstanding |
|
121 |
|
|
121 |
| ||
| Paid-in capital |
|
343,256 |
|
|
396,813 |
| ||
| Retained earnings |
|
232,893 |
|
|
339,457 |
| ||
| Accumulated other comprehensive loss |
|
— |
|
|
(6,447 |
) | ||
| Treasury Stock, at cost (6,330,264 shares held at December 31, 2001 and 8,134,164 at December 31, 2002) |
|
(59,357 |
) |
|
(93,137 |
) | ||
| Total stockholders’ equity |
|
517,261 |
|
|
637,178 |
| ||
| Total Liabilities and Stockholders’ Equity |
$ |
1,810,369 |
|
$ |
2,375,308 |
| ||
See notes to consolidated financial statements.
F-2
SONIC AUTOMOTIVE, INC. AND SUBSIDIARIES
CONSOLIDATED STATEMENTS OF INCOME
Years Ended December 31, 2000, 2001 and 2002
(Dollars and shares in thousands, except per share amounts)
| Year Ended December 31, |
||||||||||||
| 2000 |
2001 |
2002 |
||||||||||
| Revenues: |
||||||||||||
| New vehicles |
$ |
3,222,315 |
|
$ |
3,526,840 |
|
$ |
4,273,896 |
| |||
| Used vehicles |
|
1,059,100 |
|
|
1,072,857 |
|
|
1,214,334 |
| |||
| Wholesale vehicles |
|
383,662 |
|
|
383,054 |
|
|
472,171 |
| |||
| Total vehicles |
|
4,665,077 |
|
|
4,982,751 |
|
|
5,960,401 |
| |||
| Parts, service and collision repair |
|
628,859 |
|
|
721,235 |
|
|
908,762 |
| |||
| Finance & insurance and other |
|
150,365 |
|
|
175,923 |
|
|
201,852 |
| |||
| Total revenues |
|
5,444,301 |
|
|
5,879,909 |
|
|
7,071,015 |
| |||
| Cost of sales |
|
4,627,712 |
|
|
4,975,249 |
|
|
5,980,085 |
| |||
| Gross profit |
|
816,589 |
|
|
904,660 |
|
|
1,090,930 |
| |||
| Selling, general and administrative expenses |
|
594,931 |
|
|
680,076 |
|
|
847,195 |
| |||
| Depreciation |
|
5,372 |
|
|
6,779 |
|
|
8,528 |
| |||
| Goodwill amortization |
|
15,742 |
|
|
17,567 |
|
|
— |
| |||
| Operating income |
|
200,544 |
|
|
200,238 |
|
|
235,207 |
| |||
| Other income / (expense): |
||||||||||||
| Interest expense, floor plan |
|
(41,921 |
) |
|
(32,500 |
) |
|
(24,524 |
) | |||
| Interest expense, other |
|
(40,833 |
) |
|
(34,712 |
) |
|
(38,734 |
) | |||
| Other income, net |
|
103 |
|
|
137 |
|
|
3,381 |
| |||
| Total other expense |
|
(82,651 |
) |
|
(67,075 |
) |
|
(59,877 |
) | |||
| Income from continuing operations before taxes |
|
117,893 |
|
|
133,163 |
|
|
175,330 |
| |||
| Provision for income taxes |
|
45,013 |
|
|
51,676 |
|
|
66,821 |
| |||
| Net income from continuing operations |
|
72,880 |
|
|
81,487 |
|
|
108,509 |
| |||
| Discontinued operations: |
||||||||||||
| Income/(loss) from operations of discontinued dealerships |
|
1,979 |
|
|
(3,119 |
) |
|
(3,411 |
) | |||
| Income tax benefit (expense) |
|
(687 |
) |
|
961 |
|
|
1,466 |
| |||
| Net income/(loss) from discontinued operations |
|
1,292 |
|
|
(2,158 |
) |
|
(1,945 |
) | |||
| Net income |
$ |
74,172 |
|
$ |
79,329 |
|
$ |
106,564 |
| |||
| Basic net income (loss) per share: |
||||||||||||
| Net income per share from continuing operations |
$ |
1.71 |
|
$ |
2.01 |
|
$ |
2.60 |
| |||
| Net income/(loss) per share from discontinued operations |
|
0.03 |
|
|
(0.05 |
) |
|
(0.05 |
) | |||
| Net income per share |
$ |
1.74 |
|
$ |
1.96 |
|
$ |
2.55 |
| |||
| Weighted average common shares outstanding |
|
42,518 |
|
|
40,541 |
|
|
41,728 |
| |||
| Diluted net income (loss) per share: |
||||||||||||
| Net income per share from continuing operations |
$ |
1.66 |
|
$ |
1.96 |
|
$ |
2.51 |
| |||
| Net income/(loss) per share from discontinued operations |
|
0.03 |
|
|
(0.05 |
) |
|
(0.04 |
) | |||
| Net income per share |
$ |
1.69 |
|
$ |
1.91 |
|
$ |
2.47 |
| |||
| Weighted average common shares outstanding |
|
43,826 |
|
|
41,609 |
|
|
43,158 |
| |||
See notes to consolidated financial statements
F-3
SONIC AUTOMOTIVE, INC. AND SUBSIDIARIES
CONSOLIDATED STATEMENTS OF STOCKHOLDERS’ EQUITY
Years Ended December 31, 2000, 2001 and 2002
(Dollars and shares in thousands)
| Preferred Stock |
Class A Common Stock |
Class B Common Stock |
Paid-In Capital |
Retained Earnings |
Treasury Stock |
Accumulated Other Comprehensive Loss |
Total Stockholders’ Equity |
Compre hensive- Income |
||||||||||||||||||||||||||||||||||
| Shares |
Amount |
Shares |
Amount |
Shares |
Amount |
|||||||||||||||||||||||||||||||||||||
| BALANCE AT DECEMBER 31, 1999 |
28 |
|
$ |
27,191 |
|
29,075 |
$ |
291 |
12,250 |
|
$ |
123 |
|
$ |
301,934 |
|
$ |
79,392 |
$ |
(6,358 |
) |
$ |
— |
|
$ |
402,573 |
|
$ |
— |
| ||||||||||||
| Issuance of Preferred Stock |
11 |
|
|
11,589 |
|
— |
|
— |
— |
|
|
— |
|
|
— |
|
|
— |
|
— |
|
|
— |
|
|
11,589 |
|
|
— |
| ||||||||||||
| Issuance of Class A Common Stock |
— |
|
|
— |
|
809 |
|
8 |
— |
|
|
— |
|
|
(8 |
) |
|
— |
|
— |
|
|
— |
|
|
— |
|
|
— |
| ||||||||||||
| Shares awarded under stock compensation plans |
— |
|
|
— |
|
441 |
|
4 |
— |
|
|
— |
|
|
2,615 |
|
|
— |
|
— |
|
|
— |
|
|
2,619 |
|
|
— |
| ||||||||||||
| Conversion of Preferred Stock |
(26 |
) |
|
(25,947 |
) |
2,967 |
|
30 |
— |
|
|
— |
|
|
25,917 |
|
|
— |
|
— |
|
|
— |
|
|
— |
|
|
— |
| ||||||||||||
| Redemption of Preferred Stock |
(13 |
) |
|
(12,582 |
) |
— |
|
— |
— |
|
|
— |
|
|
(969 |
) |
|
— |
|
— |
|
|
— |
|
|
(13,551 |
) |
|
— |
| ||||||||||||
| Purchase of Treasury Stock |
— |
|
|
— |
|
— |
|
— |
— |
|
|
— |
|
|
— |
|
|
— |
|
(26,480 |
) |
|
— |
|
|
(26,480 |
) |
|
— |
| ||||||||||||
| Net income |
— |
|
|
— |
|
— |
|
— |
— |
|
|
— |
|
|
— |
|
|
74,172 |
|
— |
|
|
— |
|
|
74,172 |
|
|
74,172 |
| ||||||||||||
| BALANCE AT DECEMBER 31, 2000 |
— |
|
|
251 |
|
33,292 |
|
333 |
12,250 |
|
|
123 |
|
|
329,489 |
|
|
153,564 |
|
(32,838 |
) |
|
— |
|
|
450,922 |
|
|
74,172 |
| ||||||||||||
| Shares awarded under stock compensation plans |
— |
|
|
— |
|
1,257 |
|
12 |
— |
|
|
— |
|
|
9,970 |
|
|
— |
|
— |
|
|
— |
|
|
9,982 |
|
|
— |
| ||||||||||||
| Conversion of Class B Common Stock |
— |
|
|
— |
|
221 |
|
2 |
(221 |
) |
|
(2 |
) |
|
— |
|
|
— |
|
— |
|
|
— |
|
|
— |
|
|
— |
| ||||||||||||
| Redemption of Preferred Stock |
— |
|
|
(251 |
) |
— |
|
— |
— |
|
|
— |
|
|
— |
|
|
— |
|
— |
|
|
— |
|
|
(251 |
) |
|
— |
| ||||||||||||
| Exercise of Warrants |
— |
|
|
— |
|
81 |
|
1 |
— |
|
|
— |
|
|
(1 |
) |
|
— |
|
— |
|
|
— |
|
|
— |
|
|
— |
| ||||||||||||
| Purchase of Treasury Stock |
— |
|
|
— |
|
— |
|
— |
— |
|
|
— |
|
|
— |
|
|
— |
|
(26,519 |
) |
|
— |
|
|
(26,519 |
) |
|
— |
| ||||||||||||
| Income tax benefit associated with stock compensation plans |
— |
|
|
— |
|
— |
|
— |
— |
|
|
— |
|
|
3,798 |
|
|
— |
|
— |
|
|
— |
|
|
3,798 |
|
|
— |
| ||||||||||||
| Net Income |
— |
|
|
— |
|
— |
|
— |
— |
|
|
— |
|
|
— |
|
|
79,329 |
|
— |
|
|
— |
|
|
79,329 |
|
|
79,329 |
| ||||||||||||
| BALANCE AT DECEMBER 31, 2001 |
— |
|
|
— |
|
34,851 |
|
348 |
12,029 |
|
|
121 |
|
|
343,256 |
|
|
232,893 |
|
(59,357 |
) |
|
— |
|
|
517,261 |
|
|
79,329 |
| ||||||||||||
| Shares awarded under stock compensation plans |
— |
|
|
— |
|
1,059 |
|
10 |
— |
|
|
— |
|
|
12,246 |
|
|
— |
|
|
— |
|
|
12,256 |
|
|
— |
| ||||||||||||||
| Issuance of Class A Common Stock for Acquisitions |
— |
|
|
— |
|
1,336 |
|
13 |
— |
|
|
— |
|
|
34,496 |
|
|
— |
|
— |
|
|
— |
|
|
34,509 |
|
|
— |
| ||||||||||||
| Purchase of Treasury Stock |
— |
|
|
— |
|
— |
|
— |
— |
|
|
— |
|
|
— |
|
|
— |
|
(33,780 |
) |
|
— |
|
|
(33,780 |
) |
|
— |
| ||||||||||||
| Income tax benefit associated with stock compensation plans |
— |
|
|
— |
|
— |
|
— |
— |
|
|
— |
|
|
6,815 |
|
|
— |
|
— |
|
|
— |
|
|
6,815 |
|
|
— |
| ||||||||||||
| Fair value of interest rate swap agreement, net of tax benefit of $4,122 |
— |
|
|
— |
|
— |
|
— |
— |
|
|
— |
|
|
— |
|
|
— |
|
— |
|
|
(6,447 |
) |
|
(6,447 |
) |
|
(6,447 |
) | ||||||||||||
| Net income |
— |
|
|
— |
|
— |
|
— |
— |
|
|
— |
|
|
— |
|
|
106,564 |
|
— |
|
|
— |
|
|
106,564 |
|
|
106,564 |
| ||||||||||||
| BALANCE AT DECEMBER 31, 2002 |
— |
|
$ |
— |
|
37,246 |
$ |
371 |
12,029 |
|
$ |
121 |
|
$ |
396,813 |
|
$ |
339,457 |
$ |
(93,137 |
) |
$ |
(6,447 |
) |
$ |
637,178 |
|
$ |
100,117 |
| ||||||||||||
See notes to consolidated financial statements
F-4
SONIC AUTOMOTIVE, INC. AND SUBSIDIARIES
CONSOLIDATED STATEMENTS OF CASH FLOWS
Years ended December 31, 2000, 2001 and 2002
(Dollars in thousands)
| Years Ended December 31, |
||||||||||||
| 2000 |
2001 |
2002 |
||||||||||
| CASH FLOWS FROM OPERATING ACTIVITIES: |
||||||||||||
| Net income |
$ |
74,172 |
|
$ |
79,329 |
|
$ |
106,564 |
| |||
| Adjustments to reconcile net income to net cash provided by operating activities: |
||||||||||||
| Depreciation and amortization |
|
22,714 |
|
|
25,790 |
|
|
8,974 |
| |||
| Amortization of debt issue costs |
|
293 |
|
|
314 |
|
|
785 |
| |||
| Deferred income taxes |
|
12,384 |
|
|
11,788 |
|
|
15,048 |
| |||
| Equity interest in (earnings) losses of investees |
|
119 |
|
|
(264 |
) |
|
(354 |
) | |||
| (Gain)/Loss on disposal of assets |
|
317 |
|
|
(897 |
) |
|
(3,470 |
) | |||
| Gain on retirement of debt |
|
— |
|
|
— |
|
|
(3,144 |
) | |||
| Income tax benefit associated with stock compensation plans |
|
— |
|
|
3,798 |
|
|
6,815 |
| |||
| Changes in assets and liabilities that relate to operations: |
||||||||||||
| Receivables |
|
(50,114 |
) |
|
(11,505 |
) |
|
(26,888 |
) | |||
| Inventories |
|
(72,080 |
) |
|
219,135 |
|
|
(27,254 |
) | |||
| Other assets |
|
2,225 |
|
|
(2,572 |
) |
|
(688 |
) | |||
| Notes payable—floor plan |
|
105,809 |
|
|
(203,840 |
) |
|
43,224 |
| |||
| Trade accounts payable and other liabilities |
|
(14,590 |
) |
|
5,593 |
|
|
19,271 |
| |||
| Total adjustments |
|
7,077 |
|
|
47,340 |
|
|
32,319 |
| |||
| Net cash provided by operating activities |
|
81,249 |
|
|
126,669 |
|
|
138,883 |
| |||
| CASH FLOWS FROM INVESTING ACTIVITIES: |
||||||||||||
| Purchase of businesses, net of cash acquired |
|
(91,554 |
) |
|
(120,158 |
) |
|
(202,365 |
) | |||
| Purchases of property and equipment |
|
(73,171 |
) |
|
(43,600 |
) |
|
(92,516 |
) | |||
| Proceeds from sales of property and equipment |
|
47,943 |
|
|
12,810 |
|
|
42,320 |
| |||
| Proceeds from sale of dealerships |
|
7,148 |
|
|
14,068 |
|
|
17,575 |
| |||
| Net cash used in investing activities |
|
(109,634 |
) |
|
(136,880 |
) |
|
(234,986 |
) | |||
| CASH FLOWS FROM FINANCING ACTIVITIES: |
||||||||||||
| Net borrowings/(repayments) on revolving credit facilities |
|
69,342 |
|
|
(45,885 |
) |
|
18,257 |
| |||
| Proceeds from long-term debt |
|
1,418 |
|
|
74,583 |
|
|
145,074 |
| |||
| Payments on long-term debt |
|
(3,696 |
) |
|
(2,966 |
) |
|
(2,382 |
) | |||
| Repurchase of debt securities |
|
— |
|
|
— |
|
|
(32,746 |
) | |||
| Redemptions of Preferred Stock |
|
(13,551 |
) |
|
(251 |
) |
|
— |
| |||
| Purchases of Class A Common Stock |
|
(26,480 |
) |
|
(26,519 |
) |
|
(33,780 |
) | |||
| Issuance of shares under stock compensation plans |
|
2,619 |
|
|
9,982 |
|
|
12,256 |
| |||
| Net cash provided by financing activities |
|
29,652 |
|
|
8,944 |
|
|
106,679 |
| |||
| NET INCREASE (DECREASE) IN CASH |
|
1,267 |
|
|
(1,267 |
) |
|
10,576 |
| |||
| CASH, BEGINNING OF YEAR |
|
— |
|
|
1,267 |
|
|
— |
| |||
| CASH, END OF YEAR |
$ |
1,267 |
|
$ |
— |
|
$ |
10,576 |
| |||
| SUPPLEMENTAL DISCLOSURES OF CASH FLOW INFORMATION |
||||||||||||
| Cash paid during the year for: |
||||||||||||
| Interest |
$ |
90,678 |
|
$ |
71,972 |
|
$ |
65,019 |
| |||
| Income taxes |
$ |
36,821 |
|
$ |
30,553 |
|
$ |
42,239 |
| |||
| SUPPLEMENTAL SCHEDULE OF NON-CASH FINANCING ACTIVITIES: |
||||||||||||
| Class A Convertible Preferred Stock issued for acquisitions and contingent consideration |
$ |
11,589 |
|
$ |
— |
|
$ |
— |
| |||
| Conversion of Class A Convertible Preferred Stock |
$ |
25,947 |
|
$ |
— |
|
$ |
— |
| |||
| Class A Common Stock issued for acquisitions |
$ |
— |
|
$ |
— |
|
$ |
34,509 |
| |||
| Change in fair value of cash flow hedging instrument (net of tax benefit of $4,122) |
$ |
— |
|
$ |
— |
|
$ |
(6,447 |
) | |||
See notes to consolidated financial statements.
F-5
SONIC AUTOMOTIVE, INC. AND SUBSIDIARIES
NOTES TO CONSOLIDATED FINANCIAL STATEMENTS
(All tables in thousands except per share amounts)
1. DESCRIPTION OF BUSINESS AND SUMMARY OF SIGNIFICANT ACCOUNTING POLICIES
Organization and Business—Sonic Automotive, Inc (“Sonic”) is one of the largest automotive retailers in the United States (as measured by total revenue), operating 186 dealership franchises and 44 collision repair centers throughout the United States as of December 31, 2002. Sonic sells new and used cars and light trucks, sells replacement parts, provides vehicle maintenance, warranty, paint and repair services, and arranges related financing and insurance for its automotive customers. As of December 31, 2002, Sonic sold a total of 34 foreign and domestic brands of new vehicles.
Principles of Consolidation—All material intercompany balances and transactions have been eliminated in the consolidated financial statements. In addition, Sonic has a 50% ownership interest in two joint ventures where the partners are not affiliated with Sonic. These investments are accounted for under the equity method whereby we record our share of each respective joint venture’s pretax profit or loss. We recorded $0.4 million in net income in 2002 and $0.3 million in net income in 2001 related to these investments. These entities are not consolidated into Sonic’s financial statements because Sonic does not have operating control of the entities. However, Sonic has guaranteed $6.0 million in indebtedness between North Point Volvo, LLC, one of the joint ventures, and Bank of America, N.A., including a $5.5 million revolving floor plan agreement expiring in 2003, of which $2.0 million was outstanding at December 31, 2002, and a $0.4 million term loan expiring in 2007. We have guaranteed no other obligations of either company.
Reclassifications—Effective January 1, 2002, Sonic adopted the provisions of Statement of Financial Accounting Standards (SFAS) No. 144 applicable to the accounting for the disposal of long-lived assets. This pronouncement broadened the definition of items which qualify as discontinued operations. As a result, individual dealerships sold or classified as held for sale after December 31, 2001 are now required to be reported as discontinued operations. Accordingly, the results of operations of dealerships sold during 2002 and held for sale as of December 31, 2002 have been reclassified in our consolidated income statements to income/loss from discontinued operations for all periods presented. In addition, in order to maintain consistency and comparability between periods, certain other amounts in our consolidated balance sheets have been reclassified from previously reported balances to conform to the current year presentation. These reclassifications relate primarily to contracts-in-transit which are now classified in receivables, net rather than cash.
Use of Estimates—The preparation of financial statements in conformity with accounting principles generally accepted in the United States of America requires management to make estimates and assumptions that affect the reported amounts of assets and liabilities and disclosure of contingent assets and liabilities at the date of the financial statements and the reported amounts of revenues and expenses during the reporting period. Actual results could differ from those estimates particularly related to allowance for credit loss, realization of inventory, intangible asset and deferred tax asset values, reserves for future chargebacks, insurance reserves and certain accrued expenses.
Revenue Recognition—Sonic records revenue when vehicles are delivered to customers, when vehicle service work is performed and when parts are delivered.
Sonic arranges financing for customers through various financial institutions and receives a commission from the lender equal to the difference between the interest rates charged to customers over the predetermined interest rates set by the financing institution. Sonic also receives commissions from the sale of various insurance contracts to customers. Sonic may be assessed a chargeback fee in the event of early cancellation of a loan or insurance contract by the customer. Finance and insurance commission revenue is recorded net of estimated chargebacks at the time the related contract is placed with the financial institution.
F-6
SONIC AUTOMOTIVE, INC. AND SUBSIDIARIES
NOTES TO CONSOLIDATED FINANCIAL STATEMENTS—(Continued)
Sonic also receives commissions from the sale of non-recourse third party extended service contracts to customers. Under these contracts the applicable manufacturer or third party warranty company is directly liable for all warranties provided within the contract. Commission revenue from the sale of these third party extended service contracts is recorded net of estimated chargebacks at the time of sale.
Floor Plan Assistance—Floor plan assistance payments received from manufacturers are generally based on rates similar to those incurred under our floor plan financing arrangements. This assistance is considered a subsidy of the carrying cost of our new vehicle inventory. Sonic recognizes this assistance as a reduction of cost of sales in the accompanying consolidated statements of income. Amounts included in cost of sales were $33.3 million, $30.8 million and $38.7 million for the years ended December 31, 2000, 2001 and 2002, respectively.
Cash—Although not required under the terms of any credit agreement, Sonic’s practice has been to apply all of its available cash to reduce the outstanding balance on Sonic’s revolving credit facility for the purpose of maximizing the return on these funds and minimizing interest expense.
Contracts in Transit—Contracts in transit represent customer finance contracts evidencing loan agreements or lease agreements between Sonic, as creditor, and the customer, as borrower, to acquire or lease a vehicle in situations where a third-party finance source has given Sonic initial, non-binding approval to assume Sonic’s position as creditor. Funding and final approval from the finance source is provided upon the finance source’s review of the loan or lease agreement and related documentation executed by the customer at the dealership. These finance contracts are typically funded within ten days of the initial approval of the finance transaction given by the third-party finance source. The finance source is not contractually obligated to make the loan or lease to the customer until it gives its final approval and funds the transaction, and until such final approval is given, the contracts in transit represent amounts due from the customer to Sonic. Contracts in transit are included in receivables on the accompanying consolidated balance sheets and totaled $127.9 million at December 31, 2001 and $135.4 million at December 31, 2002.
Accounts receivable—Our accounts receivable consist primarily of amounts due from the manufacturers for repair services performed on vehicles with a remaining factory warranty and amounts due from third parties from the sale of parts. We believe that there is minimal risk of uncollectability on warranty receivables. We evaluate parts and other receivables for collectability based on the age of the receivable, the credit history of the customer and past collection experience. The allowance for doubtful accounts receivable is not significant.
Inventories—Inventories of new and used vehicles, including demonstrators, are stated at the lower of specific cost or market. Inventories of parts and accessories are accounted for using the “first-in, first-out” (“FIFO”) method of inventory accounting and are stated at the lower of FIFO cost or market. Other inventories, which primarily include rental and service vehicles, are stated at the lower of specific cost or market.
Sonic assesses the valuation of all of its vehicle and parts inventories and maintains a reserve where the cost basis exceeds the fair market value. In making this assessment for new vehicles, Sonic primarily considers the age of the vehicles along with the timing of annual and model changeovers. For used vehicles, Sonic considers recent market data and trends such as loss histories along with the current age of the inventory. Parts inventories are primarily assessed considering excess quantity and continued usefulness of the part. The risk with parts inventories is minimized by the fact that excess or obsolete parts can generally be returned to the manufacturer. We have not recorded any significant reserves on any of our inventory balances.
F-7
SONIC AUTOMOTIVE, INC. AND SUBSIDIARIES
NOTES TO CONSOLIDATED FINANCIAL STATEMENTS—(Continued)
Property and Equipment—Property and equipment are stated at cost. Depreciation is computed using the straight-line method over the estimated useful lives of the assets. The range of estimated useful lives is as follows:
| Building and improvements. |
5-40 years | |
| Office equipment and fixtures. |
5-15 years | |
| Parts and service equipment. |
15 years | |
| Company vehicles |
5 years |
As discussed above, effective January 1, 2002, Sonic adopted the provisions of SFAS 144 regarding the accounting for the impairment of long-lived assets which requires certain long-lived assets to be reported at the lower of carrying amount or fair value, less cost to sell, and provides guidance in asset valuation and measuring impairment. Accordingly, Sonic reviews the carrying value of property and equipment and other long-term assets (other than goodwill) for impairment whenever events or changes in circumstances indicate that the carrying value may not be recoverable. If such an indication is present, Sonic compares the carrying amount of the asset to the estimated undiscounted cash flows related to those assets. Sonic concludes that an asset is impaired if the sum of such expected future cash flows is less than the carrying amount of the related asset. If Sonic determines an asset is impaired, the impairment loss would be the amount by which the carrying amount of the related asset exceeds its fair value. The fair value of the asset would be determined based on the quoted market prices, if available. If quoted market prices are not available, Sonic determines fair value by using a discounted cash flow model. No impairment has been determined or recorded in any of the periods presented.
Derivative Instruments and Hedging Activities—Sonic utilizes derivative financial instruments for the purpose of hedging the risks of certain identifiable and anticipated transactions. In general, the types of risks being hedged are those relating to the variability of future earnings and cash flows caused by fluctuations in interest rates. Sonic documents its risk management strategy and hedge effectiveness at the inception of and during the term of each hedge. The only derivatives currently being used are interest rate swaps used for the purpose of hedging cash flows of variable rate debt. These derivatives are used only for that purpose, not for speculation or trading purposes. The derivatives, which have been designated and qualify as cash flow hedging instruments, are reported at fair value in the accompanying balance sheets. The gain or loss on the effective portion of the hedge is initially reported as a component of accumulated other comprehensive loss.
Goodwill and Other Intangible Assets—Effective July 1, 2001, Sonic adopted the provisions of SFAS 141, “Business Combinations.” Among other provisions, SFAS 141 provides guidance regarding the recognition and measurement of goodwill and other acquired intangible assets. For acquisitions after July 1, 2001, the provisions of SFAS 141 require separate recognition of intangible assets acquired if the benefit of the asset is obtained through contractual or other legal rights, or if the asset can be sold, transferred, licensed, rented, or exchanged. Goodwill is recognized to the extent that the purchase price of the acquisition exceeds the estimated fair value of the net assets acquired, including other identifiable intangible assets. The principal identifiable intangible assets other than goodwill acquired in an acquisition are rights under franchise agreements with manufacturers. The economic useful lives of these franchise agreements have been determined to be indefinite. Franchise agreements acquired after July 1, 2001 have been included in Other Intangible Assets on the accompanying consolidated balance sheets. Prior to the adoption of SFAS 141, franchise agreements were recorded and amortized as part of goodwill.
F-8
SONIC AUTOMOTIVE, INC. AND SUBSIDIARIES
NOTES TO CONSOLIDATED FINANCIAL STATEMENTS—(Continued)
Effective January 1, 2002, Sonic also adopted the provisions of SFAS 142, “Goodwill and Other Intangible Assets.” Among other things, SFAS 142 no longer permits the amortization of goodwill or intangible assets with indefinite lives, but requires that the carrying amount of such assets be reviewed for impairment and reduced against operations if they are found to be impaired. Prior to the adoption of SFAS 142, goodwill and intangible assets acquired prior to July 1, 2002 were amortized over a 40 year period. Effective January 1, 2002, such amortization ceased. The following table shows the effect on net income and net income per share for the years ending December 31, 2000 and 2001 as if the provisions of SFAS 142 eliminating goodwill amortization had been applied as of January 1, 2000.
| For the Year ended December 31, | |||||||||
| 2000 |
2001 |
2002 | |||||||
| Reported net income |
$ |
74,172 |
$ |
79,329 |
$ |
106,564 | |||
| Goodwill amortization, net of tax |
|
9,702 |
|
13,509 |
|
— | |||
| Adjusted net income |
$ |
83,874 |
$ |
92,838 |
$ |
106,564 | |||
| Basic net income per share: |
|||||||||
| Reported net income |
$ |
1.74 |
$ |
1.96 |
$ |
2.55 | |||
| Goodwill amortization, net of tax |
|
0.23 |
|
0.33 |
|
— | |||
| Adjusted net income |
$ |
1.97 |
$ |
2.29 |
$ |
2.55 | |||
| Diluted net income per share: |
|||||||||
| Reported net income |
$ |
1.69 |
$ |
1.91 |
$ |
2.47 | |||
| Goodwill amortization, net of tax |
|
0.22 |
|
0.33 |
|
— | |||
| Adjusted net income |
$ |
1.91 |
$ |
2.24 |
$ |
2.47 | |||
We have completed the impairment tests required by SFAS No. 142 for goodwill and other intangible assets with indefinite lives. In order to evaluate goodwill for impairment, we compared the carrying value to the fair value of the underlying businesses. Based on the results of our tests, no impairment was indicated for goodwill or other intangible assets. We will continue to test goodwill and other intangible assets with indefinite lives for impairment annually, or more frequently if events or circumstances indicate possible impairment.
Income Taxes—Income taxes are provided for the tax effects of transactions reported in the financial statements and consist of taxes currently due plus deferred taxes. Deferred taxes are provided at currently enacted tax rates for the tax effects of carryforward items and temporary differences between the tax basis of assets and liabilities and their reported amounts in the financial statements. A valuation allowance is provided when it is more likely than not that taxable income will not be sufficient to fully realize the benefits of deferred tax assets. No valuation allowance has been recorded in any period presented.
Stock-Based Compensation—In December 2002, the Financial Accounting Standards Board (“FASB”) issued Statement of Financial Accounting Standard No. 148, “Accounting for Stock-Based Compensation—Transition and Disclosure”. SFAS 148 amends Statement of Financial Accounting Standards No. 123, “Accounting for Stock-Based Compensation,” to provide alternate methods of transition for companies electing to voluntarily change to the fair value method of accounting for stock-based compensation and also amends the disclosure provisions of SFAS 123. The provisions of SFAS 148 are effective for fiscal years ending after December 15, 2002. Sonic has adopted the disclosure provisions of SFAS 148.
At December 31, 2002, Sonic had three stock-based employee compensation plans, which are described more fully in Note 9. Sonic accounts for those plans under the recognition and measurement provisions of APB
F-9
SONIC AUTOMOTIVE, INC. AND SUBSIDIARIES
NOTES TO CONSOLIDATED FINANCIAL STATEMENTS—(Continued)
Opinion No. 25, Accounting for Stock Issued to Employees, and related Interpretations. In accordance with those provisions, because the exercise price of all options granted under those plans equaled the market value of the underlying stock at the grant date, no stock-based employee compensation cost is recorded. Using the Black- Scholes option pricing model for all options granted, the following table illustrates the effect on net income and earnings per share if Sonic had applied the fair value recognition provisions of FASB Statement No. 123, Accounting for Stock-Based Compensation, to stock-based employee compensation:
| For the Year ended December 31, |
||||||||||||
| 2000 |
2001 |
2002 |
||||||||||
| Reported net income |
$ |
74,172 |
|
$ |
79,329 |
|
$ |
106,564 |
| |||
| Fair value compensation cost, net of tax |
|
(3,399 |
) |
|
(5,685 |
) |
|
(7,933 |
) | |||
| Pro forma net income |
$ |
70,773 |
|
$ |
73,644 |
|
$ |
98,631 |
| |||
| Basic net income per share: |
||||||||||||
| Reported net income |
$ |
1.74 |
|
$ |
1.96 |
|
$ |
2.55 |
| |||
| Fair value compensation cost, net of tax |
|
(0.08 |
) |
|
(0.14 |
) |
|
(0.19 |
) | |||
| Pro forma net income |
$ |
1.66 |
|
$ |
1.82 |
|
$ |
2.36 |
| |||
| Diluted net income per share: |
||||||||||||
| Reported net income |
$ |
1.69 |
|
$ |
1.91 |
|
$ |
2.47 |
| |||
| Fair value compensation cost, net of tax |
|
(0.08 |
) |
|
(0.14 |
) |
|
(0.18 |
) | |||
| Pro forma net income |
$ |
1.61 |
|
$ |
1.77 |
|
$ |
2.29 |
| |||
The weighted average fair value of options granted or assumed was $4.41, $3.79, and $15.12 per share in 2000, 2001 and 2002, respectively. The fair value of each option granted during 2000, 2001 and 2002 was estimated using the Black-Scholes option-pricing model with the following weighted average assumptions:
| 2000 |
2001 |
2002 | ||||
| Employee Stock Purchase Plan |
||||||
| Dividend yield |
n/a |
n/a |
n/a | |||
| Risk free interest rates |
5.32-6.74% |
2.17-4.30% |
1.51-2.76% | |||
| Expected lives |
0.25-1.0 year |
0.25-1.0 year |
0.25-1.0 year | |||
| Volatility |
44.85% |
55.21% |
52.36% | |||
| Stock Option Plans |
||||||
| Dividend yield |
n/a |
n/a |
n/a | |||
| Risk free interest rates |
5.92%-6.53% |
3.47-5.07% |
3.26-4.58% | |||
| Expected lives |
5 years |
5 years |
5 years | |||
| Volatility |
44.85% |
55.21% |
53.27% |
Concentrations of Credit Risk—Financial instruments that potentially subject Sonic to concentrations of credit risk consist principally of cash on deposit with financial institutions. At times, amounts invested with financial institutions may exceed FDIC insurance limits. Concentrations of credit risk with respect to receivables are limited primarily to automobile manufacturers and financial institutions. The large number of customers comprising the trade receivables balances reduces credit risk arising from trade receivables from commercial customers.
As of December 31, 2002, Sonic has outstanding notes receivable from finance contracts of $12.4 million, net of an allowance for credit losses of $1.9 million. Outstanding notes receivable at December 31, 2001 were
F-10
SONIC AUTOMOTIVE, INC. AND SUBSIDIARIES
NOTES TO CONSOLIDATED FINANCIAL STATEMENTS—(Continued)
$12.0 million, net of an allowance of $1.8 million. These notes have average terms of approximately 30 months and are secured by the related vehicles. The assessment of our allowance for credit losses considers historical loss ratios and the performance of the current portfolio with respect to past due accounts. These notes are recorded in other current and long-term assets on the accompanying consolidated balance sheets.
Financial Instruments and Market Risks—As of December 31, 2001 and 2002, the fair values of Sonic’s financial instruments, including receivables, notes receivable from finance contracts, notes payable-floor plan, trade accounts payable, payables to Sonic’s Chairman, payables for acquisitions and long-term debt, excluding Sonic’s senior subordinated notes, approximate their carrying values due either to length of maturity or existence of variable interest rates that approximate prevailing market rates.
The fair value of Sonic’s senior subordinated notes based on the quoted bid price as of December 31, 2001 and 2002 was approximately $207.0 million and $189.7 million, respectively. The carrying value of Sonic’s senior subordinated notes as of December 31, 2001 and 2002 was approximately $195.7 million and $179.0 million, respectively.
The fair value of Sonic’s convertible senior subordinated notes based on the quoted bid price as of December 31, 2002 was approximately $100.4 million. The carrying value of Sonic’s convertible senior subordinated notes as of December 31, 2002 was approximately $126.5 million.
Sonic has variable rate floor plan note facilities, revolving credit facilities and other variable rate notes that expose it to risks caused by fluctuations in the underlying interest rates. The total outstanding balance of such facilities was approximately $911.3 million at December 31, 2001 and $1,190.5 million at December 31, 2002.
In order to reduce its exposure to market risks from fluctuations in interest rates, Sonic entered into two separate interest rate swap agreements on January 15, 2002 and June 6, 2002 to effectively convert a portion of our LIBOR-based variable rate debt to a fixed rate. The swaps each have a notional principal amount of $100 million and mature on October 31, 2004 and June 6, 2006, respectively. Under the terms of the swap agreement entered into on January 15, 2002, Sonic receives interest payments on the notional amount at a rate equal to the one month LIBOR rate, adjusted monthly, and makes interest payments at a fixed rate of 3.88%. Under the terms of the swap agreement entered into on June 6, 2002, Sonic receives interest payments on the notional amount at a rate equal to the one month LIBOR rate, adjusted monthly, and makes interest payments at a fixed rate of 4.50%. Incremental interest expense incurred (the difference between interest received and interest paid) as a result of these interest rate swaps was $3.6 million for year ended December 31, 2002, and has been included in interest expense, other in the accompanying consolidated statements of income.
The interest rate swaps have been designated and qualify as cash flow hedges and, as a result, changes in the fair value of the interest rate swaps have been recorded in accumulated other comprehensive loss, net of related income taxes, in our statements of stockholders’ equity. The fair value of the interest rate swaps as of December 31, 2002 is recorded in other long-term liabilities on the accompanying balance sheet. The change in fair value of the swaps during the year ended December 31 2002, recorded in accumulated other comprehensive loss, was approximately $10.6 million ($6.4 million, net of tax). Because the critical terms of the interest rate swaps and the underlying debt obligations were the same, no ineffectiveness was recorded.
Advertising—Sonic expenses advertising costs in the period incurred, net of earned manufacturer credits for advertising. Advertising expense amounted to $48.0 million, $47.1 million and $61.9 million for the years ended December 31, 2000, 2001 and 2002, respectively.
F-11
SONIC AUTOMOTIVE, INC. AND SUBSIDIARIES
NOTES TO CONSOLIDATED FINANCIAL STATEMENTS—(Continued)
Segment Information—Sonic sells similar products and services (new and used vehicles, parts, service and collision repair services), uses similar processes in selling products and services, and sells its products and services to similar classes of customers. As a result of this and the way Sonic manages its business, Sonic has aggregated its results into a single segment for purposes of reporting financial condition and results of operations.
Recent Accounting Pronouncements—In April 2002, the FASB issued SFAS No. 145: “Rescission of FASB Statements No. 4, 44 and 64, Amendment of FASB Statement No. 13, and Technical Corrections”. Prior to adoption, gains or losses resulting from extinguishment of debt were required to be classified as extraordinary items, net of related tax effects. Upon adoption of SFAS No. 145, however, the classification of such gains or losses as extraordinary must be evaluated based on the criteria established in APB Opinion No. 30. Gains and losses not meeting that criteria, including gains and losses classified as extraordinary in prior periods, must be classified in income from operations. Sonic adopted the provisions of SFAS No. 145 effective July 1, 2002. Gains or losses incurred on the early extinguishment of debt (debt repurchases) have been included in other income in the accompanying consolidated statements of income.
In June 2002, the FASB issued SFAS No. 146, “Accounting for Costs Associated with Exit or Disposal Activities.” SFAS 146 requires the recognition of a liability for costs associated with an exit or disposal activity at the time the liability is incurred, rather than at the date of the entity’s commitment to the exit or disposal plan. The provisions of SFAS 146 are effective for exit or disposal activities initiated after December 31, 2002. We do not expect the adoption of SFAS 146 to have a material effect on our consolidated operating results, financial position, or cash flows.
In November 2002, the FASB issued FASB Interpretation (“FIN”) No. 45, “Guarantor’s Accounting and Disclosure Requirements for Guarantees of Indebtedness of Others.” FIN 45 requires the recognition of a liability for certain guarantees issued after December 31, 2002, or for modifications made after December 31, 2002 to previously issued guarantees, and clarifies disclosure requirements for certain guarantees. The disclosure provisions of FIN 45 are effective for fiscal years ended after December 15, 2002. We have adopted the disclosure provisions of FIN 45 as of December 31, 2002. See Note 10.
In January 2003, the FASB issued FIN 46, “Consolidation of Variable Interest Entities, an Interpretation of ARB No. 51.” FIN 46 requires the consolidation of certain variable interest entities by the primary beneficiary if the equity investors do not have a controlling financial interest or sufficient equity at risk to finance the entities’ activities without additional subordinated financial support of other parties. The provisions of FIN 46 are effective for all variable interest entities created or acquired after January 31, 2003. For variable interest entities created or acquired prior to that date, the provisions of FIN 46 must be applied for the first interim or annual period beginning after June 15, 2003. The adoption of FIN 46 is not expected to have a material impact on our consolidated results of operations, financial position or cash flows.
2. BUSINESS ACQUISITIONS AND DISPOSITIONS
Completed Acquisitions
Sonic generally seeks to acquire larger, well managed dealerships or multiple franchise dealership groups located in metropolitan or high growth suburban markets. Sonic also looks to acquire single franchise dealerships that will allow Sonic to capitalize on professional management practices and provide greater breadth of products and services in existing markets. Occasionally, Sonic acquires dealerships that have under performed the industry average, but represent attractive franchises or have attractive locations that would immediately benefit from our professional management.
F-12
SONIC AUTOMOTIVE, INC. AND SUBSIDIARIES
NOTES TO CONSOLIDATED FINANCIAL STATEMENTS—(Continued)
On March 25, 2002, Sonic acquired 15 dealerships and on May 20, 2002 acquired one additional dealership, owned directly or indirectly by Donald E. Massey (the “Massey Acquisition”) for approximately $117.5 million in cash and 1,336,151 shares of Class A common stock valued at approximately $34.5 million, based on the average closing price as quoted by the New York Stock Exchange for several days before and after the acquisition was announced. The acquired dealerships are located in California, Colorado, Florida, North Carolina, Michigan, Tennessee and Texas. The purchase price of this acquisition has been allocated to the assets and liabilities acquired based on their estimated fair market value at the acquisition date as shown in the table below:
| Inventories |
$ |
162,492 |
| |
| Floor plan notes payable |
|
(143,659 |
) | |
| Other working capital |
|
1,776 |
| |
| Property and equipment |
|
4,719 |
| |
| Goodwill |
|
93,523 |
| |
| Other intangible assets |
|
35,426 |
| |
| Non-current liabilities assumed |
|
(2,240 |
) | |
| Total purchase price |
$ |
152,037 |
| |
The tax deductible goodwill associated with the above acquisitions was approximately $68.5 million.
During 2002, Sonic also acquired the following dealerships for approximately $96.0 million in cash:
| • | On January 21, 2002, Sonic acquired Park Place Audi located in Dallas, Texas; |
| • | On February 25, 2002, Sonic acquired five dealerships owned by Don Kott located in the metropolitan area of Los Angeles, California; |
| • | On March 18, 2002, Sonic acquired Philpott Motors Hyundai located in the metropolitan area of Houston, Texas; |
| • | On July 2, 2002, Sonic acquired 3 dealerships owned by Frank Parra located in the metropolitan area of Dallas, Texas; |
| • | On July 15, 2002, Sonic acquired Acura 101 located in the metropolitan area of Los Angeles, California; |
| • | On August 26, 2002, Sonic acquired Stone Mountain Chevrolet located in the metropolitan area of Atlanta, Georgia; |
| • | On September 19, 2002, Sonic acquired Riverside Toyota located in Tulsa, Oklahoma; |
| • | On September 30, 2002, Sonic acquired Capital Imports located in Columbia, South Carolina; and |
| • | On December 12, 2002, Sonic acquired Mountain States Motors located in Denver, Colorado. |
Goodwill recognized in these transactions amounted to approximately $67.9 million of which approximately $18.6 million is expected to be fully deductible for tax purposes.
During 2001, Sonic acquired 12 dealerships for approximately $129.9 million in cash.
F-13
SONIC AUTOMOTIVE, INC. AND SUBSIDIARIES
NOTES TO CONSOLIDATED FINANCIAL STATEMENTS—(Continued)
During 2000, Sonic acquired 11 dealerships for approximately $92.0 million in cash and 11,589 shares of Sonic’s Class A convertible preferred stock, Series II, recorded at an estimated value of approximately $11.6 million.
All of our acquisitions have been accounted for using the purchase method of accounting, and the results of operations of such acquisitions have been included in the accompanying consolidated financial statements from their respective acquisition dates. We are still in the process of obtaining data necessary to complete the allocation of the purchase price of our recent acquisitions. As a result, the values of assets and liabilities acquired in 2002 reflect preliminary estimates where values have not yet been determined and may ultimately be different than amounts recorded once actual values are determined. Any adjustment to the value of assets and liabilities will be recorded against goodwill.
Pro Forma Results of Operations
The following unaudited pro forma financial information presents a summary of consolidated results of operations as if all of the above acquisitions had occurred at the beginning of the year in which the acquisitions were completed, and at the beginning of the immediately preceding year, after giving effect to certain adjustments, including amortization of goodwill, interest expense on acquisition debt and related income tax effects. The pro forma financial information does not give effect to adjustments relating to net reductions in floorplan interest expense resulting from renegotiated floorplan financing agreements or to reductions in salaries and fringe benefits of former owners or officers of acquired dealerships who have not been retained by Sonic or whose salaries have been reduced pursuant to employment agreements with Sonic. The pro forma results have been prepared for comparative purposes only and are not necessarily indicative of the results of operations that would have occurred had the acquisitions actually been completed at the beginning of the periods presented. These results are also not necessarily indicative of the results of future operations.
| Year Ended December 31, | ||||||
| 2001 |
2002 | |||||
| Total revenues |
$ |
8,496,724 |
$ |
7,542,445 | ||
| Gross profit |
$ |
1,214,368 |
$ |
1,147,142 | ||
| Net income |
$ |
89,780 |
$ |
109,519 | ||
| Diluted net income per share |
$ |
2.16 |
$ |
2.54 | ||
Sale of Dealership Subsidiaries
During 2002, Sonic disposed of 16 franchises, resulting in the closing of nine dealerships and three collision repair centers, and approved, but had not completed the sale of, ten additional franchises, which will result in the closing of nine additional dealerships. These were generally smaller dealerships with unprofitable operations. The dealerships disposed of and held for sale generated combined revenues of $343.6 million during 2002 and $457.4 million in 2001, and generated a combined pre-tax loss of $3.4 million and $3.1 million in 2002 and 2001, respectively. In accordance with the provisions of SFAS No. 144, the results of operations of these dealerships, including gains or losses on disposition, have been included in the loss from operations of discontinued dealerships in the accompanying consolidated statement of income. Long-lived assets to be disposed in connection with dealerships not yet sold, consisting primarily of property, plant and equipment and goodwill, totaled approximately $14.5 million at December 31, 2002 and have been classified in other current assets in the accompanying audited consolidated balance sheet. Other assets and liabilities to be disposed in connection with these dispositions include inventories and related floor plan notes payable.
In addition to the dispositions discussed above, during the year ended December 31, 2001, Sonic sold or otherwise disposed of assets from 15 other dealership franchises, resulting in the closing of nine dealerships.
F-14
SONIC AUTOMOTIVE, INC. AND SUBSIDIARIES
NOTES TO CONSOLIDATED FINANCIAL STATEMENTS—(Continued)
These dealerships generated combined revenues of $81.6 million and incurred pretax losses of $4.4 million in the year ended December 31, 2001. The results of operations of these dealerships have been included in net income from continuing operations in the accompanying consolidated statements of income.
3. INVENTORIES AND RELATED NOTES PAYABLE—FLOOR PLAN
Inventories consist of the following:
| December 31, | ||||||
| 2001 |
2002 | |||||
| New vehicles |
$ |
476,628 |
$ |
733,757 | ||
| Used vehicles |
|
110,152 |
|
111,884 | ||
| Parts and accessories |
|
48,705 |
|
50,860 | ||
| Other |
|
25,820 |
|
32,949 | ||
| Total |
$ |
661,305 |
$ |
929,450 | ||
We finance our new vehicle inventory through standardized floor plan credit facilities with Chrysler Financial Company, LLC (“Chrysler Financial”), Ford Motor Credit Company (“Ford Credit”), General Motors Acceptance Corporation (“GMAC”), Toyota Motor Credit Corporation (“Toyota Credit”) and Bank of America, N.A. These floor plan facilities bear interest at variable rates based on prime and LIBOR. The weighted average interest rate for our floor plan facilities was 3.58% for the year ended December 31, 2002 and 5.83% for the year ended December 31, 2001. Our floor plan interest expenses are substantially offset by amounts received from manufacturers, in the form of floor plan assistance, which is recorded as a reduction of cost of sales. During the year ended December 31, 2002, the amounts we received from floor plan assistance exceeded our floor plan interest expense by approximately $15.0 million.
The underlying notes are due when the related vehicles are sold and are collateralized by vehicle inventories and other assets, excluding franchise agreements, of the relevant dealership subsidiary. The floor plan facilities contain a number of covenants, including among others, covenants restricting us with respect to the creation of liens and changes in ownership, officers and key management personnel. We are in compliance with all restrictive covenants as of December 31, 2002.
4. PROPERTY AND EQUIPMENT
Property and equipment is comprised of the following:
| December 31, |
||||||||
| 2001 |
2002 |
|||||||
| Land |
$ |
10,863 |
|
$ |
5,983 |
| ||
| Building and improvements |
|
34,387 |
|
|
42,201 |
| ||
| Office equipment and fixtures |
|
29,492 |
|
|
31,616 |
| ||
| Parts and service equipment |
|
21,917 |
|
|
22,485 |
| ||
| Company vehicles |
|
7,078 |
|
|
8,211 |
| ||
| Construction in progress |
|
16,003 |
|
|
33,637 |
| ||
| Total, at cost |
|
119,740 |
|
|
144,133 |
| ||
| Less accumulated depreciation |
|
(20,768 |
) |
|
(22,197 |
) | ||
| Property and equipment, net |
$ |
98,972 |
|
$ |
121,936 |
| ||
Interest capitalized in conjunction with construction projects was approximately $1.1 million, $1.4 million and $2.5 million for the years ended December 31, 2000, 2001, and 2002, respectively.
F-15
SONIC AUTOMOTIVE, INC. AND SUBSIDIARIES
NOTES TO CONSOLIDATED FINANCIAL STATEMENTS—(Continued)
In addition to the amounts shown above, Sonic incurred approximately $39.2 million in real estate and construction costs as of December 31, 2002 and $18.0 million as of December 31, 2001 on facilities that are or were expected to be completed and sold within one year in sale-leaseback transactions. Accordingly, these costs are included in other current assets on the accompanying consolidated balance sheets. Under the terms of the sale-leaseback transactions, Sonic sells the properties to a third party entity and enters into long-term operating leases on the facilities.
5. LONG-TERM DEBT
Long-term debt consists of the following:
| December 31 |
||||||||
| 2001 |
2002 |
|||||||
| Senior Subordinated Notes bearing interest at 11%, maturing August 1, 2008 |
$ |
200,000 |
|
$ |
182,360 |
| ||
| Convertible Senior Subordinated Notes bearing interest at 5.25%, maturing May 7, 2009 |
|
— |
|
|
130,100 |
| ||
| $600 million revolving credit facility bearing interest at 2.50 percentage points above LIBOR and maturing in October 2004, collateralized by all assets of Sonic (1) |
|
299,193 |
|
|
330,718 |
| ||
| $50 million revolving construction line of credit with Ford Credit |
|
8,533 |
|
|
— |
| ||
| $50 million revolving real estate acquisition line of credit with Ford Credit |
|
4,735 |
|
|
— |
| ||
| $50 million revolving construction line of credit with Toyota Credit bearing interest at 2.25 percentage points above LIBOR and maturing December 31, 2007, collateralized by Sonic’s guarantee and a lien on all of the borrowing subsidiaries’ real estate and other assets |
|
— |
|
|
— |
| ||
| $100 million revolving real estate acquisition line of credit with Toyota Credit bearing interest at 2.0 percentage points above LIBOR and maturing December 31, 2012, collateralized by Sonic’s guarantee and a lien on all of the borrowing subsidiaries’ real estate and other assets |
|
— |
|
|
— |
| ||
| Other notes payable (primarily equipment notes) |
|
6,306 |
|
|
4,137 |
| ||
| $ |
518,767 |
|
$ |
647,315 |
| |||
| Less unamortized discount |
|
(4,304 |
) |
|
(7,006 |
) | ||
| Less current maturities |
|
(2,586 |
) |
|
(2,764 |
) | ||
| Long-term debt |
$ |
511,877 |
|
$ |
637,545 |
| ||
| (1) | Certain terms have been amended subsequent to December 31, 2002. See further discussion below. |
Future maturities of debt are as follows:
| Year ending December 31, |
|||
| 2003 |
$ |
2,764 | |
| 2004 |
|
1,011 | |
| 2005 |
|
142 | |
| 2006 |
|
330,799 | |
| 2007 |
|
76 | |
| Thereafter. |
|
312,523 | |
| Total |
$ |
647,315 | |
F-16
SONIC AUTOMOTIVE, INC. AND SUBSIDIARIES
NOTES TO CONSOLIDATED FINANCIAL STATEMENTS—(Continued)
The Revolving Facility
As of December 31, 2002 Sonic had a revolving credit facility (the “Revolving Facility”) with Ford Credit, Chrysler Financial and Toyota Credit with a borrowing limit of $600 million, subject to a borrowing base calculated on the basis of our receivables, inventory and equipment and a pledge of certain additional collateral by an affiliate of Sonic (the borrowing base was approximately $490.5 million at December 31, 2002). The amounts outstanding under the Revolving Facility bore interest at 2.50% above LIBOR (LIBOR was 1.38% at December 31, 2002) and had an original maturity date of October 31, 2004 (terms have been amended subsequent to December 31, 2002; see discussion below). The Revolving Facility included a commitment fee equal to 0.25% of the unused portion of the facility. This fee was approximately $0.2 million in 2001 and approximately $0.8 million in 2002.
We agreed under the Revolving Facility not to pledge any of our assets to any third party (with the exception of currently encumbered assets of our dealership subsidiaries that are subject to previous pledges or liens). In addition, the Revolving Facility contained certain negative covenants, including covenants restricting or prohibiting the payment of dividends, capital expenditures and material dispositions of assets as well as other customary covenants and default provisions. Financial covenants included specified ratios of:
| Covenant |
Required | |
| Current ratio |
>1.23 | |
| Fixed charge coverage |
>1.41 | |
| Interest coverage |
>2.00 | |
| Adjusted debt to EBITDA |
<2.25 |
Sonic was in compliance with all of the above financial covenants as of December 31, 2002.
In addition, the loss of voting control over Sonic by O. Bruton Smith, Chairman and Chief Executive Office, Scott Smith, Chief Strategic Officer and Vice Chairman, and their spouses or immediate family members or our failure, with certain exceptions, to own all the outstanding equity, membership or partnership interests in our dealership subsidiaries will constitute an event of default under the Revolving Facility. Sonic was in compliance with all restrictive covenants as of December 31, 2002.
On February 5, 2003, Sonic amended the Revolving Facility to add Bank of America, N.A. to the lending group and extended the term of the facility from October 31, 2004 to October 31, 2006. In addition, the overall limit was reduced to $500 million and the interest rate was changed to LIBOR plus 2.55 percentage points. Because the calculation of the borrowing base (as described above) did not change, the total availability under the Revolving Facility remained the same. All other significant covenants and terms of the Revolving Facility remained the same.
Convertible Senior Subordinated Notes
On May 7, 2002, Sonic issued $149.5 million in aggregate principal amount of 5.25% convertible senior subordinated notes with net proceeds, before expenses, of approximately $145.1 million. The net proceeds were used to repay a portion of the amounts outstanding under the Revolving Credit Facility. The notes are unsecured obligations that rank equal in right of payment to all of Sonic’s existing and future senior subordinated indebtedness, mature on May 7, 2009 and are redeemable at Sonic’s option after May 7, 2005. Sonic’s obligations under these notes are not guaranteed by any of its subsidiaries.
The notes are convertible into shares of Class A common stock, at the option of the holder, if as of the last day of the preceding fiscal quarter, the closing sale price of our Class A common stock for at least 20 trading days in a period of 30 consecutive trading days ending on the last trading-day of such preceding fiscal quarter is more than 110% of the conversion price per share of Class A common stock on the last day of such preceding fiscal quarter. If this condition is satisfied, then the notes will be convertible at any time, at the option of the holder, through maturity. The initial conversion price per share is $46.87, and will be subject to adjustment for
F-17
SONIC AUTOMOTIVE, INC. AND SUBSIDIARIES
NOTES TO CONSOLIDATED FINANCIAL STATEMENTS—(Continued)
certain distributions on, or other changes in our Class A Common Stock, if any, prior to the conversion date. In addition, on or before May 7, 2007, a holder also may convert notes into shares of our Class A common stock at any time after a 10 consecutive trading-day period in which the average of the trading day prices for the notes for that 10 trading-day period is less than 103% of the average conversion value for the notes during that period. The conversion value is equal to the product of the closing sale price for our Class A common stock on a given day multiplied by the then current conversion rate, which is the number of shares of Class A common stock into which each $1,000 principal amount of notes is then convertible. These notes were not convertible as of December 31, 2002.
In the year ended December 31, 2002, Sonic repurchased $19.4 million in aggregate principal amount of the convertible notes on the open market for approximately $14.5 million. A resulting gain of $4.3 million, net of write-offs of unamortized discounts and deferred debt issuance costs, is included in other income in the accompanying consolidated statements of income for the year ended December 31, 2002.
Senior Subordinated Notes
The senior subordinated notes are subordinated to all present and future senior indebtedness of Sonic, including the revolving credit facility discussed above. The senior subordinated notes are unsecured, mature on August 1, 2008, and are redeemable at Sonic’s option after August 1, 2003. Interest payments are due semi-annually on February 1 and August 1. Redemption prices during the 12-month periods beginning August 1 are 105.500% in 2003, 103.667% in 2004, 101.833% in 2005 and 100% thereafter. The discount on the senior subordinated notes is being amortized over the term of the notes using the effective interest method.
In the year ended December 31, 2002, Sonic repurchased $17.6 million in aggregate principal amount of the senior subordinated notes on the open market for approximately $18.2 million. A resulting loss of $1.1 million, net of write-offs of unamortized discounts and deferred debt issuance costs, is included in other income in the accompanying consolidated statements of income for the year ended December 31, 2002.
The indentures governing the senior subordinated notes contain certain specified restrictive and required financial covenants. Sonic has agreed not to pledge its assets to any third party except under certain limited circumstances. Sonic also has agreed to certain other limitations or prohibitions concerning the incurrence of other indebtedness, capital stock, guaranties, asset sales, investments, cash dividends to shareholders, distributions and redemptions. Sonic was in compliance with all restrictive covenants as of December 31, 2002.
The Mortgage Facility
Prior to December 31, 2002, we had a $50 million revolving construction line of credit with Ford Credit bearing interest at 2.25 percentage points above LIBOR. In addition, we had a $50 million real estate acquisition line of credit with Ford Credit bearing interest at 2.00 percentage points above LIBOR. On December 31, 2002, we replaced the Ford Credit facilities with a revolving real estate acquisition and construction line of credit (the “Construction Loan”) and a related mortgage refinancing facility (the “Permanent Loan” and collectively with the Construction Loan, the “Mortgage Facility”) with Toyota Credit. Under the Construction Loan, our dealership development subsidiaries can borrow up to $50.0 million to finance land acquisition and dealership construction costs. Advances can be made under the Construction Loan until November 2007. All advances will mature on December 31, 2007, bear interest at 2.25 percentage points above LIBOR and are secured by Sonic’s guarantee and a lien on all of the borrowing subsidiaries’ real estate and other assets.
Under the Permanent Loan, we can borrow up to $100.0 million to refinance advances under the Construction Loan once the projects are completed or to finance real estate acquisition costs to the extent these costs were not previously financed under the Construction Loan. Advances can be made under the Permanent
F-18
SONIC AUTOMOTIVE, INC. AND SUBSIDIARIES
NOTES TO CONSOLIDATED FINANCIAL STATEMENTS—(Continued)
Loan until December 2007. All advances under the Permanent Loan mature on December 31, 2012, bear interest at 2.00% above LIBOR and are secured by the same collateral given under the Construction Loan.
The Mortgage Facility allows us to borrow up to $100 million in the aggregate under the Construction Loan and the Permanent Loan. The Mortgage Facility is not cross-collateralized with the Revolving Facility; however, a default under one will cause a default under the other. Among other customary covenants, the borrowing subsidiaries under the Mortgage Facility agreed not to incur any other liens on their property (except for existing encumbrances on property acquired) and not to transfer their property or more than 20% of their ownership interests to any third party. In addition, the loss of voting control by Bruton Smith, Scott Smith and their spouses or immediate family members, with certain exceptions, will result in an event of default under the Mortgage Facility. Sonic was in compliance with all restrictive covenants as of December 31, 2002.
Subsidiary Guarantees
Balances outstanding under Sonic’s revolving credit facilities and senior subordinated notes are guaranteed by all of Sonic’s operating subsidiaries. These guarantees are full and unconditional and joint and several. The parent company has no independent assets or operations and subsidiaries that are not guarantors are not material.
6. INCOME TAXES
The provision for income taxes from continuing operations consists of the following:
| 2000 |
2001 |
2002 | |||||||
| Current: |
|||||||||
| Federal |
$ |
29,873 |
$ |
34,627 |
$ |
43,050 | |||
| State |
|
4,227 |
|
4,382 |
|
5,571 | |||
|
|
34,100 |
|
39,009 |
|
48,621 | ||||
| Deferred |
|
10,913 |
|
12,667 |
|
18,200 | |||
| Total provision for income taxes from continuing operations |
$ |
45,013 |
$ |
51,676 |
$ |
66,821 | |||
The reconciliation of the statutory federal income tax rate with Sonic’s federal and state overall effective income tax rate from continuing operations is as follows:
| 2000 |
2001 |
2002 |
|||||||
| Statutory federal rate |
35.00 |
% |
35.00 |
% |
35.00 |
% | |||
| Effective state income tax rate |
1.96 |
|
1.72 |
|
2.65 |
| |||
| Nondeductible goodwill amortization |
1.34 |
|
1.47 |
|
— |
| |||
| Other |
(0.12 |
) |
0.62 |
|
0.46 |
| |||
| Effective tax rate |
38.18 |
% |
38.81 |
% |
38.11 |
% | |||
F-19
SONIC AUTOMOTIVE, INC. AND SUBSIDIARIES
NOTES TO CONSOLIDATED FINANCIAL STATEMENTS—(Continued)
Deferred income taxes reflect the net tax effects of the temporary differences between the carrying amounts of assets and liabilities for financial reporting purposes and the amounts used for tax purposes. Significant components of Sonic’s deferred tax assets and liabilities as of December 31 are as follows:
| 2001 |
2002 |
|||||||
| Deferred tax assets: |
||||||||
| Allowance for bad debts |
$ |
720 |
|
$ |
715 |
| ||
| Inventory |
|
829 |
|
|
— |
| ||
| Accruals and reserves |
|
4,049 |
|
|
11,173 |
| ||
| Fair value of interest rate swaps |
|
— |
|
|
4,122 |
| ||
| Net operating loss carryforwards |
|
6,028 |
|
|
7,778 |
| ||
| Other |
|
— |
|
|
326 |
| ||
| Total deferred tax assets |
|
11,626 |
|
|
24,114 |
| ||
| Deferred tax liabilities: |
||||||||
| Basis difference in inventory |
|
— |
|
|
(6,585 |
) | ||
| Basis difference in property and equipment |
|
(5,913 |
) |
|
(7,594 |
) | ||
| Basis difference in goodwill |
|
(28,315 |
) |
|
(44,924 |
) | ||
| Other |
|
(3,265 |
) |
|
(3,612 |
) | ||
| Total deferred tax liability |
|
(37,493 |
) |
|
(62,715 |
) | ||
| Net deferred tax liability |
$ |
(25,867 |
) |
$ |
(38,601 |
) | ||
Net current deferred tax assets are recorded in other current assets on the accompanying consolidated balance sheets. At December 31, 2002, Sonic had state net operating loss carryforwards of $134.3 million that will expire between 2012 and 2022.
7. RELATED PARTIES
Registration Rights Agreement
Prior to its initial public offering, Sonic signed a Registration Rights Agreement dated as of June 30, 1997 with Sonic Financial Corporation (“SFC”), O. Bruton Smith, Scott Smith and William S. Egan (collectively, the “Class B Registration Rights Holders”). SFC currently owns 8,881,250 shares of Class B common stock; Bruton Smith, 2,171,250 shares; Scott Smith, 976,402 shares; and Egan Group, LLC, an assignee of Mr. Egan (the “Egan Group”), 473 shares, all of which are covered by the Registration Rights Agreement. The Egan Group also owns certain shares of Class A common stock to which the Registration Rights Agreement applies. If, among other things provided in Sonic’s charter, offers and sales of shares of Class B common stock are registered with the Securities and Exchange Commission, then such shares will automatically convert into a like number of shares of Class A common stock.
The Class B Registration Rights Holders have certain limited piggyback registration rights under the Registration Rights Agreement. These rights permit them to have their shares of Sonic’s common stock included in any Sonic registration statement registering Class A common stock, except for registrations on Form S-4, relating to exchange offers and certain other transactions, and Form S-8, relating to employee stock compensation plans. The Registration Rights Agreement expires in November 2007. SFC is controlled by O. Bruton Smith.
Payable to Company’s Chairman
Sonic has a note payable to O. Bruton Smith in the amount of $5.5 million (the “Subordinated Smith Loan”). The Subordinated Smith Loan bears interest at Bank of America’s announced prime rate plus
F-20
SONIC AUTOMOTIVE, INC. AND SUBSIDIARIES
NOTES TO CONSOLIDATED FINANCIAL STATEMENTS—(Continued)
0.5% (prime rate was 4.25% at December 31, 2002) and has a stated maturity date of November 30, 2000. Under the terms of a subordination agreement currently in effect, however, the principal amount owed by Sonic to Mr. Smith under the Subordinated Smith Loan is to be paid only after all amounts owed by Sonic under the senior subordinated notes are fully paid in cash. Accordingly, the Subordinated Smith Loan has been classified as non-current on the accompanying consolidated balance sheets.
Dealership Leases:
Sonic leases three dealership properties in Northern California from the Price Trust. Tom Price, who served as Sonic’s Vice Chairman until October 2002 and as director of Sonic until December 2002, and his wife are the sole beneficiaries of the Price Trust. Lease costs associated with these leases was approximately $2.2 million in 2000, $2.8 million 2001 and $2.6 million in 2002.
Sonic leases three dealership properties in Northern California from Bay Automotive, LLC, in which Mr. Price owns a 50% interest. Annual aggregate rent under these leases was approximately $0.9 million in 2000, $2.2 million in 2001 and $2.6 million in 2002.
Sonic leases office space in Charlotte from a subsidiary of SFC for a majority of its headquarters personnel. Annual aggregate rent under this lease was approximately $0.2 million in 2000, $0.3 million in 2001, and $0.4 million in 2002.
Other Transactions:
Sonic rents various aircraft owned by SFC, subject to their availability, for business-related travel by Sonic employees. Sonic incurred costs of approximately $1.1 million in 2000, $0.6 million in 2001 and $1.2 million in 2002 for the use of these aircrafts.
Certain of Sonic’s dealerships purchase the Z-Max oil additive product from Oil Chem Research Company, a subsidiary of Speedway Motorsports, Inc. (“SMI”), for resale to service customers of the dealerships in the ordinary course of business. Total purchases from Oil Chem by Sonic dealerships, either directly from Oil Chem or indirectly through an Oil Chem distributor, totaled approximately $0.4 million in 2000, $0.7 million in 2001 and approximately $1.8 million in 2002.
Sonic and its dealerships frequently purchase apparel items, which are screen-printed with Sonic and dealership logos, as part of internal marketing and sales promotions. Sonic and its dealerships purchase such items from several companies, including Speedway Systems, LLC, a company owned by SMI. Total purchases from Speedway Systems by Sonic and its dealerships totaled approximately $0.2 million in 2000, $0.2 million in 2001 and $0.4 million in 2002.
In 2001, Las Vegas Motor Speedway, a subsidiary of SMI, leased a fleet of new vehicles for use by its employees from a Sonic dealership for approximately $0.2 million. In 2002, this fleet was purchased by Las Vegas Motor Speedway for approximately $0.7 million. No significant gain or loss resulted from this transaction.
In connection with the supervision and management of significant construction and renovation projects at Sonic dealerships in 2000, Sonic paid approximately $0.1 million to SMI in 2000 for project management services provided to Sonic by SMI employees.
8. CAPITAL STRUCTURE AND PER SHARE DATA
Preferred Stock—Sonic has 3 million shares of “blank check” preferred stock authorized with such designations, rights and preferences as may be determined from time to time by the Board of Directors. The
F-21
SONIC AUTOMOTIVE, INC. AND SUBSIDIARIES
NOTES TO CONSOLIDATED FINANCIAL STATEMENTS—(Continued)
Board of Directors has designated 300,000 shares of preferred stock as Class A convertible preferred stock, par value $0.10 per share (the “Preferred Stock”) which is divided into 100,000 shares of Series I Preferred Stock, 100,000 shares of Series II Preferred Stock, and 100,000 shares of Series III Preferred Stock. There were no shares of Preferred Stock issued or outstanding at December 31, 2002 and 2001.
Common Stock—Sonic has two classes of common stock. Sonic has authorized 100 million shares of Class A common stock at a par value of 0.01 per share. Class A common stock entitles its holder to one vote per share. There were 28,520,474 and 29,111,542 shares of Class A common stock outstanding at December 31, 2001 and 2002, respectively. Sonic has also authorized 30 million shares of Class B common stock at a par value of $.01 per share. Class B common stock entitles its holder to ten votes per share, except in certain circumstances. Each share of Class B common stock is convertible into one share of Class A common stock either upon voluntary conversion at the option of the holder, or automatically upon the occurrence of certain events, as provided in Sonic’s charter.
Share Repurchases—Sonic’s Board of Directors has authorized Sonic to expend up to $145 million to repurchase shares of its Class A common stock or redeem securities convertible into Class A common stock. As of December 31, 2002, Sonic had repurchased a total of 8,134,164 shares of Class A common stock at an average price per share of approximately $11.45 and had redeemed 13,801.5 shares of Class A convertible preferred stock at an average price of $1,000 per share. Subsequent to December 31, 2002, Sonic repurchased an additional 432,800 shares of Class A common stock for approximately $6.7 million.
F-22
SONIC AUTOMOTIVE, INC. AND SUBSIDIARIES
NOTES TO CONSOLIDATED FINANCIAL STATEMENTS—(Continued)
Per Share Data—The calculation of diluted net income per share considers the potential dilutive effect of options and shares under Sonic’s stock compensation plans, Class A common stock purchase warrants, and Class A convertible preferred stock. The following table illustrates the dilutive effect of such items on net income per share:
| For the Year Ended December 31, 2002 | ||||||||||||||||||||||
| Net Income From Continuing Operations |
Net Loss From Discontinued Operations |
Net Income | ||||||||||||||||||||
| Shares |
Amount |
Per Share Amount |
Amount |
Per Share Amount |
Amount |
Per Share Amount | ||||||||||||||||
| Basic Net Income Per Share |
41,728 |
$ |
108,509 |
$ |
2.60 |
$ |
(1,945 |
) |
$ |
(0.05 |
) |
$ |
106,564 |
$ |
2.55 | |||||||
| Effect of Dilutive Securities: |
||||||||||||||||||||||
| Stock Compensation Plans |
1,428 |
|||||||||||||||||||||
| Warrants |
2 |
|||||||||||||||||||||
| Diluted Net Income Per Share |
43,158 |
$ |
108,509 |
$ |
2.51 |
$ |
(1,945 |
) |
$ |
(0.04 |
) |
$ |
106,564 |
$ |
2.47 | |||||||
| For the Year Ended December 31, 2001 | ||||||||||||||||||||||
| Net Income From Continuing Operations |
Net Loss From Discontinued Operations |
Net Income | ||||||||||||||||||||
| Shares |
Amount |
Per Share Amount |
Amount |
Per Share Amount |
Amount |
Per Share Amount | ||||||||||||||||
| Basic Net Income Per Share |
40,541 |
$ |
81,487 |
$ |
2.01 |
$ |
(2,158 |
) |
$ |
(0.05 |
) |
$ |
79,329 |
$ |
1.96 | |||||||
| Effect of Dilutive Securities: |
||||||||||||||||||||||
| Stock Compensation Plans |
1,048 |
|||||||||||||||||||||
| Warrants |
14 |
|||||||||||||||||||||
| Convertible Preferred |
6 |
|||||||||||||||||||||
| Diluted Net Income Per Share |
41,609 |
$ |
81,487 |
$ |
1.96 |
$ |
(2,158 |
) |
$ |
(0.05 |
) |
$ |
79,329 |
$ |
1.91 | |||||||
| For the Year Ended December 31, 2000 | ||||||||||||||||||||||
| Net Income From Continuing Operations |
Net Loss From Discontinued Operations |
Net Income | ||||||||||||||||||||
| Shares |
Amount |
Per Share Amount |
Amount |
Per Share Amount |
Amount |
Per Share Amount | ||||||||||||||||
| Basic Net Income Per Share |
42,518 |
$ |
72,880 |
$ |
1.71 |
$ |
1,292 |
|
$ |
0.03 |
|
$ |
74,172 |
$ |
1.74 | |||||||
| Effect of Dilutive Securities: |
||||||||||||||||||||||
| Stock Compensation Plans |
455 |
|||||||||||||||||||||
| Warrants |
31 |
|||||||||||||||||||||
| Convertible Preferred |
822 |
|||||||||||||||||||||
| Diluted Net Income Per Share |
43,826 |
$ |
72,880 |
$ |
1.66 |
$ |
1,292 |
|
$ |
0.03 |
|
$ |
74,172 |
$ |
1.69 | |||||||
In addition to the stock options included in the table above, options to purchase 2,688,676 and 2,138,050 shares of Class A common stock were outstanding during the years ended December 31, 2000 and 2002, respectively, but were not included in the computation of diluted net income per share because the options were antidilutive. There were no antidilutive options at December 31, 2001.
F-23
SONIC AUTOMOTIVE, INC. AND SUBSIDIARIES
NOTES TO CONSOLIDATED FINANCIAL STATEMENTS—(Continued)
9. Employee Benefit Plans
Substantially all of the employees of Sonic are eligible to participate in a 401(k) plan. Contributions by Sonic to the plan were $1.2 million in 2000, $2.0 million in 2001 and $4.0 million in 2002.
Stock Option Plans
Sonic currently has three option plans, the Sonic Automotive, Inc. 1997 Stock Option Plan (the “Stock Option Plan”), the Sonic Automotive, Inc. Formula Stock Option Plan (the “Directors’ Plan”), and the FirstAmerica Automotive, Inc. 1997 Stock Option Plan (the “First America Plan”).
The Stock Option Plan was adopted by the Board of Directors in order to attract and retain key personnel and currently authorizes the issuance of options to purchase 8.0 million shares of Class A common stock. Subsequent to December 31, 2002, Sonic’s Board of Directors approved an increase in the shares authorized for issuance under the Stock Option Plan from 8.0 million shares to 9.0 million shares. This increase is pending stockholder approval at Sonic’s Annual Meeting. Under the Stock Option Plan, options to purchase shares of Class A common stock may be granted to key employees of Sonic and its subsidiaries and to officers, directors, consultants and other individuals providing services to Sonic. The options are granted at the fair market value of Sonic’s Class A common stock at the date of grant, vest over a three year period, are exercisable upon vesting and expire ten years from the date of grant.
The Directors’ Plan authorizes options to purchase up to an aggregate of 600,000 shares of Class A common stock. Under the plan, each outside director shall be awarded on or before March 31st of each year an option to purchase 10,000 shares at an exercise price equal to the fair market value of the Class A common stock at the date of the award. Options granted under the Directors’ Plan become exercisable after six months, and expire ten years from their date of grant.
A summary of the status of Sonic’s stock option plans is presented below:
| Number of Options |
Exercise Price Per Share |
Weighted average Exercise Price | |||||||
| (shares in thousands) |
|||||||||
| Outstanding at December 31, 1999 |
4,187 |
|
$ |
2.85—15.44 |
$ |
10.35 | |||
| Granted |
1,868 |
|
|
7.94—11.19 |
|
9.15 | |||
| Exercised |
(300 |
) |
|
2.85—13.12 |
|
5.95 | |||
| Forfeited |
(694 |
) |
|
2.85—15.44 |
|
10.33 | |||
| Outstanding at December 31, 2000 |
5,061 |
|
|
2.85—15.44 |
|
10.06 | |||
| Granted |
1,156 |
|
|
7.01—16.51 |
|
12.79 | |||
| Exercised |
(990 |
) |
|
2.85—15.44 |
|
8.88 | |||
| Forfeited |
(379 |
) |
|
7.94—15.44 |
|
10.57 | |||
| Outstanding at December 31, 2001 |
4,848 |
|
|
2.85—16.51 |
|
10.91 | |||
| Granted |
1,763 |
|
|
16.20—37.50 |
|
29.68 | |||
| Exercised |
(794 |
) |
|
2.85—16.51 |
|
9.70 | |||
| Forfeited |
(232 |
) |
|
7.25—37.50 |
|
18.04 | |||
| Outstanding at December 31, 2002 |
5,585 |
|
|
2.85—37.50 |
|
16.57 | |||
F-24
SONIC AUTOMOTIVE, INC. AND SUBSIDIARIES
NOTES TO CONSOLIDATED FINANCIAL STATEMENTS—(Continued)
The following table summarizes information about stock options outstanding at December 31, 2002:
| Range of Exercise Prices |
Shares Outstanding at 12/31/02 |
Weighted Average Remaining Contractual Life |
Weighted Average Exercise Price |
Shares Exercisable at 12/31/02 |
Weighted Average Exercise Price | |||||||
| (shares in thousands) | ||||||||||||
| $2.85 |
50 |
4.5 |
$ |
2.85 |
50 |
$ |
2.85 | |||||
| $2.86—7.50 |
289 |
5.0 |
|
6.25 |
283 |
|
6.23 | |||||
| $7.51—11.25 |
2,265 |
6.2 |
|
9.47 |
1,654 |
|
9.21 | |||||
| $11.26—15.00 |
102 |
6.6 |
|
13.34 |
83 |
|
13.42 | |||||
| $15.01—18.75 |
1,757 |
7.8 |
|
15.98 |
969 |
|
15.86 | |||||
| $26.25—$30.00 |
248 |
9.1 |
|
27.78 |
70 |
|
29.98 | |||||
| $37.50 |
874 |
9.2 |
|
37.50 |
— |
|
— | |||||
| 5,585 |
7.3 |
$ |
16.57 |
3,109 |
$ |
11.49 | ||||||
Employee Stock Purchase Plan
The Board of Directors and stockholders of Sonic adopted the Sonic Automotive, Inc. Employee Stock Purchase Plan (the “ESPP”) to attract and retain key personnel. The ESPP authorizes the issuance of options to purchase 3.0 million shares of Class A common stock. Under the terms of the ESPP, on January 1 of each year all eligible employees electing to participate will be granted an option to purchase shares of Class A common stock. Sonic’s Compensation Committee will annually determine the number of shares of Class A common stock available for purchase under each option. The purchase price at which Class A common stock will be purchased through the ESPP will be 85% of the lesser of (i) the fair market value of the Class A common stock on the applicable grant date and (ii) the fair market value of the Class A common stock on the applicable exercise date. The grant dates are January 1 of each year plus any other interim dates designated by the Compensation Committee. The exercise dates are the last trading days on the New York Stock Exchange for March, June, September and December, plus any other interim dates designated by the Compensation Committee. Options will expire on the last exercise date of the calendar year in which granted.
Nonqualified Employee Stock Purchase Plan
The Board of Directors of Sonic adopted the Sonic Automotive, Inc. Nonqualified Employee Stock Purchase Plan (the “Nonqualified ESPP”) to provide options to purchase Class A common stock to employees of Sonic’s subsidiaries that are not eligible to participate in the ESPP. Employees of Sonic who are eligible to participate in the ESPP are not eligible to participate in the Nonqualified ESPP. Under the terms of the Nonqualified ESPP, on January 1 of each year all employees eligible to participate in the Nonqualified ESPP and who elect to participate in the Nonqualified ESPP will be granted an option to purchase shares of Class A common stock. Sonic’s Compensation Committee will annually determine the number of shares of Class A common stock available for purchase under each option.
The purchase price at which Class A common stock will be purchased through the Nonqualified ESPP will be 85% of the lesser of (i) the fair market value of the Class A common stock on the applicable grant date and (ii) the fair market value of the Class A common stock on the applicable exercise date. The grant dates are January 1 of each year plus any other interim dates designated by the Compensation Committee. The exercise dates are the last trading days on the New York Stock Exchange for March, June, September and December, plus any other interim dates designated by the Compensation Committee. Options will expire on the last exercise date of the calendar year in which granted. In adopting the Nonqualified ESPP the Board of Directors authorized options for 300,000 shares of Class A common stock to be granted under the Nonqualified ESPP.
F-25
SONIC AUTOMOTIVE, INC. AND SUBSIDIARIES
NOTES TO CONSOLIDATED FINANCIAL STATEMENTS—(Continued)
Under both the ESPP and the Nonqualified ESPP, we issued options exercisable for approximately 524,000, 456,000 and 931,500 shares in 2000, 2001 and 2002, respectively. We issued approximately 148,000, 282,000 and 237,000 shares to employees in 2000, 2001 and 2002 at a weighted average purchase price of $7.27, $5.84 and 17.78 per share, respectively. The weighted average fair value of shares granted under both plans was $2.95, $10.94 and $4.92 per share in 2000, 2001 and 2002, respectively.
10. Commitments and Contingencies
Facility Leases
Minimum future rental payments required under noncancelable operating leases are as follows:
| Year ending December 31, |
|||
| 2003 |
$ |
77,005 | |
| 2004 |
|
73,326 | |
| 2005 |
|
69,858 | |
| 2006 |
|
65,520 | |
| 2007 |
|
62,619 | |
| Thereafter |
|
357,387 | |
| Total |
$ |
705,715 | |
Total rent expense for the years ended December 31, 2000, 2001 and 2002 was approximately $49.8 million, $59.8 million and $73.6 million, respectively.
Other Matters
In accordance with the terms of our real estate lease agreements, our dealership subsidiaries, acting as lessees, generally agree to indemnify the lessor from certain liabilities arising as a result of the use of the leased premises, including environmental liabilities and repairs to leased property upon termination of the lease. Sonic’s exposure with respect to these items is difficult to quantify. In addition, Sonic has generally agreed to indemnify the lessor in the event of a breach of the lease by the dealership subsidiary.
In accordance with the terms of agreements entered into for the sale of our dealership franchises, Sonic generally agrees to indemnify the buyer from certain liabilities and costs arising subsequent to the date of sale, including environmental liabilities and liabilities resulting from the breach of representations or warranties made in accordance with the agreement. These indemnifications generally expire within a period of one to two years following the date of sale, and Sonic’s exposure is generally limited to dollar amounts ranging from $25,000 to $5.0 million as specified within the agreements.
In connection with dealership dispositions certain of our dealership subsidiaries have assigned or sublet to the buyer their interests in real property leases associated with such dealerships. In general, the subsidiaries retain responsibility for the performance of certain obligations under such leases, including rent payments, environmental remediation, and repairs to leased property upon termination of the lease, to the extent that the assignee or sublessee does not perform. While Sonic’s exposure with respect to environmental remediation and repairs is difficult to quantify the total estimated rent payments remaining under such leases are approximately $17.1 million based on lease expiration dates ranging from October 31, 2007 to July 15, 2015. However, in accordance with the assignment and sublease agreements, the assignees and sublessees have generally agreed to indemnify Sonic and its subsidiaries in the event of non-performance.
F-26
SONIC AUTOMOTIVE, INC. AND SUBSIDIARIES
NOTES TO CONSOLIDATED FINANCIAL STATEMENTS—(Continued)
Sonic is involved, and will continue to be involved, in numerous legal proceedings arising in the ordinary course of our business, including litigation with customers, employment related lawsuits, contractual disputes and actions brought by governmental authorities. Currently, no legal proceedings are pending against or involve Sonic that, in the opinion of management, could reasonably be expected to have a material adverse effect on our business, financial condition or results of operations. However, the results of these proceedings cannot be predicted with certainty, and an unfavorable resolution of one or more of these proceedings could have a material adverse effect on our business, financial condition, results of operations, cash flows and prospects.
11. Summary of Quarterly Financial Data (Unaudited)
The following table summarizes Sonic’s results of operations as presented in the Consolidated Statements of Income by quarter for 2001 and 2002.
| First Quarter |
Second Quarter |
Third Quarter |
Fourth Quarter | |||||||||
| Year Ended December 31, 2001: |
||||||||||||
| Total revenues |
$ |
1,397,119 |
$ |
1,494,492 |
$ |
1,423,038 |
$ |
1,565,261 | ||||
| Gross profit |
$ |
210,556 |
$ |
230,452 |
$ |
224,207 |
$ |
239,445 | ||||
| Net income |
$ |
13,484 |
$ |
22,486 |
$ |
22,118 |
$ |
21,241 | ||||
| Net income per share—Basic |
$ |
0.33 |
$ |
0.56 |
$ |
0.55 |
$ |
0.53 | ||||
| Net income per share—Diluted |
$ |
0.33 |
$ |
0.55 |
$ |
0.53 |
$ |
0.51 | ||||
| Year Ended December 31, 2002: |
||||||||||||
| Total revenues |
$ |
1,509,579 |
$ |
1,861,913 |
$ |
1,961,834 |
$ |
1,737,690 | ||||
| Gross profit |
$ |
236,984 |
$ |
286,571 |
$ |
297,055 |
$ |
270,320 | ||||
| Net income |
$ |
22,079 |
$ |
31,488 |
$ |
31,590 |
$ |
21,406 | ||||
| Net income per share—Basic |
$ |
0.54 |
$ |
0.74 |
$ |
0.75 |
$ |
0.52 | ||||
| Net income per share—Diluted |
$ |
0.52 |
$ |
0.71 |
$ |
0.73 |
$ |
0.51 | ||||
| (1) | Our operations are subject to seasonal variations. The first and fourth quarters generally contribute less revenue and operating profits than the second and third quarters. Weather conditions, the timing of manufactureer incentive programs and model changeovers cause seasonality in new vehicle demand. Parts and service demand remains more stable throughout the year. |
| (2) | The sum of diluted net income per share for the quarters may not equal the full year amount due to weighted average common stock equivalents being calculated on a quarterly versus annual basis. |
F-27