Exhibit 99.2 Q2 2019 Investor Presentation
FORWARD-LOOKING STATEMENTS This presentation contains “forward-looking statements” within the meaning of the Private Securities Litigation Reform Act of 1995. These statements relate to future events, are not historical facts and are based on our current expectations and assumptions regarding our business, the economy and other future conditions. These statements can generally be identified by lead-in words such as “believe”, “expect”, “anticipate”, “intend”, “plan”, “foresee”, “may”, “will” and other similar words. Statements that describe our Company’s objectives, plans or goals are also forward-looking statements. Examples of such forward-looking information we may be discussing in this presentation include, without limitation, earnings expectations, anticipated 2019 industry new vehicle sales volume, the implementation of growth and operating strategies, including acquisitions of dealerships and properties, the development of open points and stand-alone pre-owned stores, the return of capital to stockholders, anticipated future success and impacts from the implementation of our strategic initiatives and earnings per share expectations. You are cautioned that these forward-looking statements are not guarantees of future performance, involve risks and uncertainties and actual results may differ materially from those projected in the forward-looking statements as a result of various factors. These risks and uncertainties include, without limitation, economic conditions in the markets in which we operate, new and used vehicle industry sales volume, the success of our operational strategies, the rate and timing of overall economic recovery or decline, and the risk factors described in the Company’s Annual Report on Form 10-K for the year ended December 31, 2018 and the Company’s other periodic reports and information filed with the Securities and Exchange Commission. These forward-looking statements, risks, uncertainties and additional factors speak only as of the date of this presentation. We undertake no obligation to update any such statements, except as required under federal securities laws and the rules and regulations of the Securities and Exchange Commission. 2
CONTENT • COMPANY OVERVIEW • FINANCIAL & OPERATIONS REVIEW • APPENDIX 3
COMPANY OVERVIEW 4
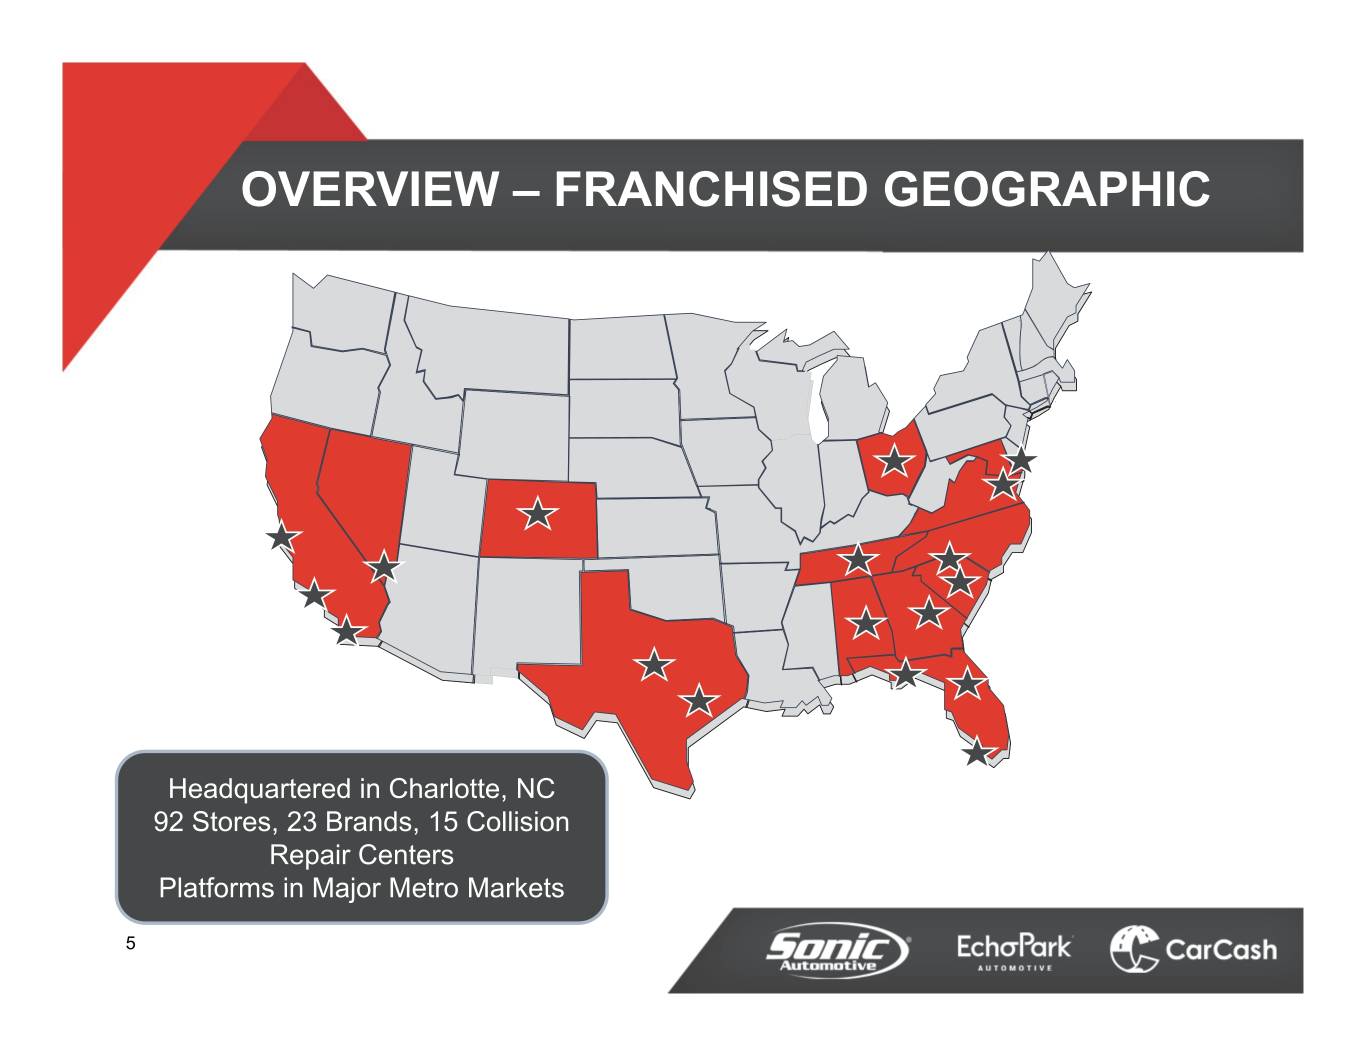
OVERVIEW – FRANCHISED GEOGRAPHIC Headquartered in Charlotte, NC 92 Stores, 23 Brands, 15 Collision Repair Centers Platforms in Major Metro Markets 5
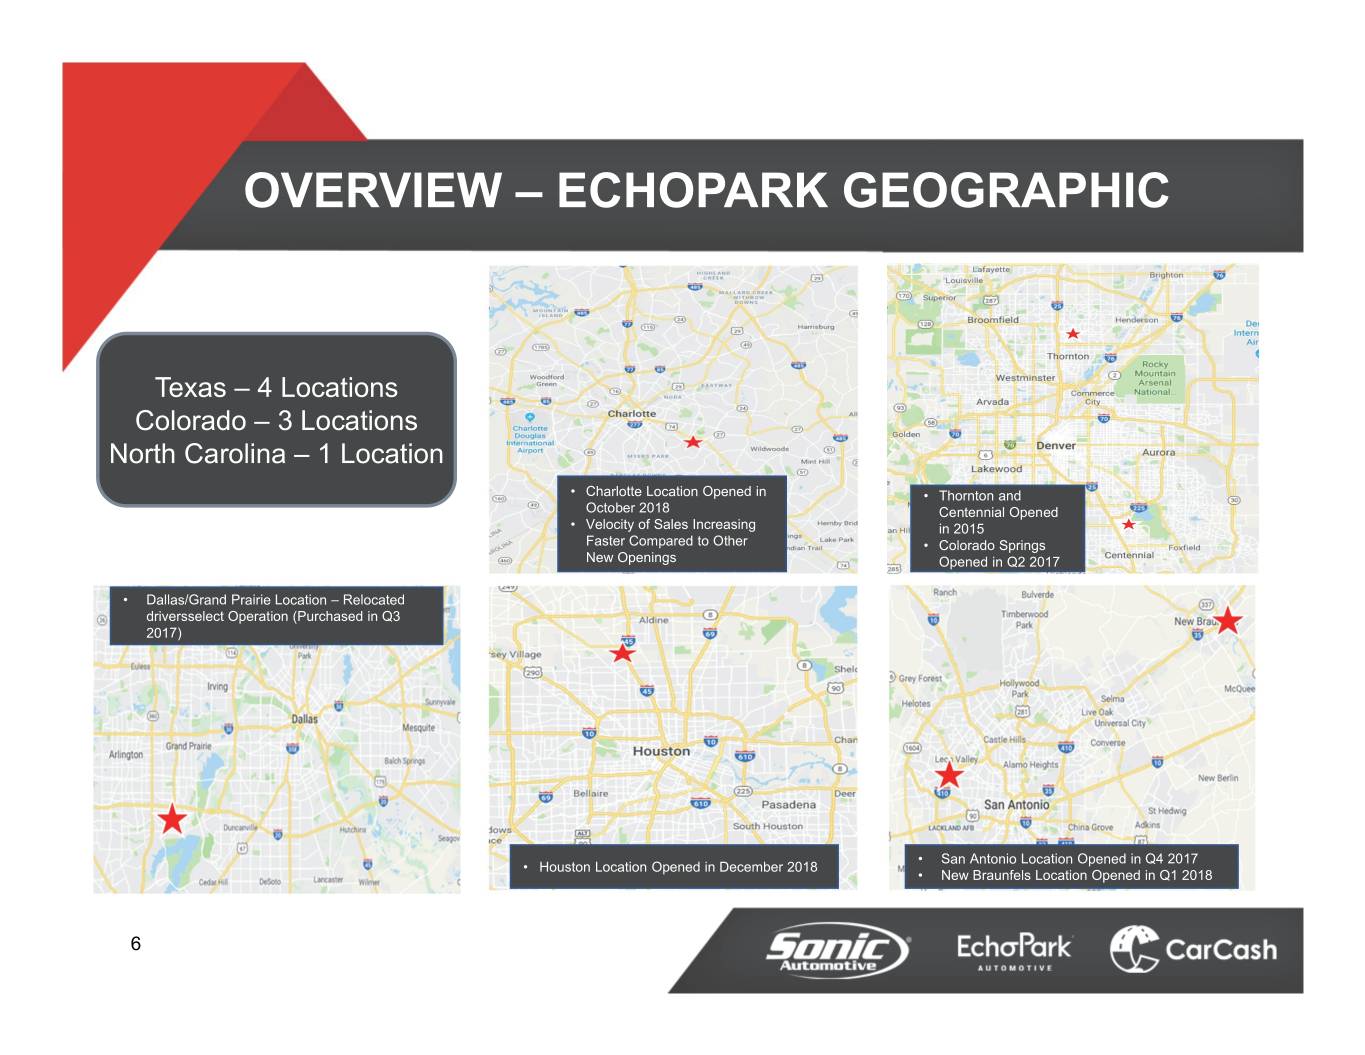
OVERVIEW – ECHOPARK GEOGRAPHIC Texas – 4 Locations Colorado – 3 Locations North Carolina – 1 Location • Charlotte Location Opened in • Thornton and October 2018 Centennial Opened • Velocity of Sales Increasing in 2015 Faster Compared to Other • Colorado Springs New Openings Opened in Q2 2017 • Dallas/Grand Prairie Location – Relocated driversselect Operation (Purchased in Q3 2017) • San Antonio Location Opened in Q4 2017 • Houston Location Opened in December 2018 • New Braunfels Location Opened in Q1 2018 6
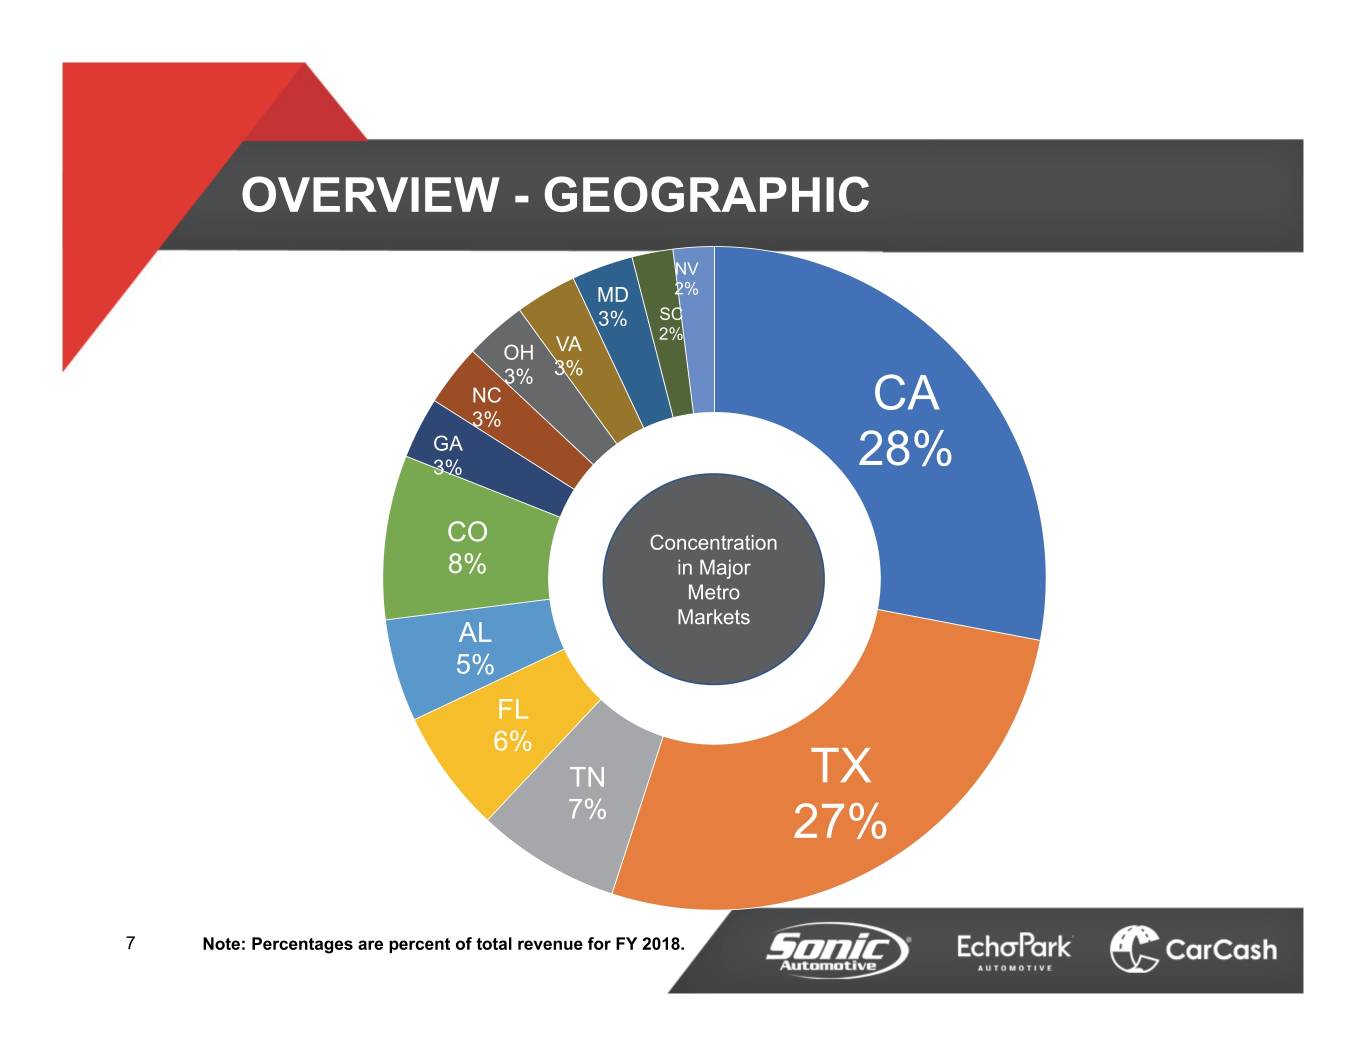
OVERVIEW - GEOGRAPHIC NV MD 2% 3% SC 2% OH VA 3% 3% NC CA 3% GA 3% 28% CO Concentration 8% in Major Metro Markets AL 5% FL 6% TN TX 7% 27% 7 Note: Percentages are percent of total revenue for FY 2018.
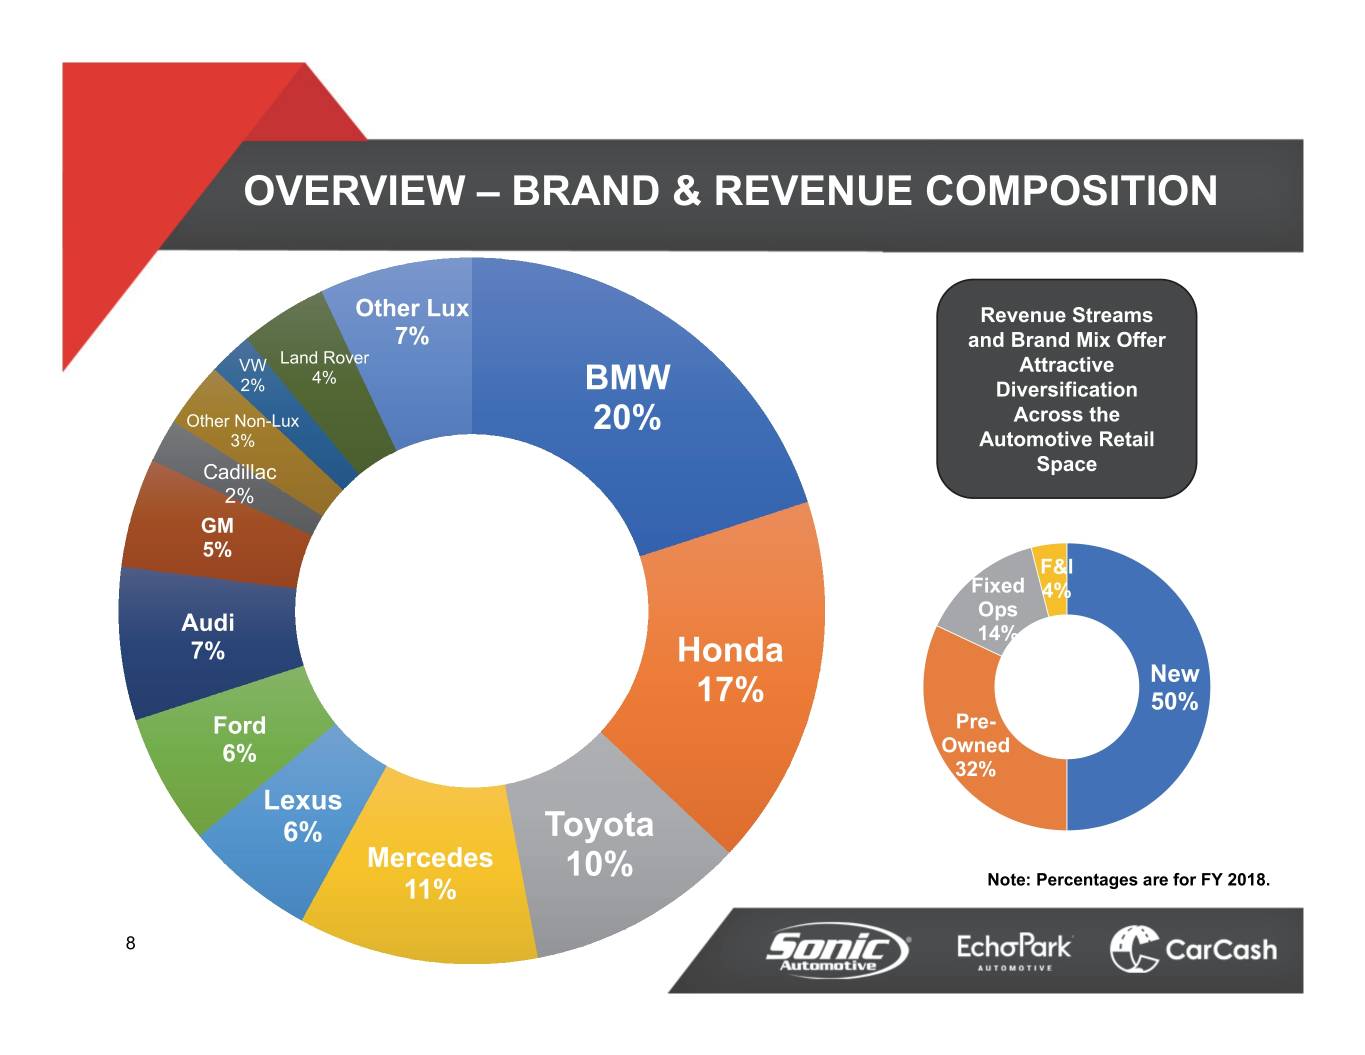
OVERVIEW – BRAND & REVENUE COMPOSITION Other Lux Revenue Streams 7% and Brand Mix Offer VW Land Rover Attractive 4% 2% BMW Diversification Other Non-Lux 20% Across the 3% Automotive Retail Cadillac Space 2% GM 5% F&I Fixed 4% Ops Audi 14% 7% Honda New 17% 50% Ford Pre- 6% Owned 32% Lexus 6% Toyota Mercedes 10% 11% Note: Percentages are for FY 2018. 8
Q2 2019 FINANCIAL REVIEW FRANCHISED SEGMENT 9
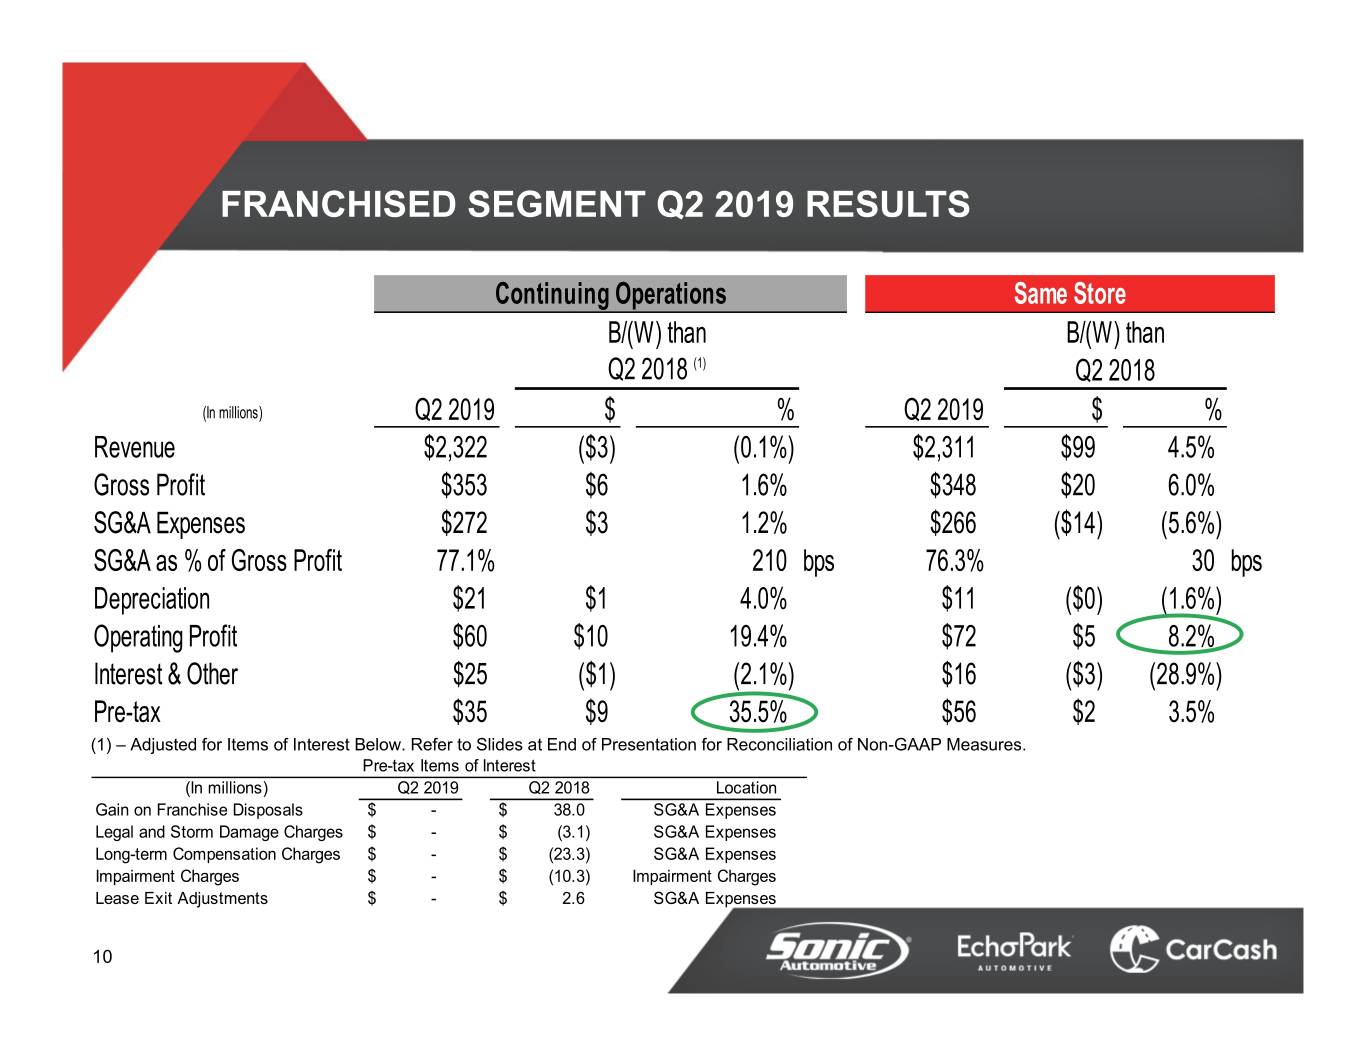
FRANCHISED SEGMENT Q2 2019 RESULTS Continuing Operations Same Store B/(W) than B/(W) than Q2 2018 (1) Q2 2018 (In millions) Q2 2019 $ % Q2 2019 $ % Revenue $2,322 ($3) (0.1%) $2,311 $99 4.5% Gross Profit $353 $6 1.6% $348 $20 6.0% SG&A Expenses $272 $3 1.2% $266 ($14) (5.6%) SG&A as % of Gross Profit 77.1% 210 bps 76.3% 30 bps Depreciation $21 $1 4.0% $11 ($0) (1.6%) Operating Profit $60 $10 19.4% $72 $5 8.2% Interest & Other $25 ($1) (2.1%) $16 ($3) (28.9%) Pre-tax $35 $9 35.5% $56 $2 3.5% (1) – Adjusted for Items of Interest Below. Refer to Slides at End of Presentation for Reconciliation of Non-GAAP Measures. Pre-tax Items of Interest (In millions) Q2 2019 Q2 2018 Location Gain on Franchise Disposals$ - $ 38.0 SG&A Expenses Legal and Storm Damage Charges$ - $ (3.1) SG&A Expenses Long-term Compensation Charges$ - $ (23.3) SG&A Expenses Impairment Charges$ - $ (10.3) Impairment Charges Lease Exit Adjustments$ - $ 2.6 SG&A Expenses 10
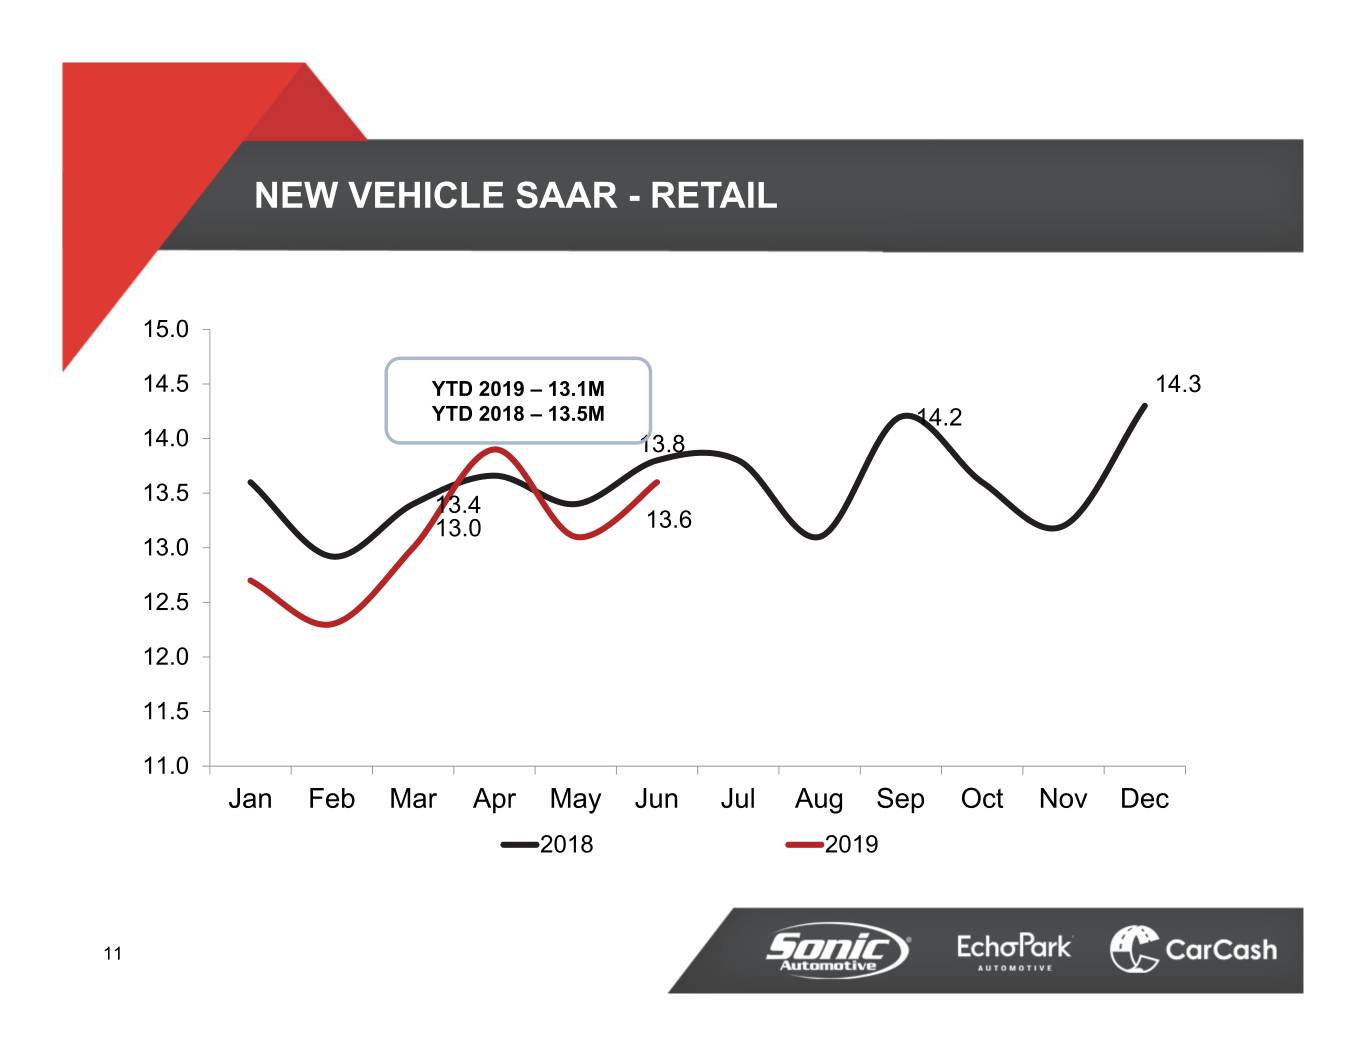
NEW VEHICLE SAAR - RETAIL 15.0 14.5 YTD 2019 – 13.1M 14.3 YTD 2018 – 13.5M 14.2 14.0 13.8 13.5 13.4 13.0 13.6 13.0 12.5 12.0 11.5 11.0 Jan Feb Mar Apr May Jun Jul Aug Sep Oct Nov Dec 2018 2019 11
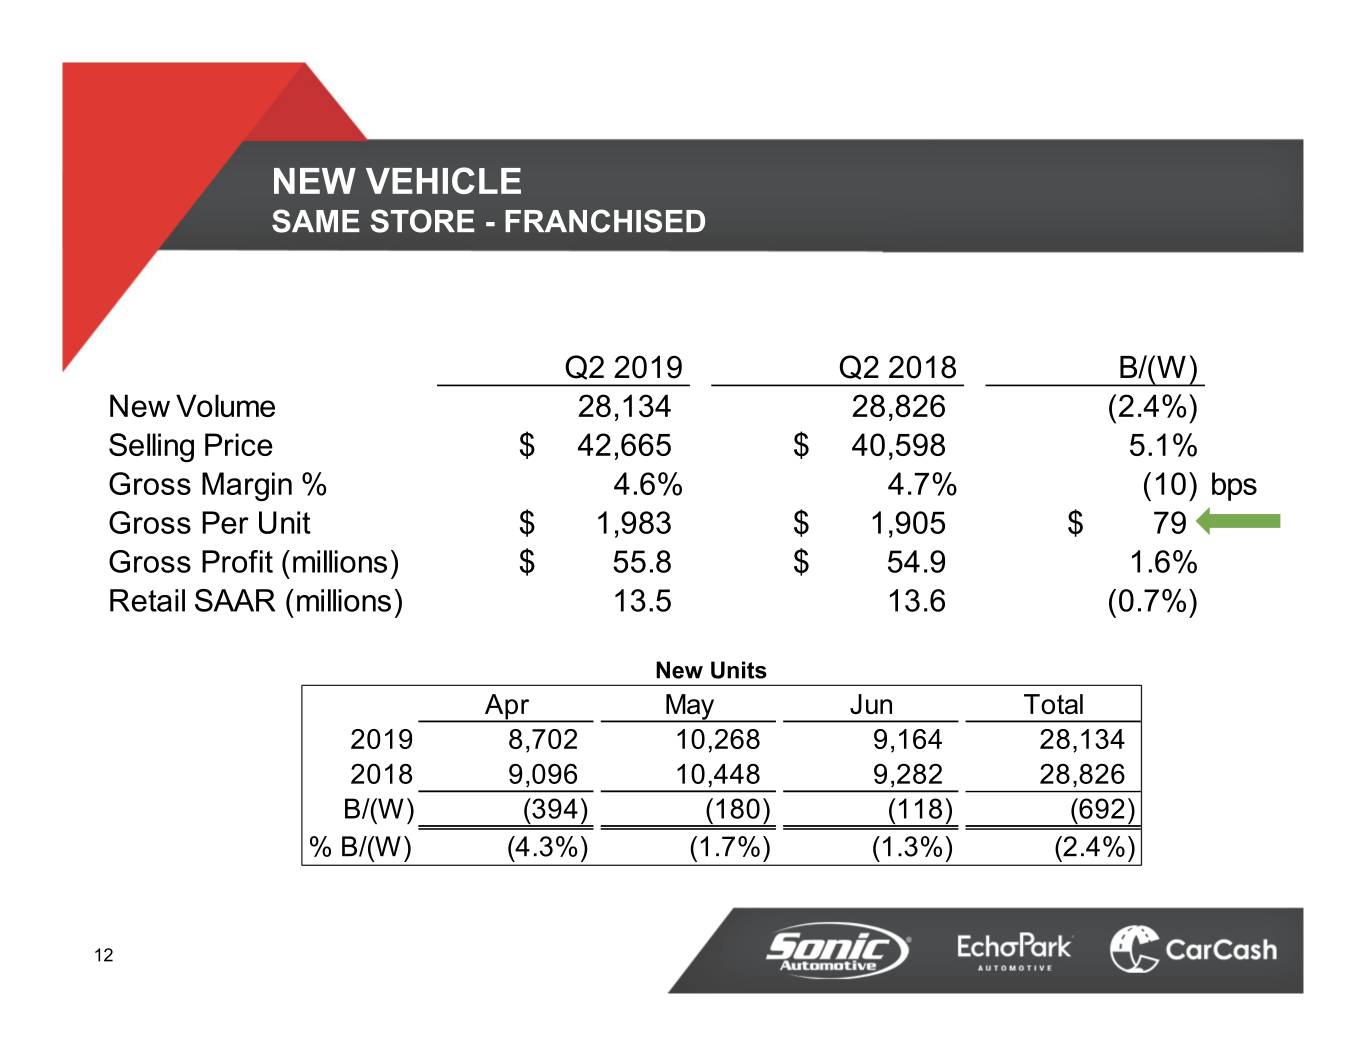
NEW VEHICLE SAME STORE - FRANCHISED Q2 2019 Q2 2018 B/(W) New Volume 28,134 28,826 (2.4%) Selling Price$ 42,665 $ 40,598 5.1% Gross Margin % 4.6% 4.7% (10) bps Gross Per Unit$ 1,983 $ 1,905 $ 79 Gross Profit (millions)$ 55.8 $ 54.9 1.6% Retail SAAR (millions) 13.5 13.6 (0.7%) New Units Apr May Jun Total 2019 8,702 10,268 9,164 28,134 2018 9,096 10,448 9,282 28,826 B/(W) (394) (180) (118) (692) % B/(W) (4.3%) (1.7%) (1.3%) (2.4%) 12
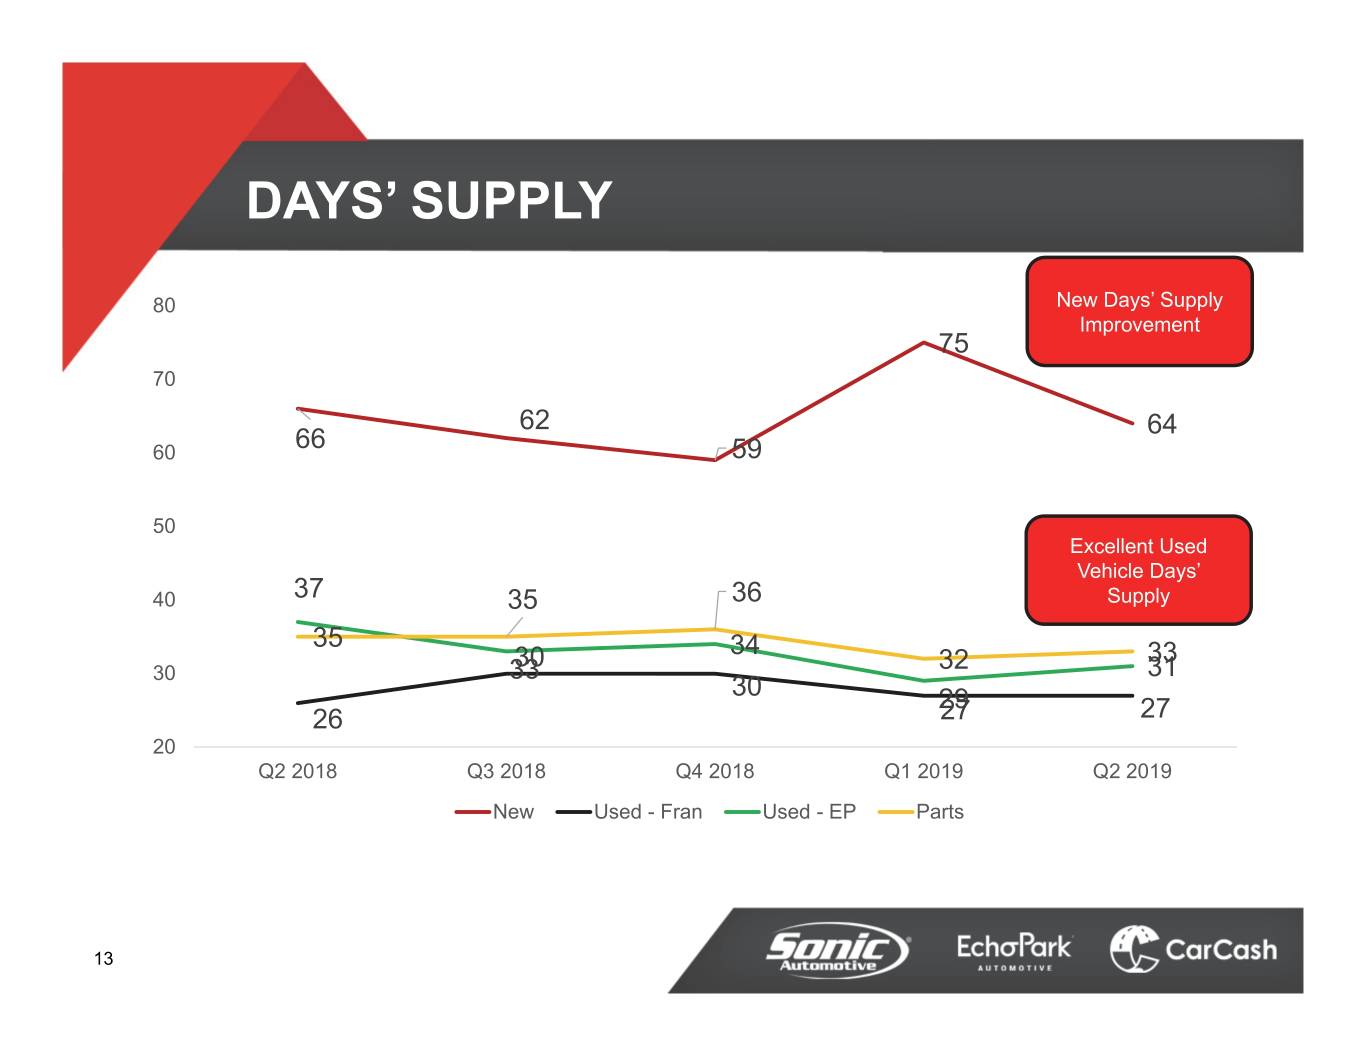
DAYS’ SUPPLY 80 New Days’ Supply Improvement 75 70 62 64 60 66 59 50 Excellent Used Vehicle Days’ 40 37 35 36 Supply 35 30 34 33 30 33 32 31 30 29 26 27 27 20 Q2 2018 Q3 2018 Q4 2018 Q1 2019 Q2 2019 New Used - Fran Used - EP Parts 13
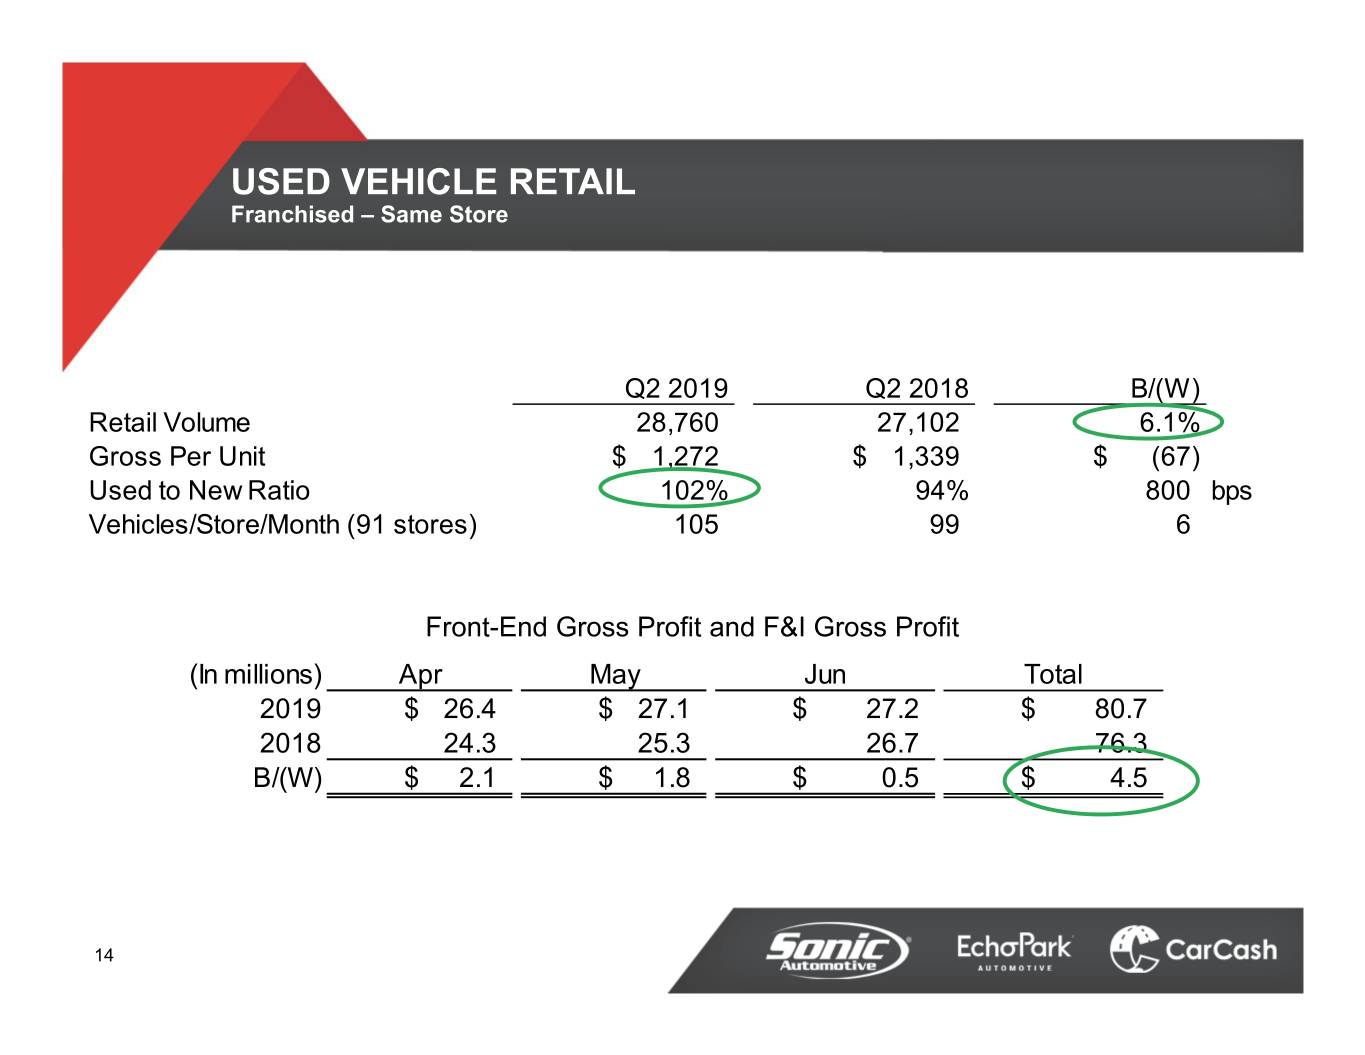
USED VEHICLE RETAIL Franchised – Same Store Q2 2019 Q2 2018 B/(W) Retail Volume 28,760 27,102 6.1% Gross Per Unit$ 1,272 $ 1,339 $ (67) Used to New Ratio 102% 94% 800 bps Vehicles/Store/Month (91 stores) 105 99 6 Front-End Gross Profit and F&I Gross Profit (In millions) Apr May Jun Total 2019$ 26.4 $ 27.1 $ 27.2 $ 80.7 2018 24.3 25.3 26.7 76.3 B/(W)$ 2.1 $ 1.8 $ 0.5 $ 4.5 14
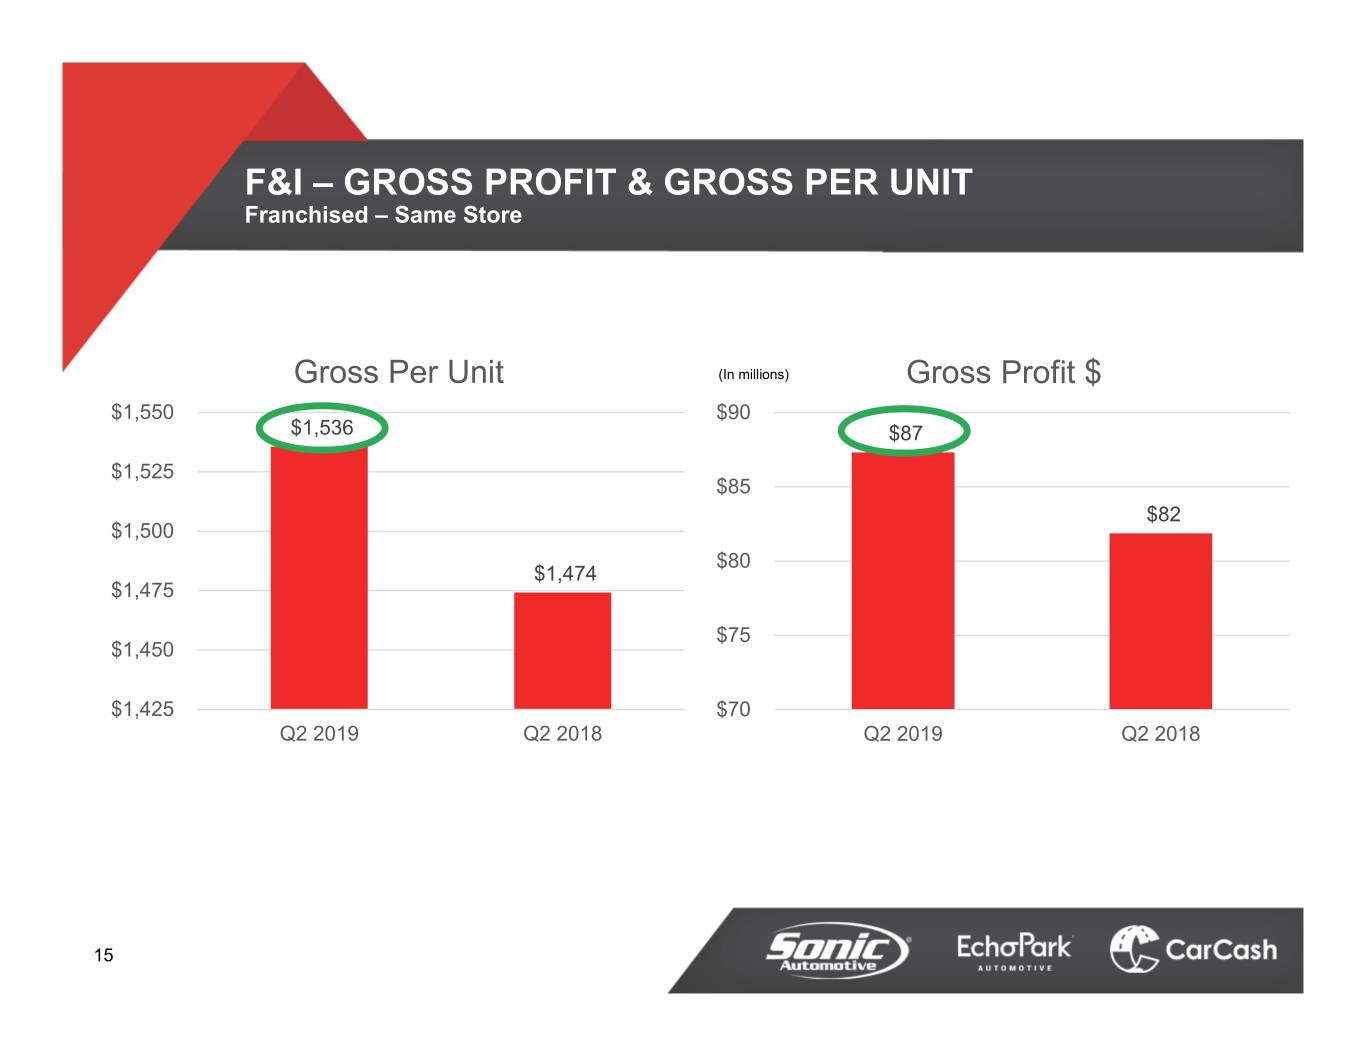
F&I – GROSS PROFIT & GROSS PER UNIT Franchised – Same Store Gross Per Unit (In millions) Gross Profit $ $1,550 $90 $1,536 $87 $1,525 $85 $82 $1,500 $80 $1,474 $1,475 $75 $1,450 $1,425 $70 Q2 2019 Q2 2018 Q2 2019 Q2 2018 15
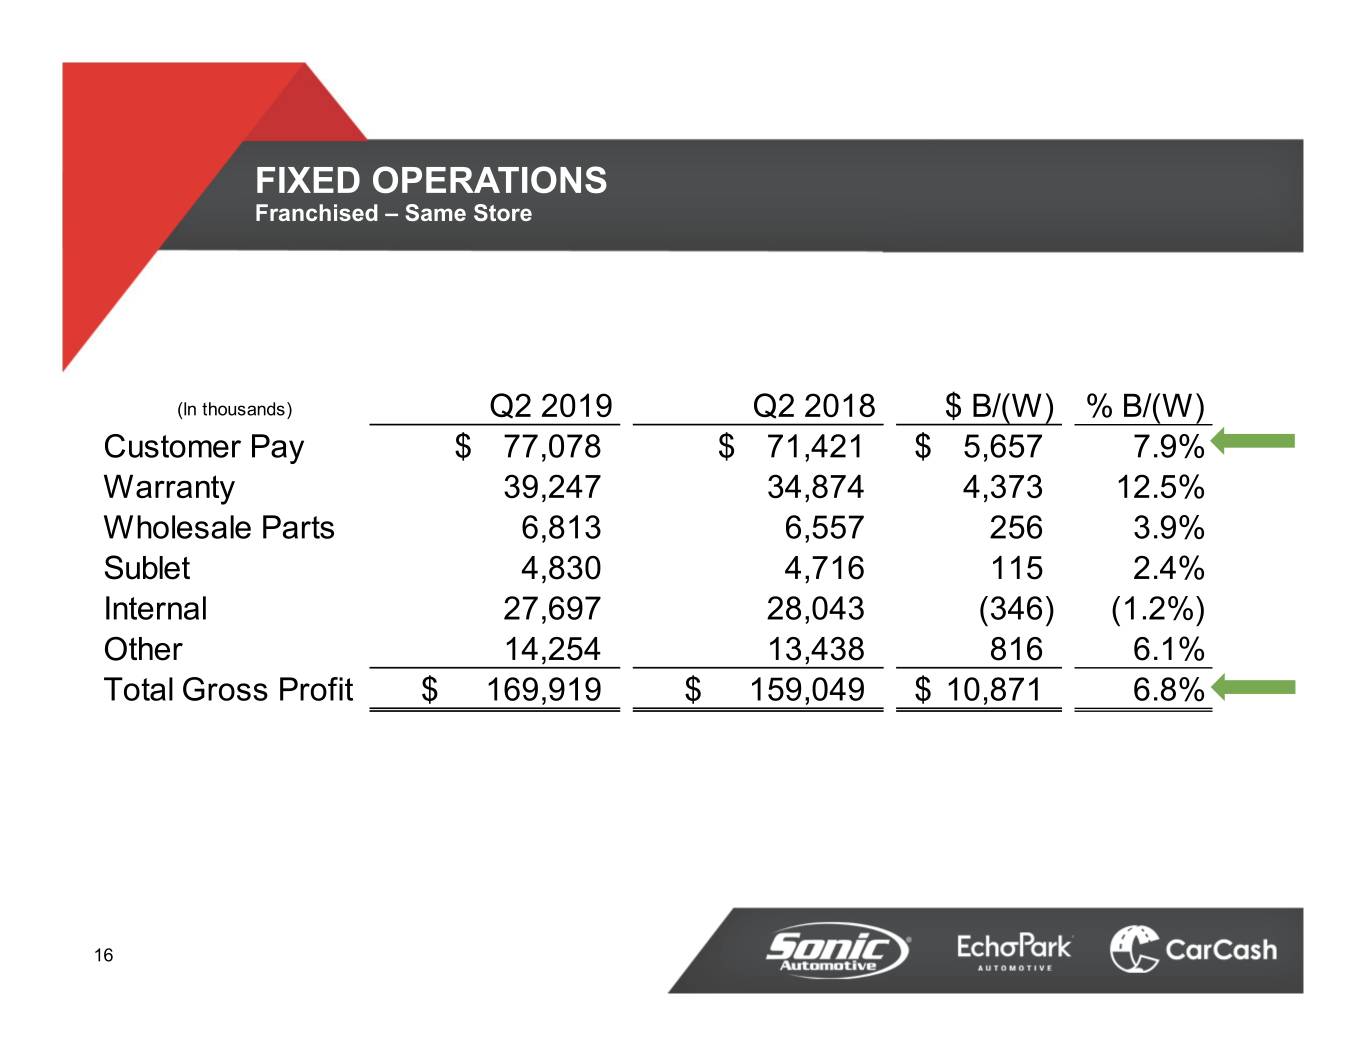
FIXED OPERATIONS Franchised – Same Store (In thousands) Q2 2019 Q2 2018 $ B/(W) % B/(W) Customer Pay$ 77,078 $ 71,421 $ 5,657 7.9% Warranty 39,247 34,874 4,373 12.5% Wholesale Parts 6,813 6,557 256 3.9% Sublet 4,830 4,716 115 2.4% Internal 27,697 28,043 (346) (1.2%) Other 14,254 13,438 816 6.1% Total Gross Profit$ 169,919 $ 159,049 $ 10,871 6.8% 16
Q2 2019 FINANCIAL REVIEW ECHOPARK SEGMENT 17
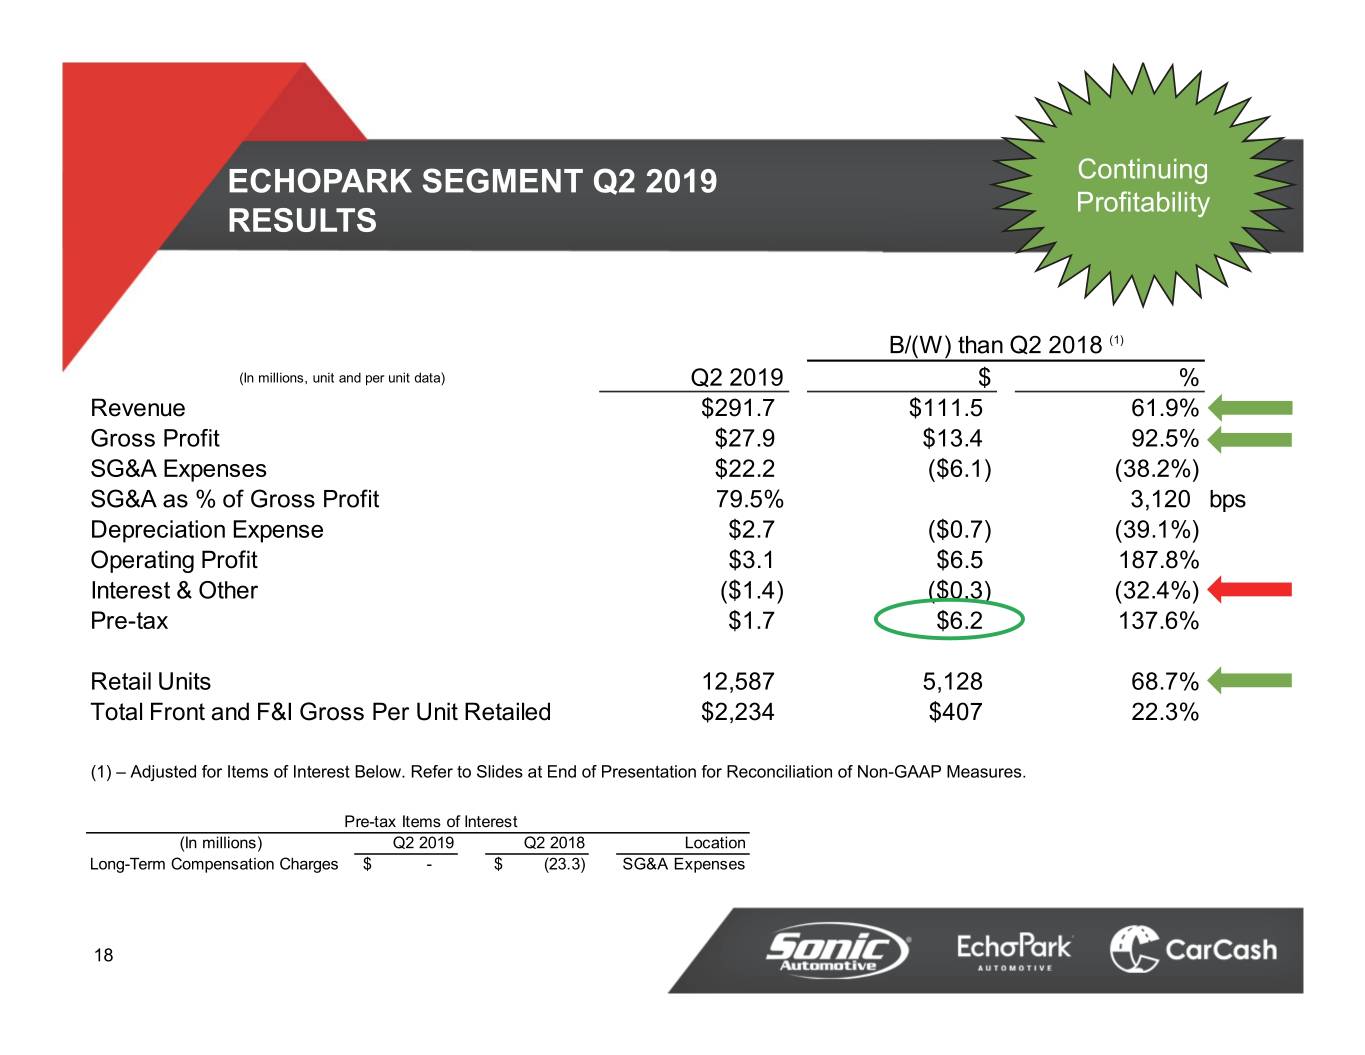
ECHOPARK SEGMENT Q2 2019 Continuing Profitability RESULTS B/(W) than Q2 2018 (1) (In millions, unit and per unit data) Q2 2019 $ % Revenue $291.7 $111.5 61.9% Gross Profit $27.9 $13.4 92.5% SG&A Expenses $22.2 ($6.1) (38.2%) SG&A as % of Gross Profit 79.5% 3,120 bps Depreciation Expense $2.7 ($0.7) (39.1%) Operating Profit $3.1 $6.5 187.8% Interest & Other ($1.4) ($0.3) (32.4%) Pre-tax $1.7 $6.2 137.6% Retail Units 12,587 5,128 68.7% Total Front and F&I Gross Per Unit Retailed $2,234 $407 22.3% (1) – Adjusted for Items of Interest Below. Refer to Slides at End of Presentation for Reconciliation of Non-GAAP Measures. Pre-tax Items of Interest (In millions) Q2 2019 Q2 2018 Location Long-Term Compensation Charges$ - $ (23.3) SG&A Expenses 18
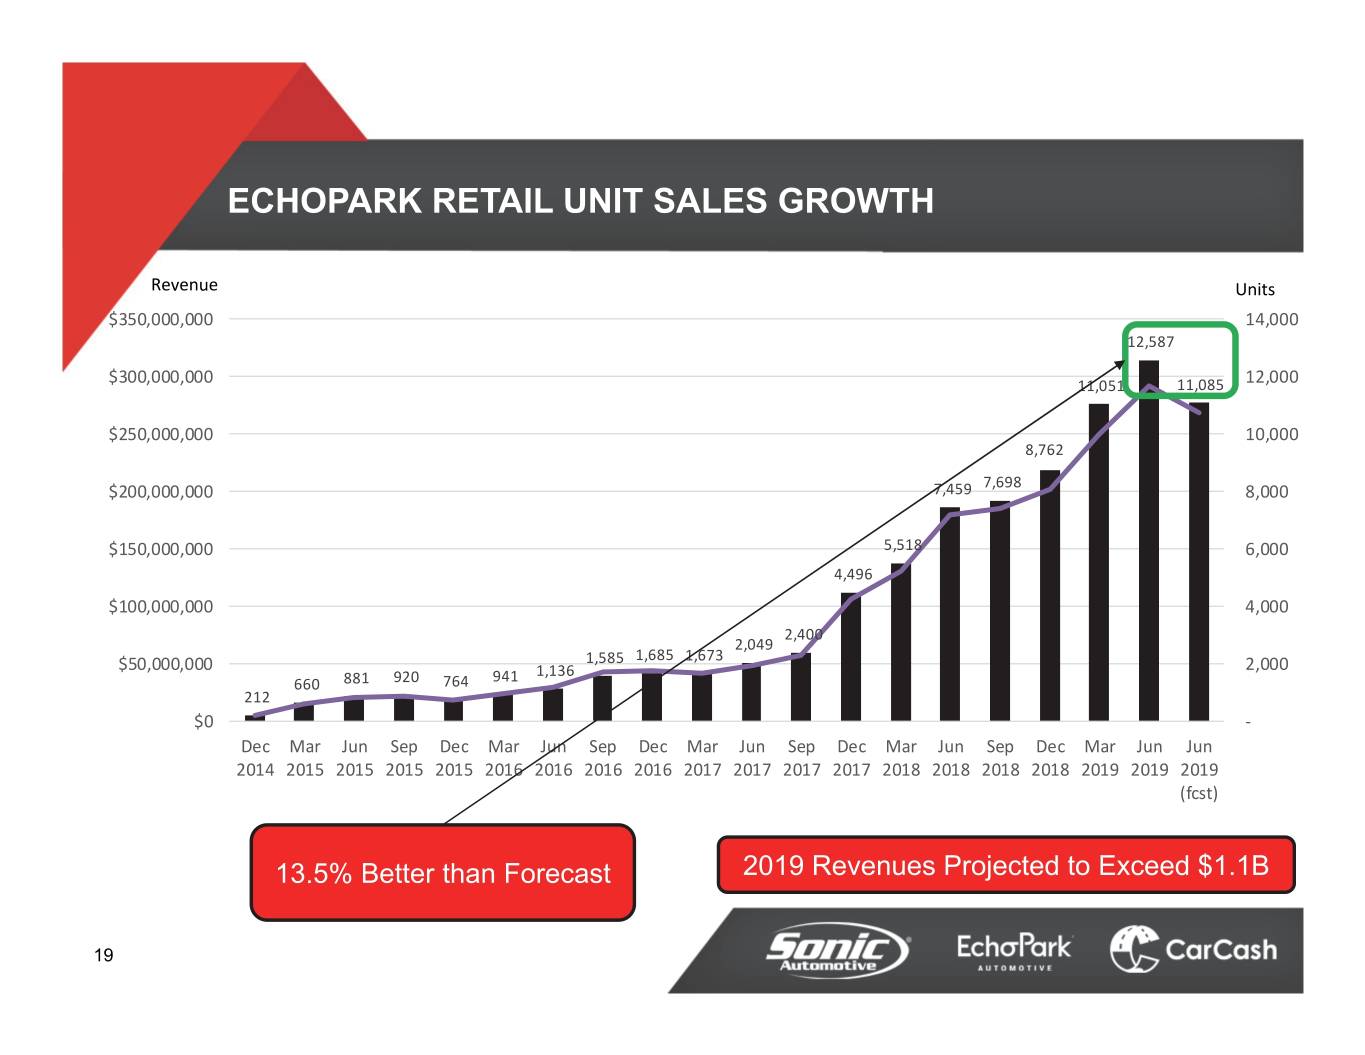
ECHOPARK RETAIL UNIT SALES GROWTH Revenue Units $350,000,000 14,000 12,587 $300,000,000 11,051 11,085 12,000 $250,000,000 10,000 8,762 7,698 $200,000,000 7,459 8,000 $150,000,000 5,518 6,000 4,496 $100,000,000 4,000 2,400 2,049 1,585 1,685 1,673 $50,000,000 1,136 2,000 660 881 920 764 941 212 $0 ‐ Dec Mar Jun Sep Dec Mar Jun Sep Dec Mar Jun Sep Dec Mar Jun Sep Dec Mar Jun Jun 2014 2015 2015 2015 2015 2016 2016 2016 2016 2017 2017 2017 2017 2018 2018 2018 2018 2019 2019 2019 (fcst) 13.5% Better than Forecast 2019 Revenues Projected to Exceed $1.1B 19
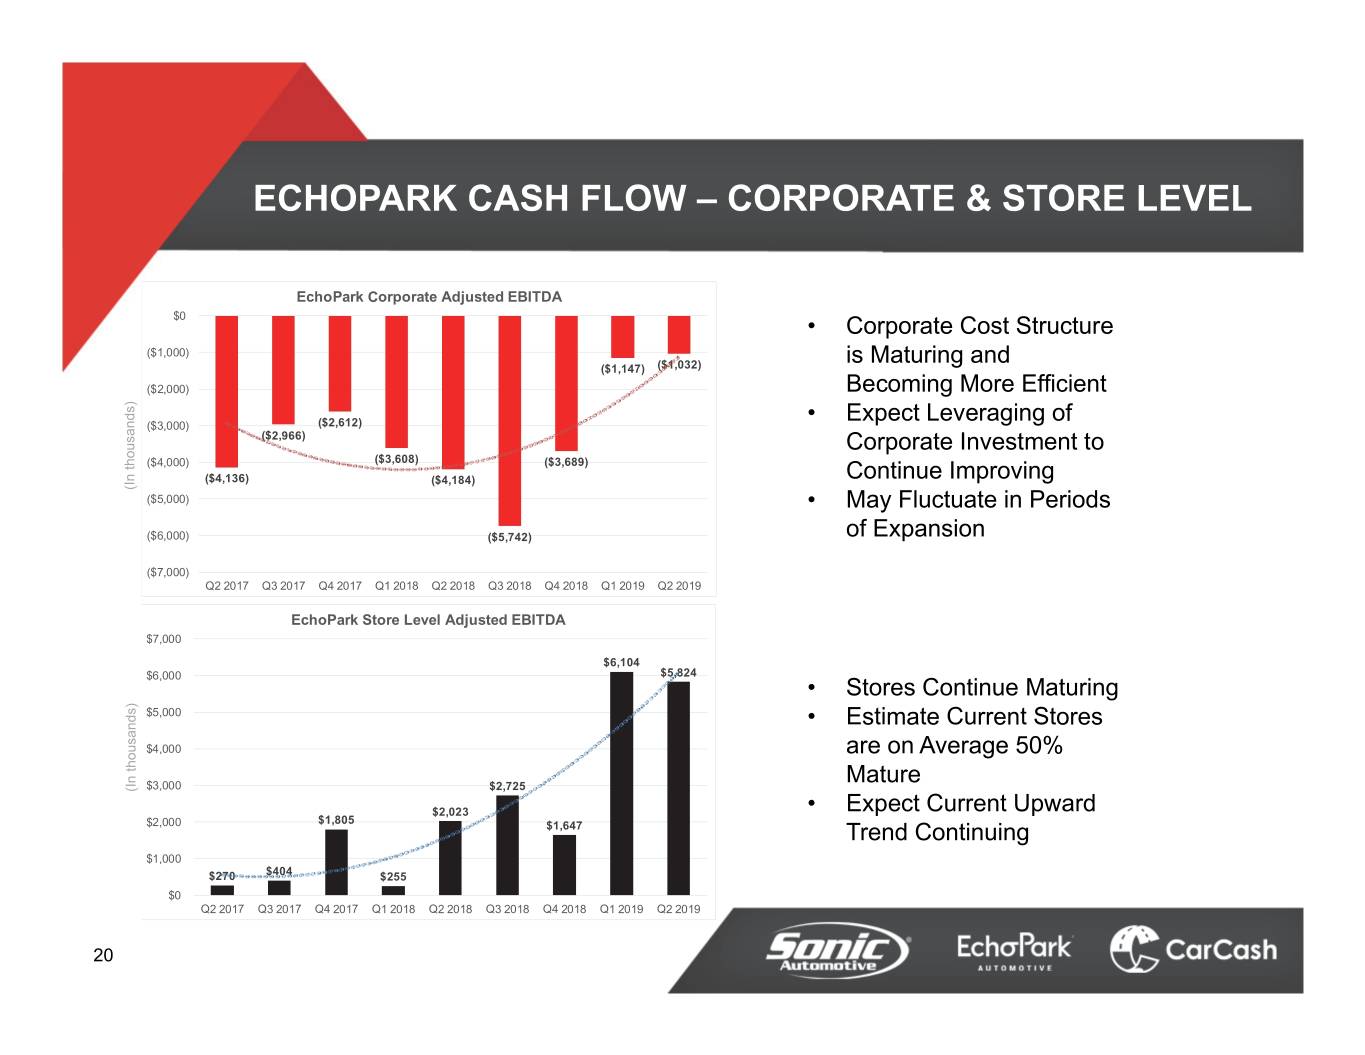
ECHOPARK CASH FLOW – CORPORATE & STORE LEVEL EchoPark Corporate Adjusted EBITDA $0 • Corporate Cost Structure ($1,000) is Maturing and ($1,147) ($1,032) ($2,000) Becoming More Efficient • Expect Leveraging of ($3,000) ($2,612) ($2,966) Corporate Investment to ($4,000) ($3,608) ($3,689) ($4,136) ($4,184) Continue Improving (In thousands) ($5,000) • May Fluctuate in Periods ($6,000) ($5,742) of Expansion ($7,000) Q2 2017 Q3 2017 Q4 2017 Q1 2018 Q2 2018 Q3 2018 Q4 2018 Q1 2019 Q2 2019 EchoPark Store Level Adjusted EBITDA $7,000 $6,104 $6,000 $5,824 • Stores Continue Maturing $5,000 • Estimate Current Stores $4,000 are on Average 50% $3,000 Mature (In thousands) $2,725 $2,023 • Expect Current Upward $1,805 $2,000 $1,647 Trend Continuing $1,000 $270 $404 $255 $0 Q2 2017 Q3 2017 Q4 2017 Q1 2018 Q2 2018 Q3 2018 Q4 2018 Q1 2019 Q2 2019 20
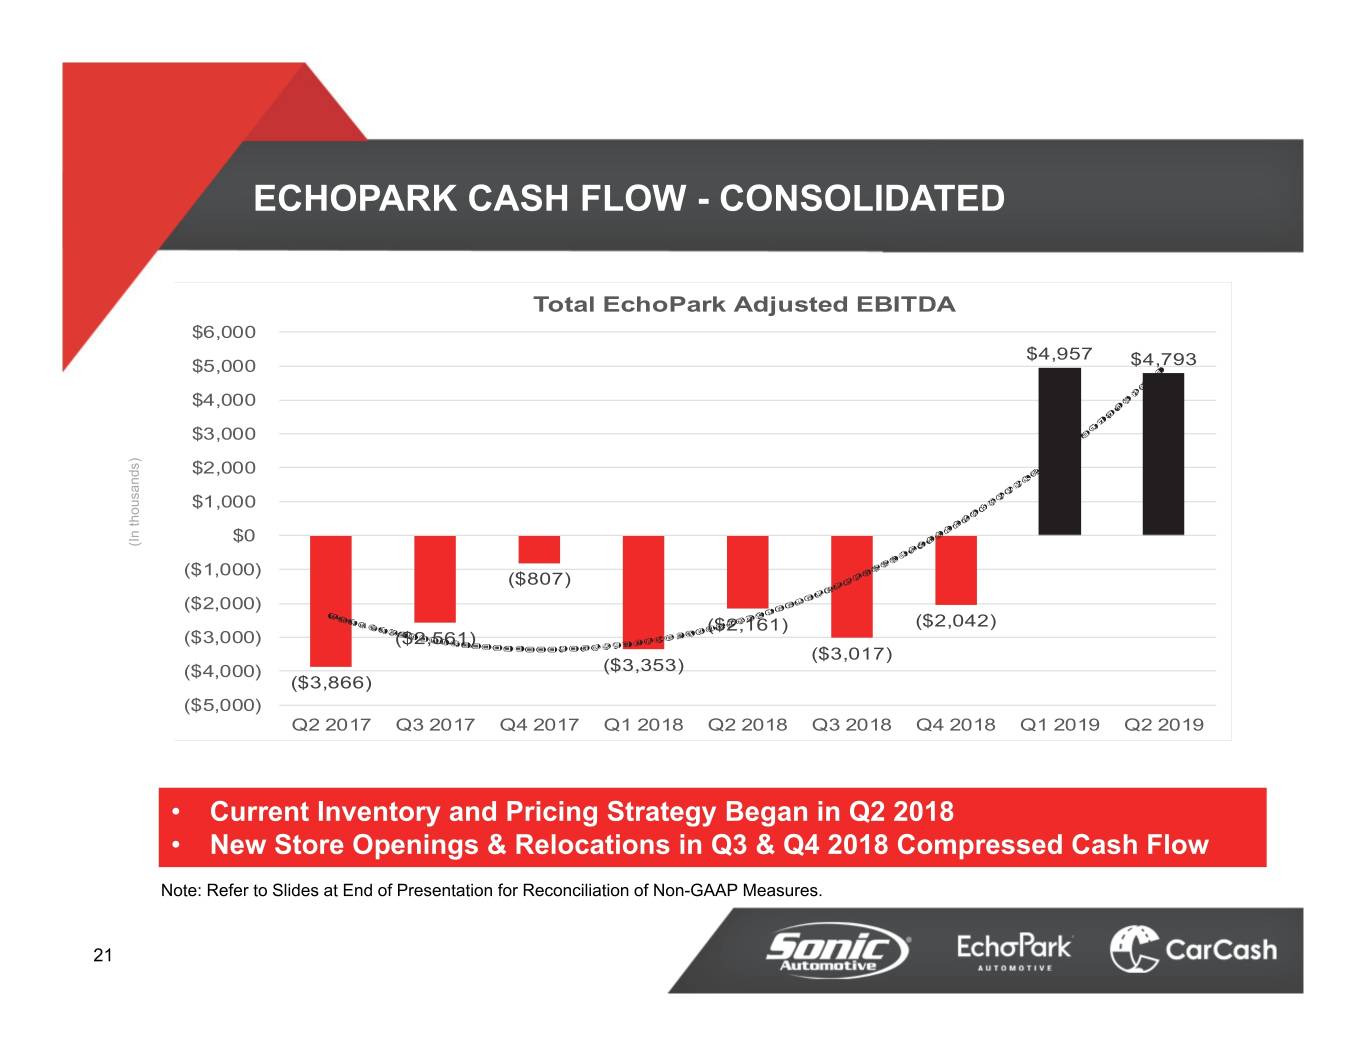
ECHOPARK CASH FLOW - CONSOLIDATED $6,000 $5,000 $4,957 $4,793 Total EchoPark Adjusted EBITDA $4,000 $3,000 $2,000 $1,000 $0 ($1,000) (In thousands) ($807) ($2,000) ($2,161) ($2,042) ($3,000) ($2,561) ($3,017) ($4,000) ($3,353) ($3,866) ($5,000) Q2 2017 Q3 2017 Q4 2017 Q1 2018 Q2 2018 Q3 2018 Q4 2018 Q1 2019 Q2 2019 • Current Inventory and Pricing Strategy Began in Q2 2018 • New Store Openings & Relocations in Q3 & Q4 2018 Compressed Cash Flow Note: Refer to Slides at End of Presentation for Reconciliation of Non-GAAP Measures. 21
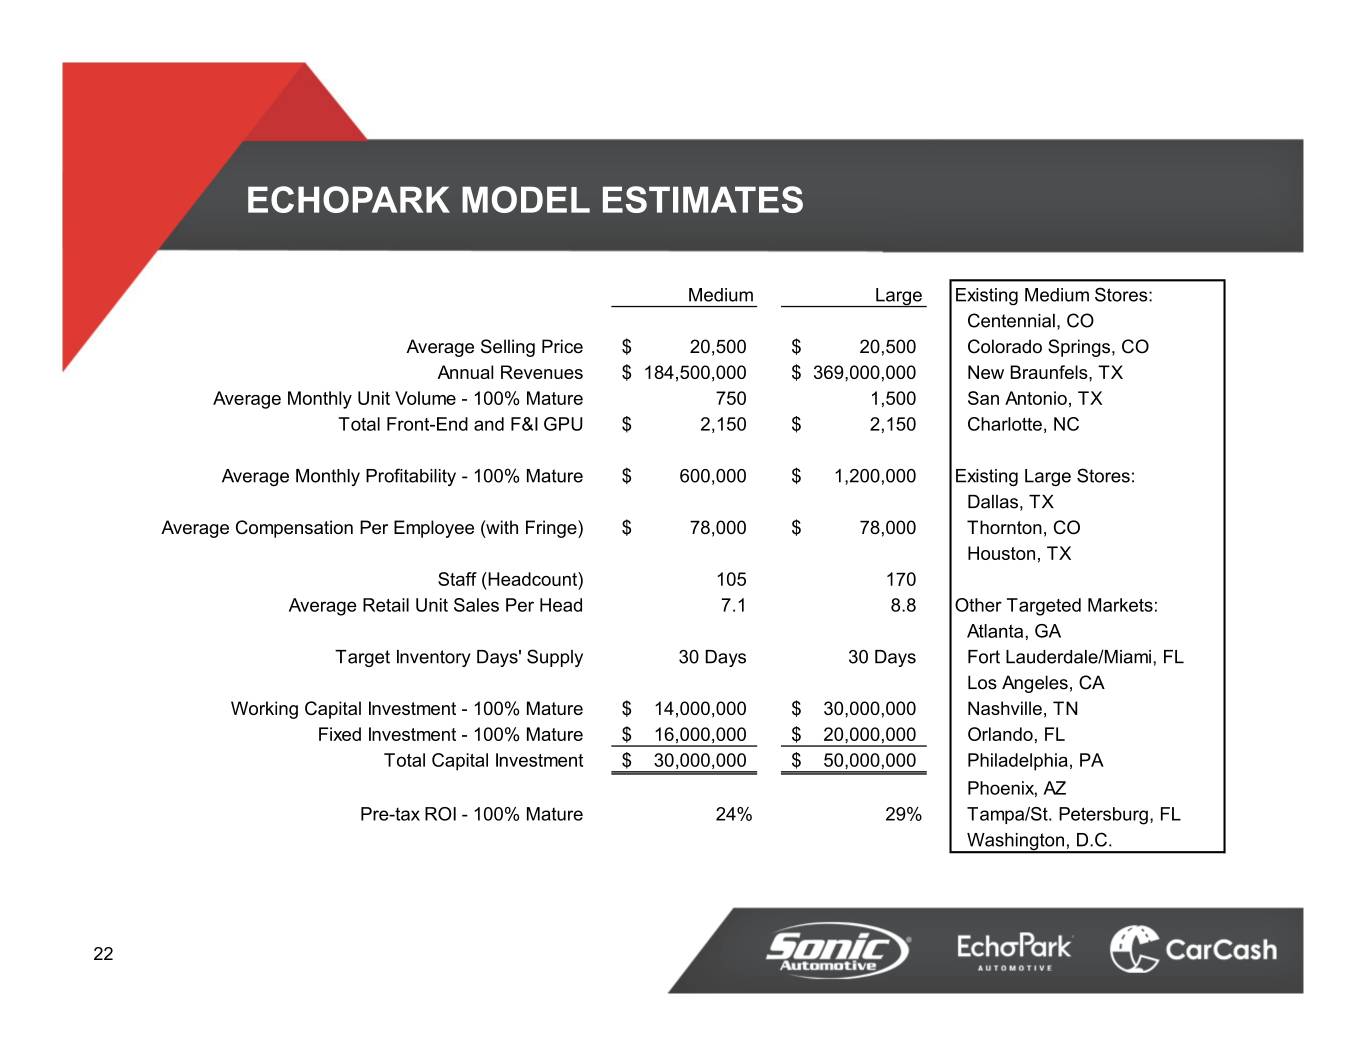
ECHOPARK MODEL ESTIMATES Medium Large Existing Medium Stores: Centennial, CO Average Selling Price$ 20,500 $ 20,500 Colorado Springs, CO Annual Revenues$ 184,500,000 $ 369,000,000 New Braunfels, TX Average Monthly Unit Volume - 100% Mature 750 1,500 San Antonio, TX Total Front-End and F&I GPU$ 2,150 $ 2,150 Charlotte, NC Average Monthly Profitability - 100% Mature$ 600,000 $ 1,200,000 Existing Large Stores: Dallas, TX Average Compensation Per Employee (with Fringe)$ 78,000 $ 78,000 Thornton, CO Houston, TX Staff (Headcount) 105 170 Average Retail Unit Sales Per Head 7.1 8.8 Other Targeted Markets: Atlanta, GA Target Inventory Days' Supply 30 Days 30 Days Fort Lauderdale/Miami, FL Los Angeles, CA Working Capital Investment - 100% Mature$ 14,000,000 $ 30,000,000 Nashville, TN Fixed Investment - 100% Mature$ 16,000,000 $ 20,000,000 Orlando, FL Total Capital Investment$ 30,000,000 $ 50,000,000 Philadelphia, PA Phoenix, AZ Pre-tax ROI - 100% Mature 24% 29% Tampa/St. Petersburg, FL Washington, D.C. 22
Q2 2019 FINANCIAL REVIEW CONSOLIDATED 23
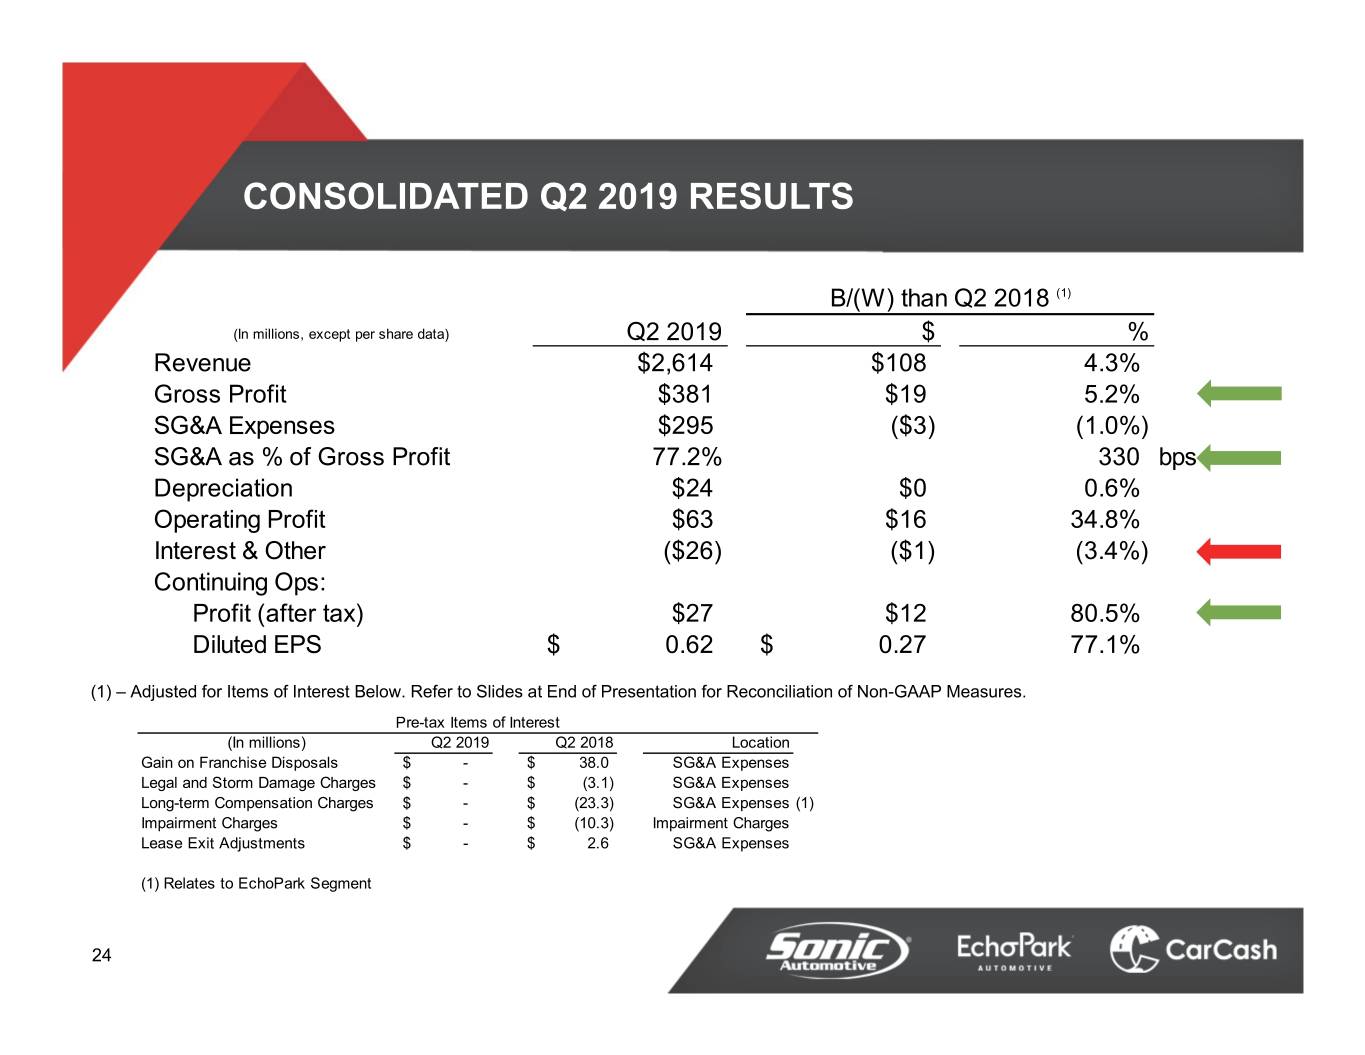
CONSOLIDATED Q2 2019 RESULTS B/(W) than Q2 2018 (1) (In millions, except per share data) Q2 2019 $ % Revenue $2,614 $108 4.3% Gross Profit $381 $19 5.2% SG&A Expenses $295 ($3) (1.0%) SG&A as % of Gross Profit 77.2% 330 bps Depreciation $24 $0 0.6% Operating Profit $63 $16 34.8% Interest & Other ($26) ($1) (3.4%) Continuing Ops: Profit (after tax) $27 $12 80.5% Diluted EPS $ 0.62 $ 0.27 77.1% (1) – Adjusted for Items of Interest Below. Refer to Slides at End of Presentation for Reconciliation of Non-GAAP Measures. Pre-tax Items of Interest (In millions) Q2 2019 Q2 2018 Location Gain on Franchise Disposals$ - $ 38.0 SG&A Expenses Legal and Storm Damage Charges $ - $ (3.1) SG&A Expenses Long-term Compensation Charges$ - $ (23.3) SG&A Expenses (1) Impairment Charges$ - $ (10.3) Impairment Charges Lease Exit Adjustments$ - $ 2.6 SG&A Expenses (1) Relates to EchoPark Segment 24
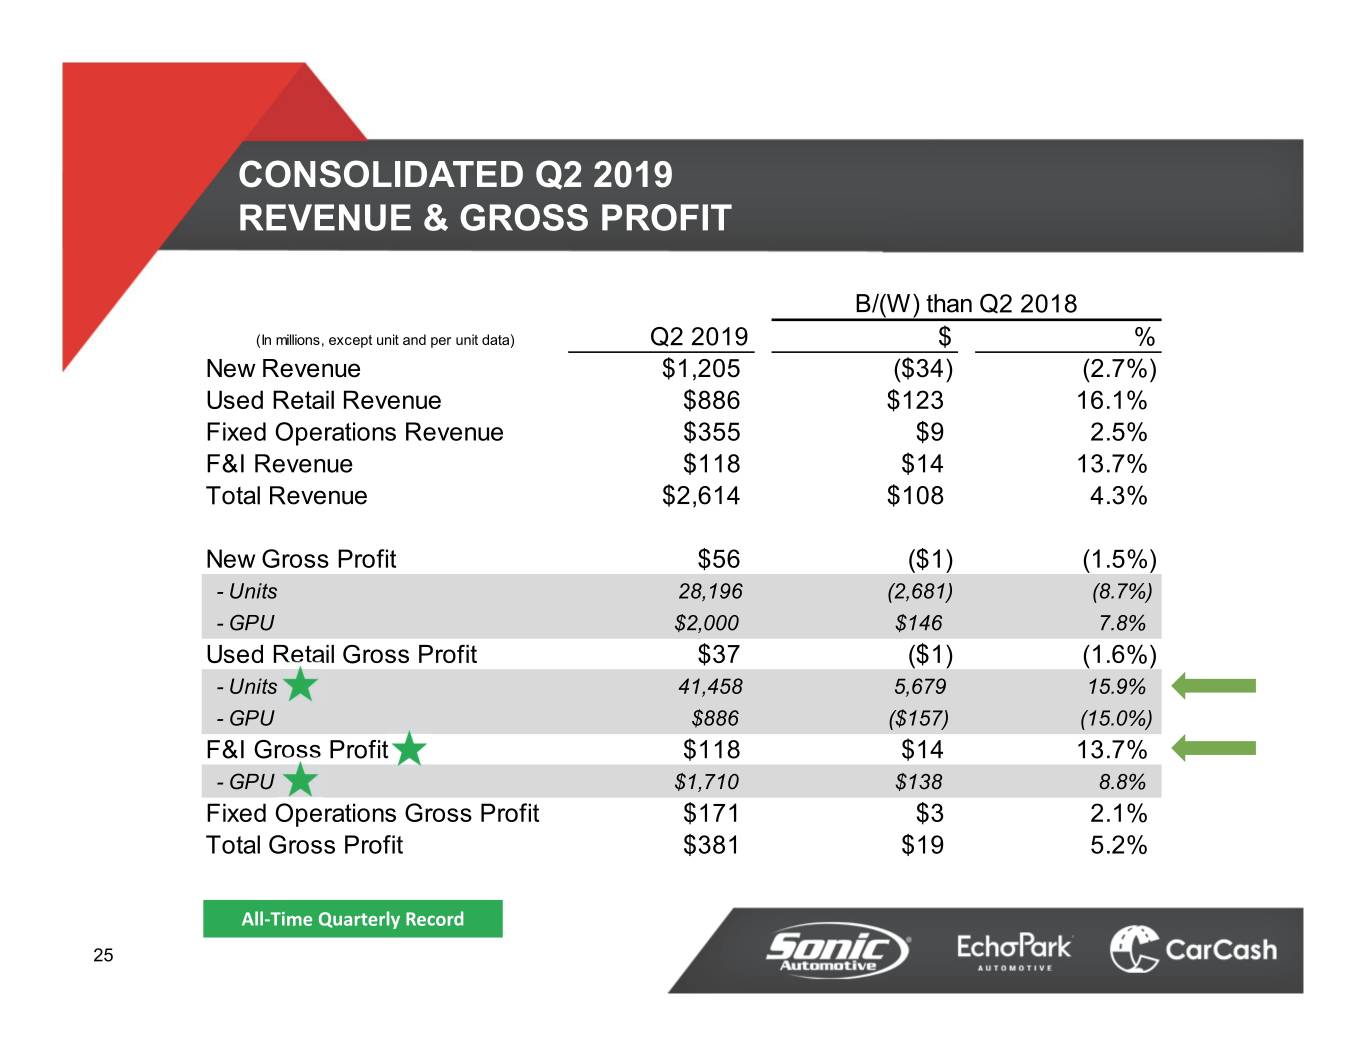
CONSOLIDATED Q2 2019 REVENUE & GROSS PROFIT B/(W) than Q2 2018 (In millions, except unit and per unit data) Q2 2019 $ % New Revenue $1,205 ($34) (2.7%) Used Retail Revenue $886 $123 16.1% Fixed Operations Revenue $355 $9 2.5% F&I Revenue $118 $14 13.7% Total Revenue $2,614 $108 4.3% New Gross Profit $56 ($1) (1.5%) - Units 28,196 (2,681) (8.7%) - GPU $2,000 $146 7.8% Used Retail Gross Profit $37 ($1) (1.6%) - Units 41,458 5,679 15.9% - GPU $886 ($157) (15.0%) F&I Gross Profit $118 $14 13.7% - GPU $1,710 $138 8.8% Fixed Operations Gross Profit $171 $3 2.1% Total Gross Profit $381 $19 5.2% All‐Time Quarterly Record 25
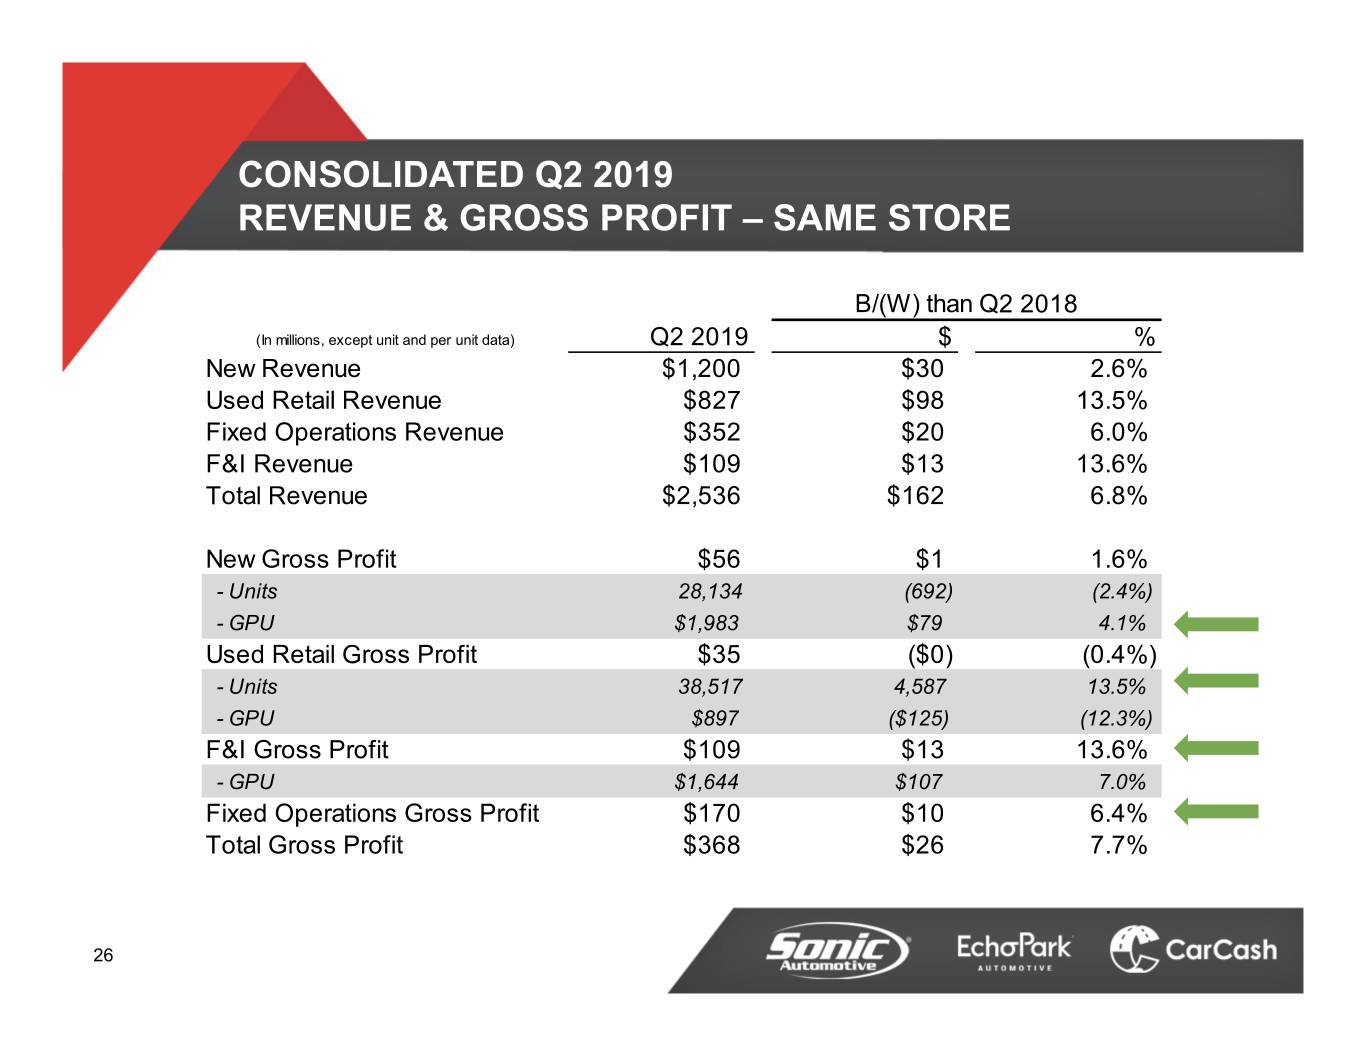
CONSOLIDATED Q2 2019 REVENUE & GROSS PROFIT – SAME STORE B/(W) than Q2 2018 (In millions, except unit and per unit data) Q2 2019 $ % New Revenue $1,200 $30 2.6% Used Retail Revenue $827 $98 13.5% Fixed Operations Revenue $352 $20 6.0% F&I Revenue $109 $13 13.6% Total Revenue $2,536 $162 6.8% New Gross Profit $56 $1 1.6% - Units 28,134 (692) (2.4%) - GPU $1,983 $79 4.1% Used Retail Gross Profit $35 ($0) (0.4%) - Units 38,517 4,587 13.5% - GPU $897 ($125) (12.3%) F&I Gross Profit $109 $13 13.6% - GPU $1,644 $107 7.0% Fixed Operations Gross Profit $170 $10 6.4% Total Gross Profit $368 $26 7.7% 26
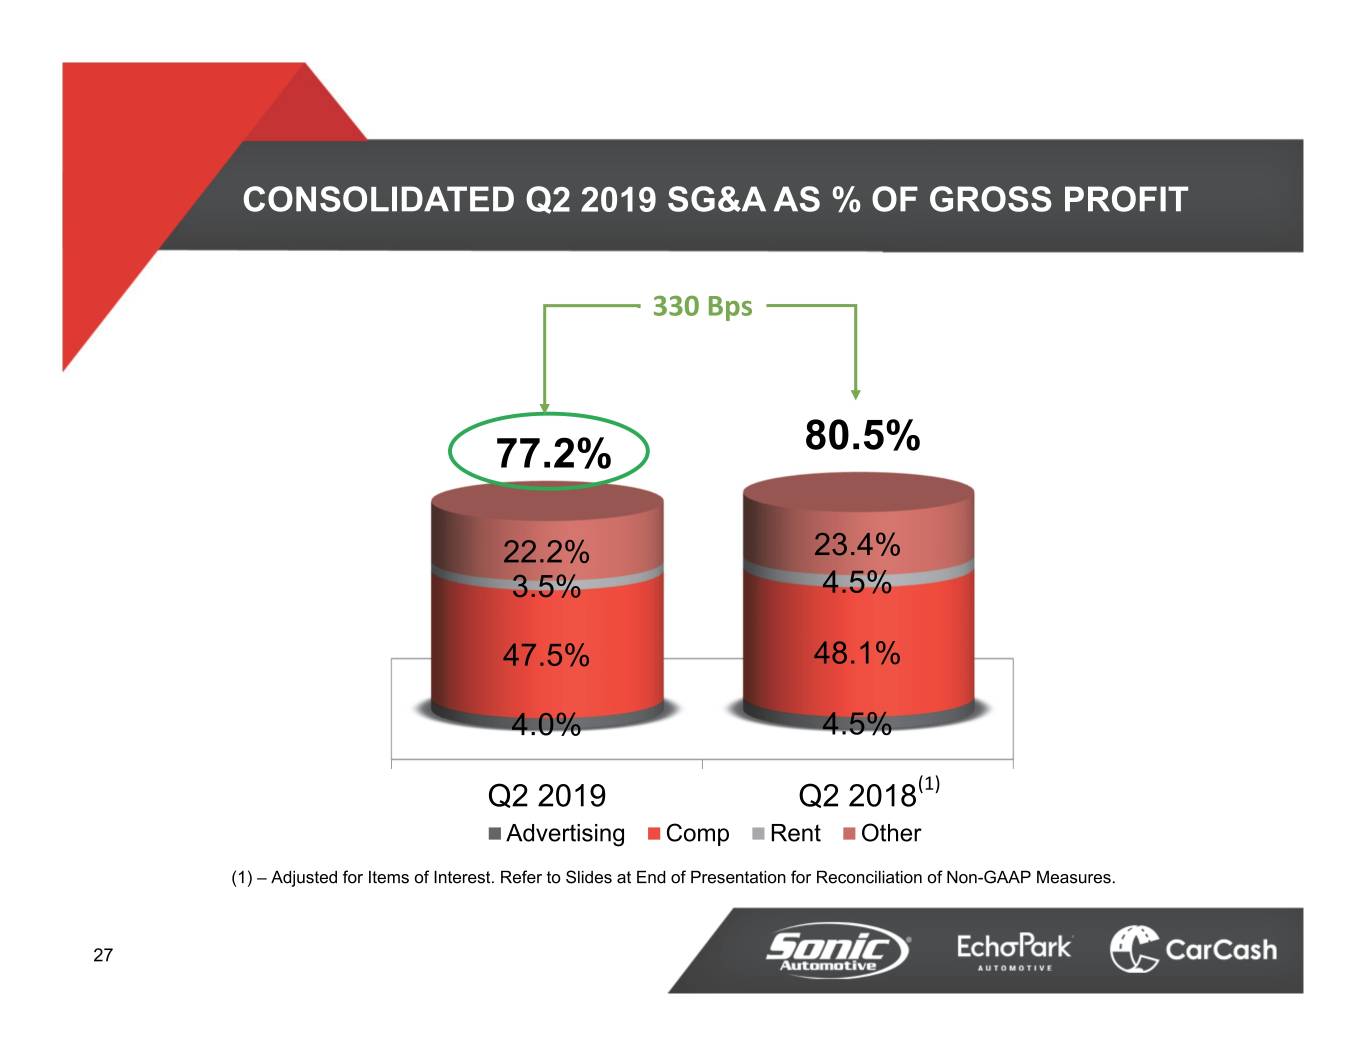
CONSOLIDATED Q2 2019 SG&A AS % OF GROSS PROFIT 330 Bps 77.2% 80.5% 22.2% 23.4% 3.5% 4.5% 47.5% 48.1% 4.0% 4.5% Q2 2019 Q2 2018(1) Advertising Comp Rent Other (1) – Adjusted for Items of Interest. Refer to Slides at End of Presentation for Reconciliation of Non-GAAP Measures. 27
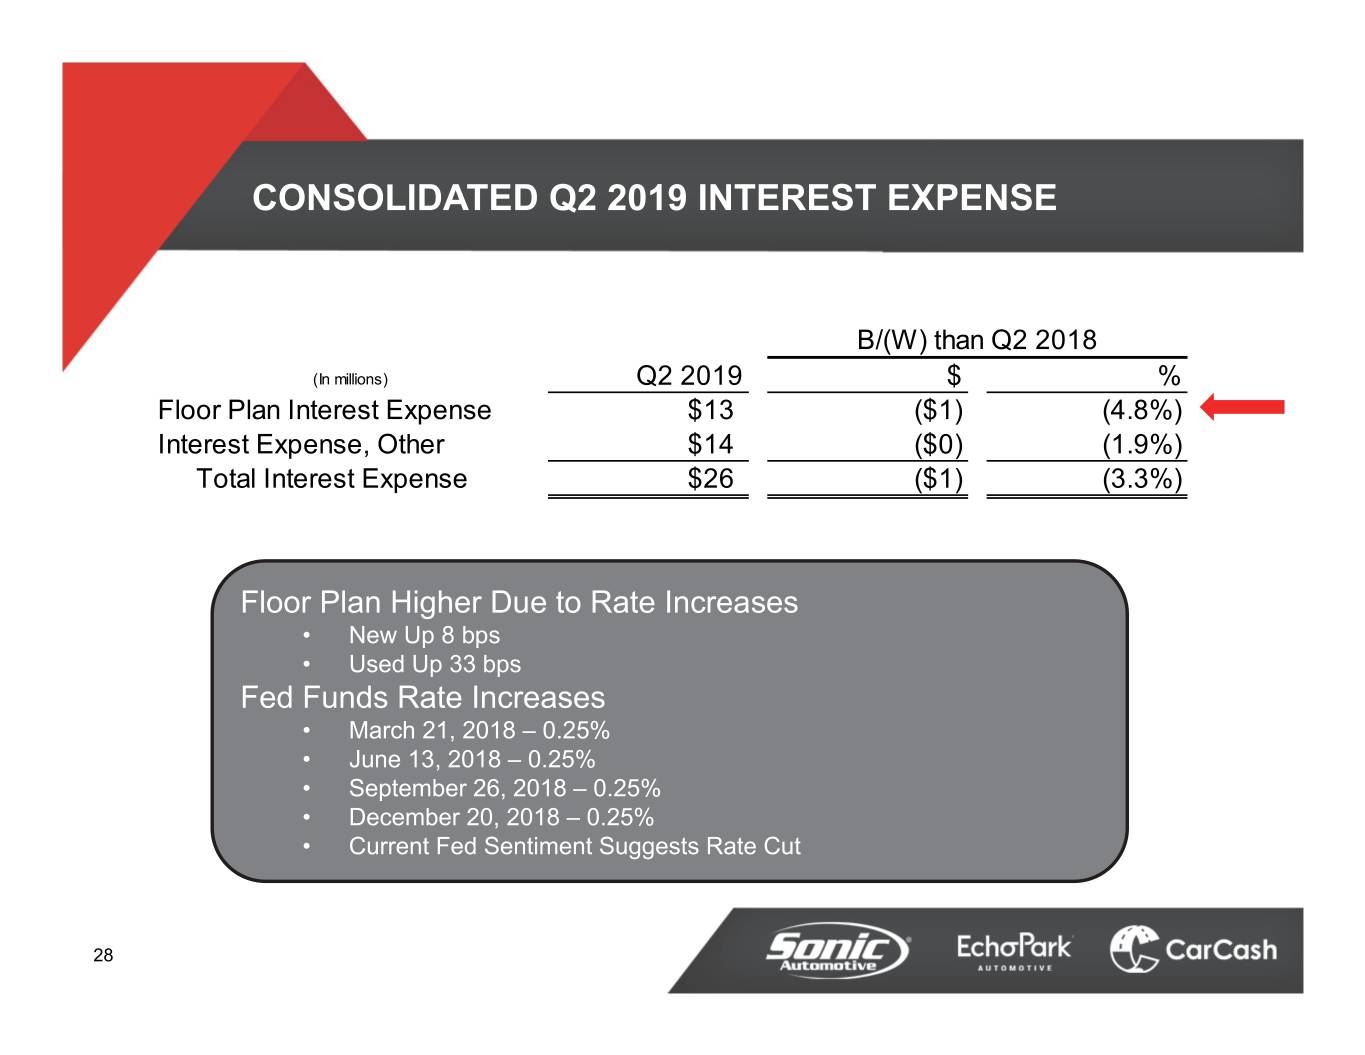
CONSOLIDATED Q2 2019 INTEREST EXPENSE B/(W) than Q2 2018 (In millions) Q2 2019 $ % Floor Plan Interest Expense $13 ($1) (4.8%) Interest Expense, Other $14 ($0) (1.9%) Total Interest Expense $26 ($1) (3.3%) Floor Plan Higher Due to Rate Increases • New Up 8 bps • Used Up 33 bps Fed Funds Rate Increases • March 21, 2018 – 0.25% • June 13, 2018 – 0.25% • September 26, 2018 – 0.25% • December 20, 2018 – 0.25% • Current Fed Sentiment Suggests Rate Cut 28
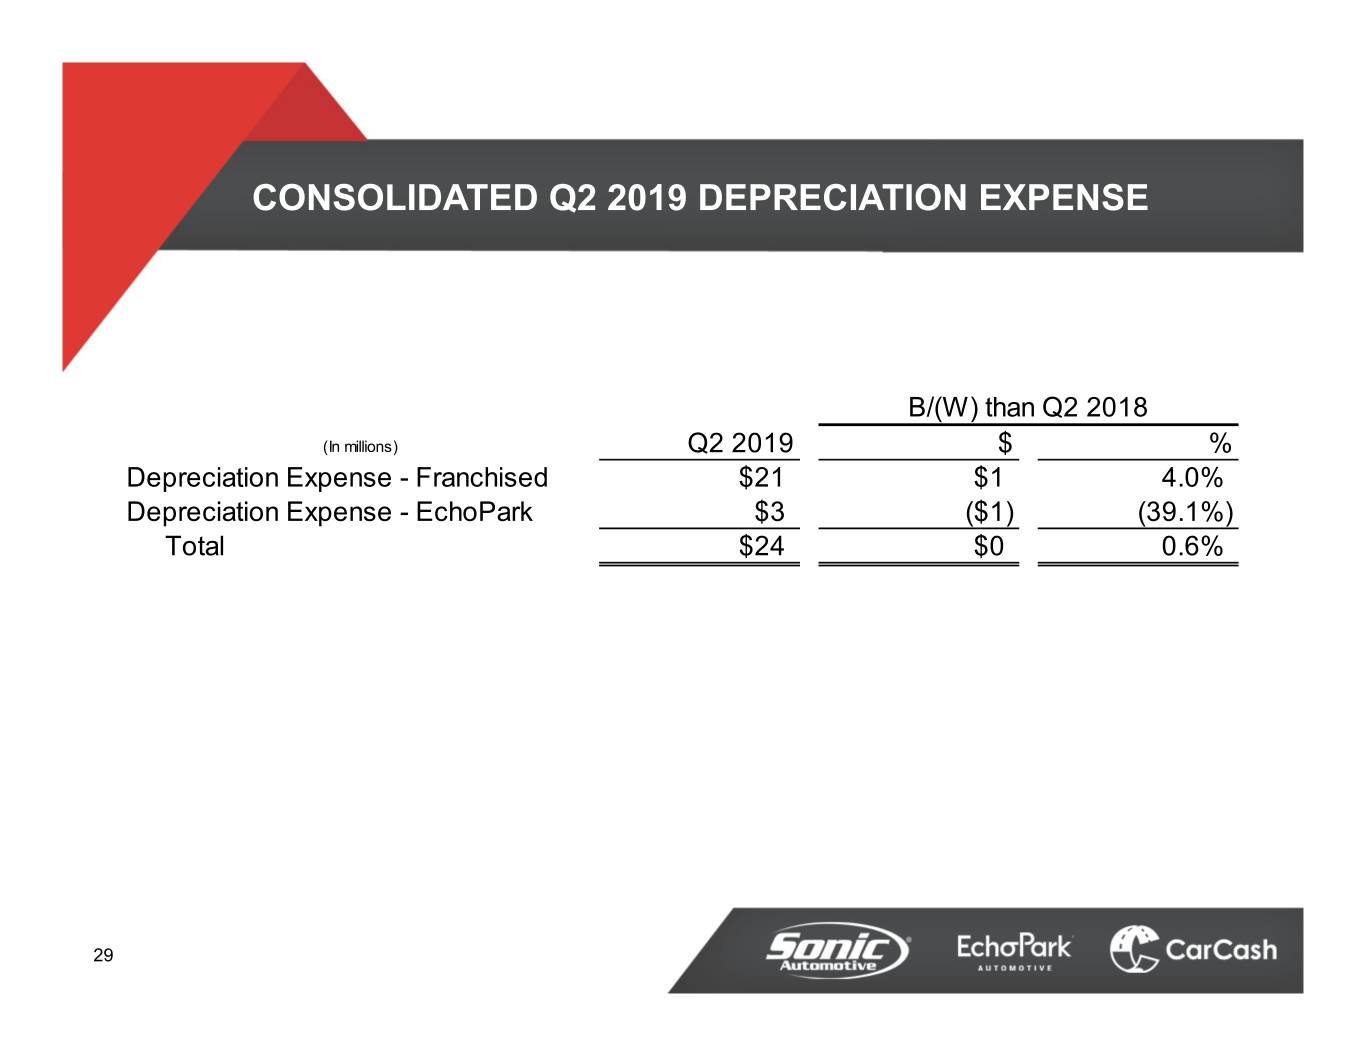
CONSOLIDATED Q2 2019 DEPRECIATION EXPENSE B/(W) than Q2 2018 (In millions) Q2 2019 $ % Depreciation Expense - Franchised $21 $1 4.0% Depreciation Expense - EchoPark $3 ($1) (39.1%) Total $24 $0 0.6% 29
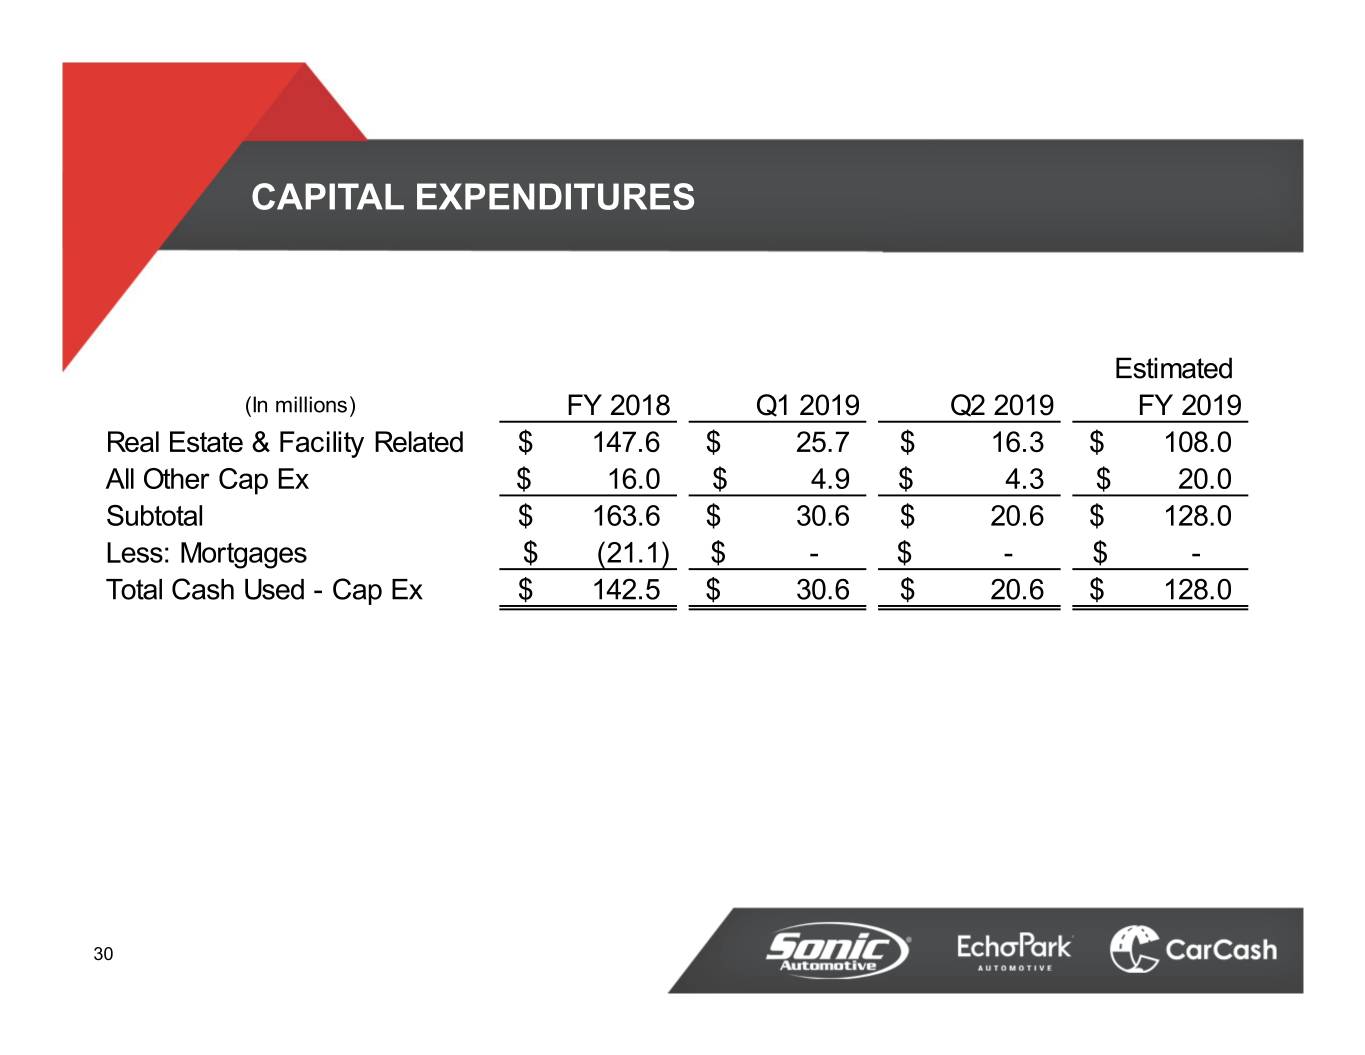
CAPITAL EXPENDITURES Estimated (In millions) FY 2018 Q1 2019 Q2 2019 FY 2019 Real Estate & Facility Related$ 147.6 $ 25.7 $ 16.3 $ 108.0 All Other Cap Ex$ 16.0 $ 4.9 $ 4.3 $ 20.0 Subtotal$ 163.6 $ 30.6 $ 20.6 $ 128.0 Less: Mortgages$ (21.1) $ - $ - $ - Total Cash Used - Cap Ex$ 142.5 $ 30.6 $ 20.6 $ 128.0 30
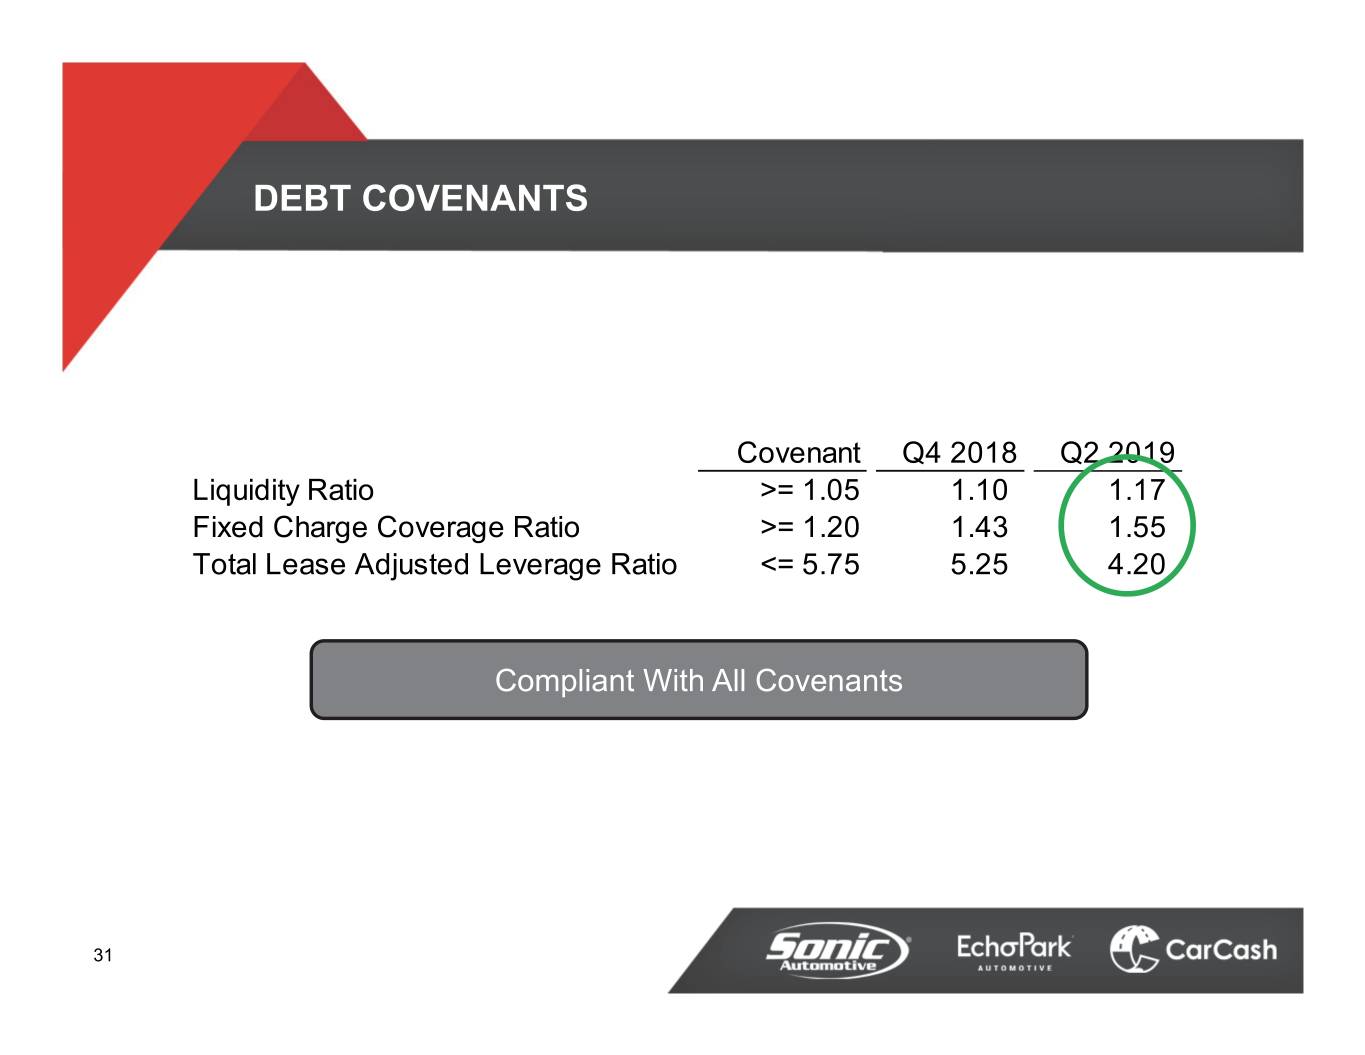
DEBT COVENANTS Covenant Q4 2018 Q2 2019 Liquidity Ratio >= 1.05 1.10 1.17 Fixed Charge Coverage Ratio >= 1.20 1.43 1.55 Total Lease Adjusted Leverage Ratio <= 5.75 5.25 4.20 Compliant With All Covenants 31
RECONCILIATION OF NON-GAAP MEASURES
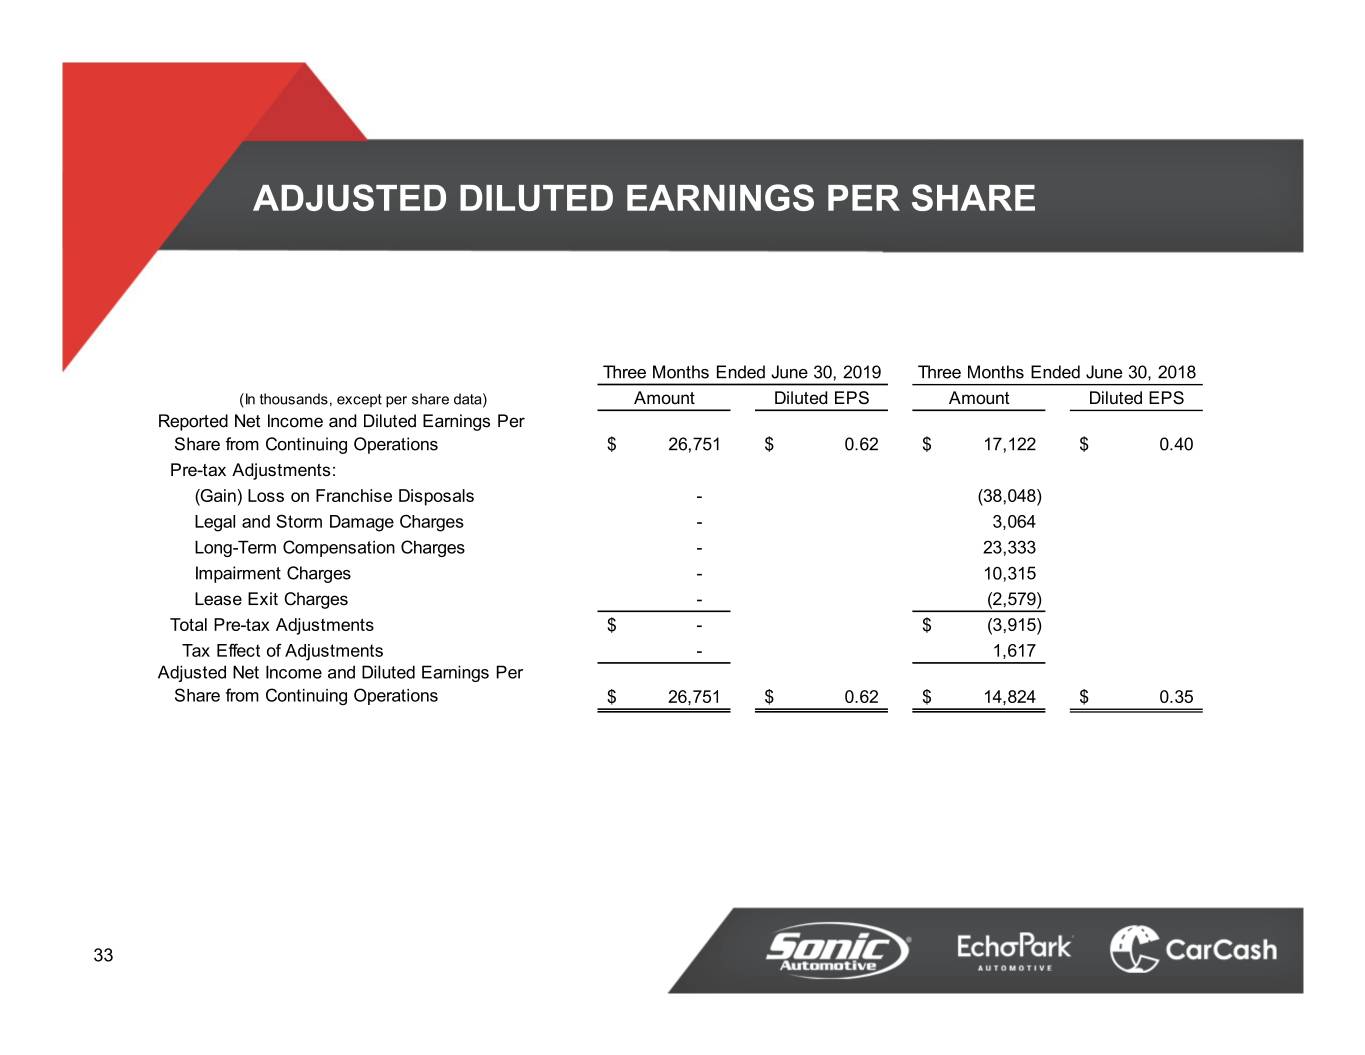
ADJUSTED DILUTED EARNINGS PER SHARE Three Months Ended June 30, 2019 Three Months Ended June 30, 2018 (In thousands, except per share data) Amount Diluted EPS Amount Diluted EPS Reported Net Income and Diluted Earnings Per Share from Continuing Operations$ 26,751 $ 0.62 $ 17,122 $ 0.40 Pre-tax Adjustments: (Gain) Loss on Franchise Disposals - (38,048) Legal and Storm Damage Charges - 3,064 Long-Term Compensation Charges - 23,333 Impairment Charges - 10,315 Lease Exit Charges - (2,579) Total Pre-tax Adjustments$ - $ (3,915) Tax Effect of Adjustments - 1,617 Adjusted Net Income and Diluted Earnings Per Share from Continuing Operations $ 26,751 $ 0.62 $ 14,824 $ 0.35 33
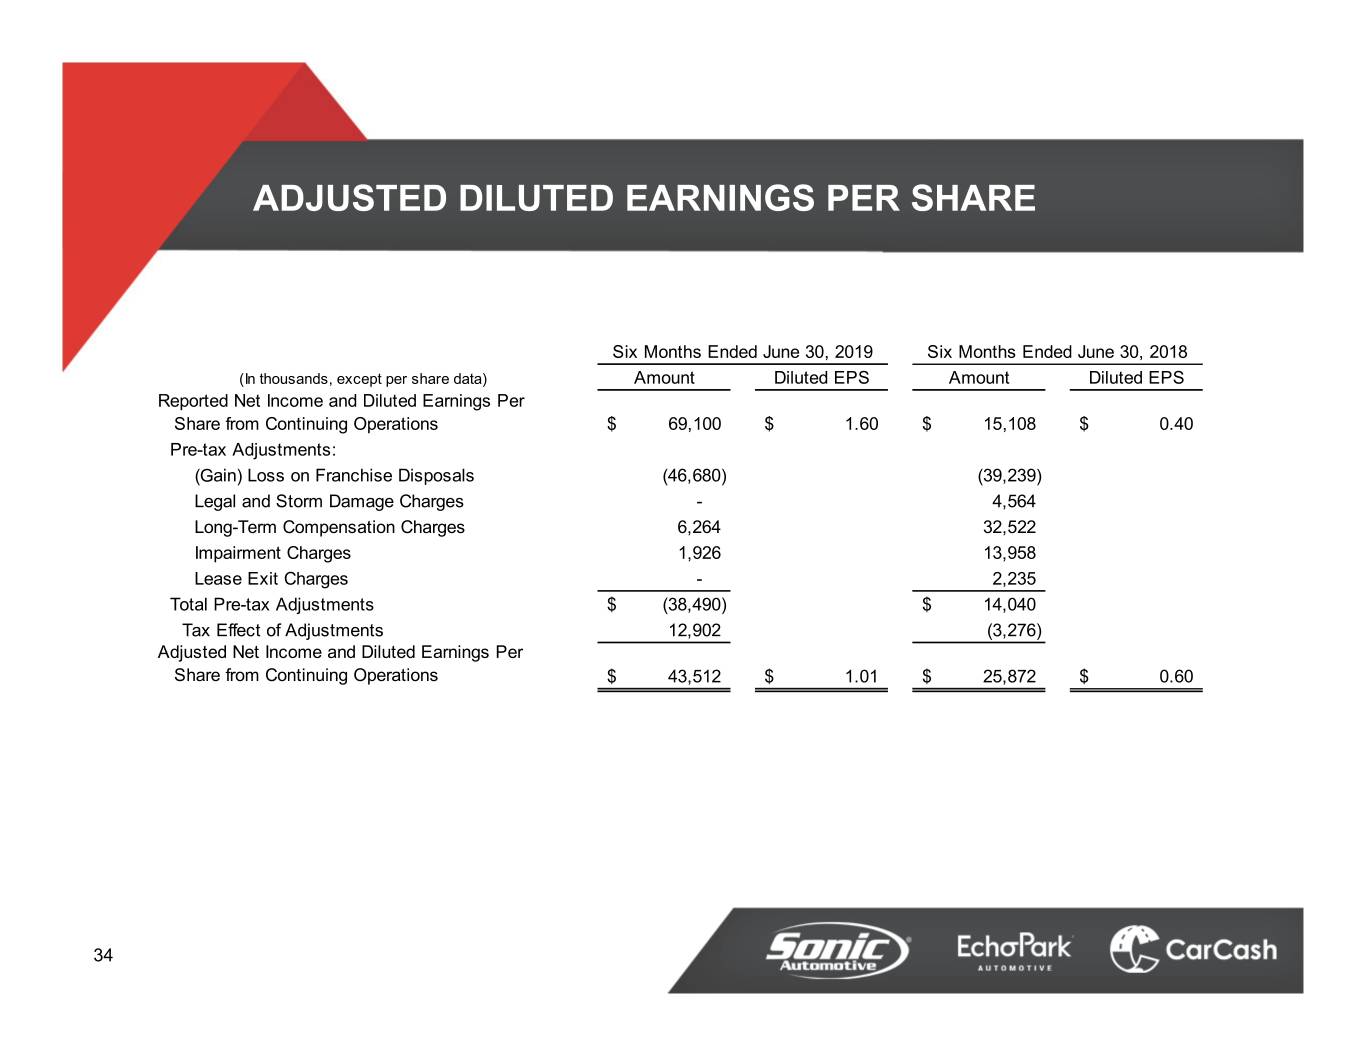
ADJUSTED DILUTED EARNINGS PER SHARE Six Months Ended June 30, 2019 Six Months Ended June 30, 2018 (In thousands, except per share data) Amount Diluted EPS Amount Diluted EPS Reported Net Income and Diluted Earnings Per Share from Continuing Operations$ 69,100 $ 1.60 $ 15,108 $ 0.40 Pre-tax Adjustments: (Gain) Loss on Franchise Disposals (46,680) (39,239) Legal and Storm Damage Charges - 4,564 Long-Term Compensation Charges 6,264 32,522 Impairment Charges 1,926 13,958 Lease Exit Charges - 2,235 Total Pre-tax Adjustments$ (38,490) $ 14,040 Tax Effect of Adjustments 12,902 (3,276) Adjusted Net Income and Diluted Earnings Per Share from Continuing Operations $ 43,512 $ 1.01 $ 25,872 $ 0.60 34
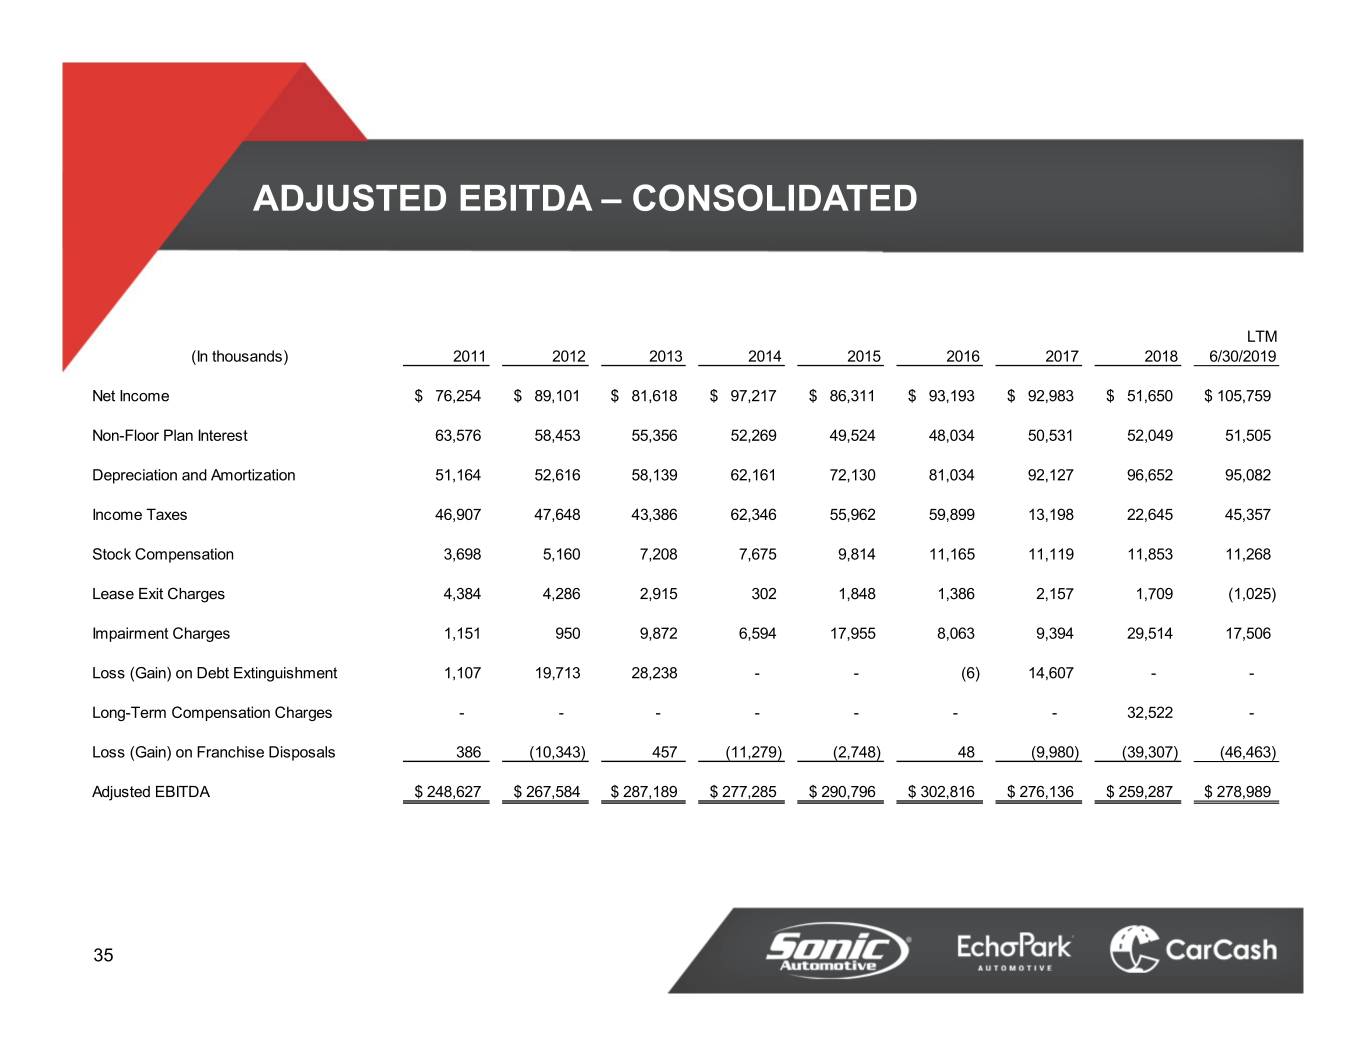
ADJUSTED EBITDA – CONSOLIDATED LTM (In thousands) 2011 2012 2013 2014 2015 2016 2017 2018 6/30/2019 Net Income$ 76,254 $ 89,101 $ 81,618 $ 97,217 $ 86,311 $ 93,193 $ 92,983 $ 51,650 $ 105,759 Non-Floor Plan Interest 63,576 58,453 55,356 52,269 49,524 48,034 50,531 52,049 51,505 Depreciation and Amortization 51,164 52,616 58,139 62,161 72,130 81,034 92,127 96,652 95,082 Income Taxes 46,907 47,648 43,386 62,346 55,962 59,899 13,198 22,645 45,357 Stock Compensation 3,698 5,160 7,208 7,675 9,814 11,165 11,119 11,853 11,268 Lease Exit Charges 4,384 4,286 2,915 302 1,848 1,386 2,157 1,709 (1,025) Impairment Charges 1,151 950 9,872 6,594 17,955 8,063 9,394 29,514 17,506 Loss (Gain) on Debt Extinguishment 1,107 19,713 28,238 - - (6) 14,607 - - Long-Term Compensation Charges - - - - - - - 32,522 - Loss (Gain) on Franchise Disposals 386 (10,343) 457 (11,279) (2,748) 48 (9,980) (39,307) (46,463) Adjusted EBITDA$ 248,627 $ 267,584 $ 287,189 $ 277,285 $ 290,796 $ 302,816 $ 276,136 $ 259,287 $ 278,989 35
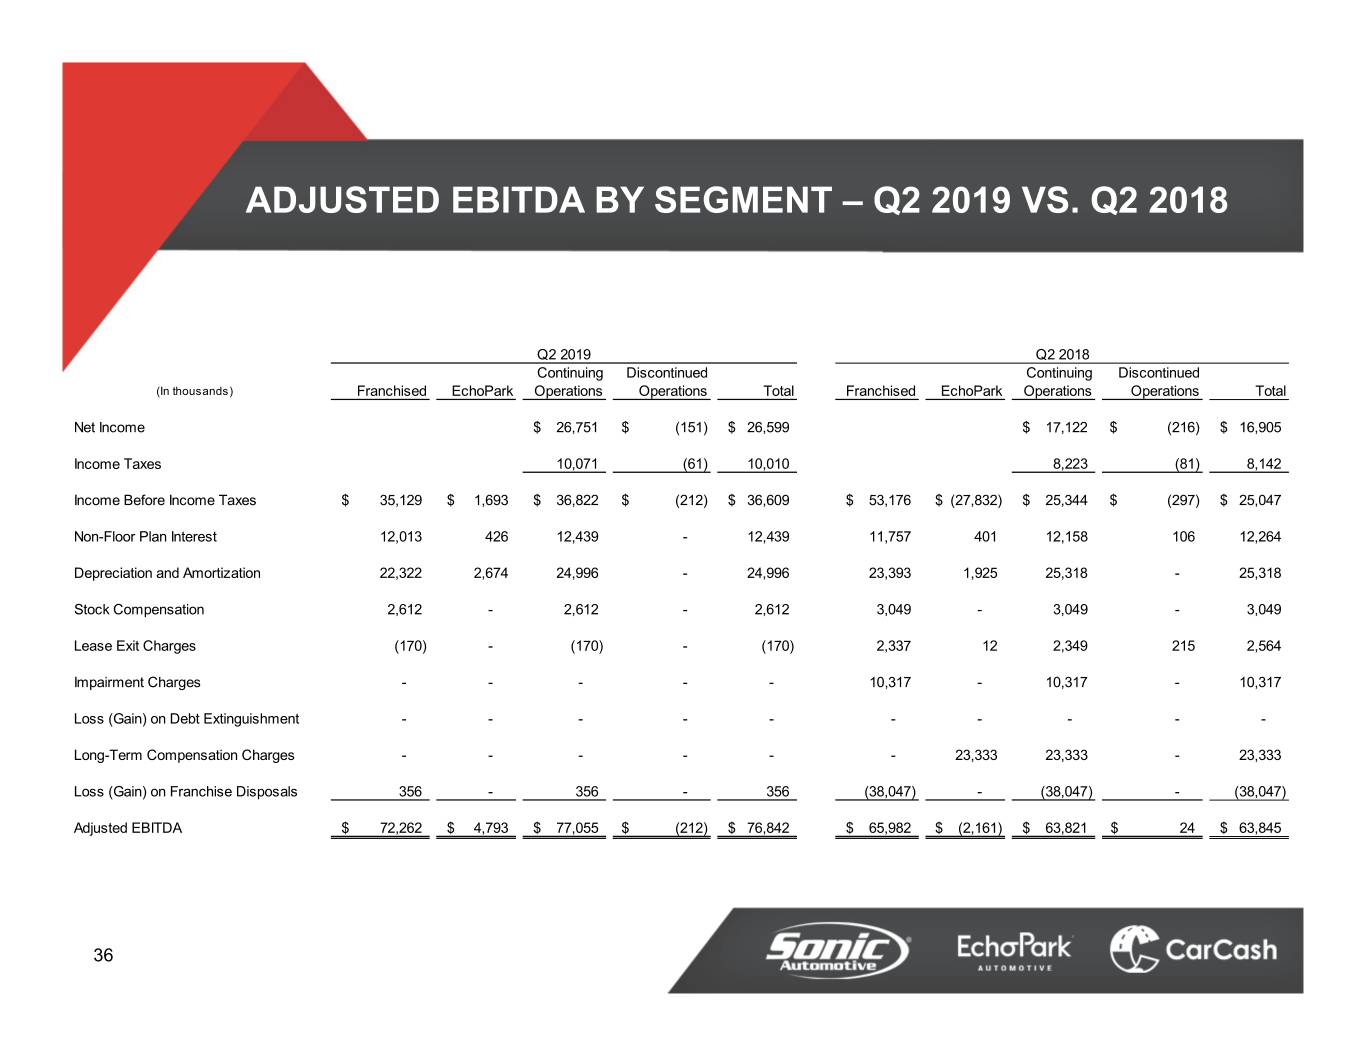
ADJUSTED EBITDA BY SEGMENT – Q2 2019 VS. Q2 2018 Q2 2019 Q2 2018 Continuing Discontinued Continuing Discontinued (In thousands) Franchised EchoPark Operations Operations Total Franchised EchoPark Operations Operations Total Net Income$ 26,751 $ (151) $ 26,599 $ 17,122 $ (216) $ 16,905 Income Taxes 10,071 (61) 10,010 8,223 (81) 8,142 Income Before Income Taxes$ 35,129 $ 1,693 $ 36,822 $ (212) $ 36,609 $ 53,176 $ (27,832) $ 25,344 $ (297) $ 25,047 Non-Floor Plan Interest 12,013 426 12,439 - 12,439 11,757 401 12,158 106 12,264 Depreciation and Amortization 22,322 2,674 24,996 - 24,996 23,393 1,925 25,318 - 25,318 Stock Compensation 2,612 - 2,612 - 2,612 3,049 - 3,049 - 3,049 Lease Exit Charges (170) - (170) - (170) 2,337 12 2,349 215 2,564 Impairment Charges - - - - - 10,317 - 10,317 - 10,317 Loss (Gain) on Debt Extinguishment - - - - - - - - - - Long-Term Compensation Charges - - - - - - 23,333 23,333 - 23,333 Loss (Gain) on Franchise Disposals 356 - 356 - 356 (38,047) - (38,047) - (38,047) Adjusted EBITDA$ 72,262 $ 4,793 $ 77,055 $ (212) $ 76,842 $ 65,982 $ (2,161) $ 63,821 $ 24 $ 63,845 36
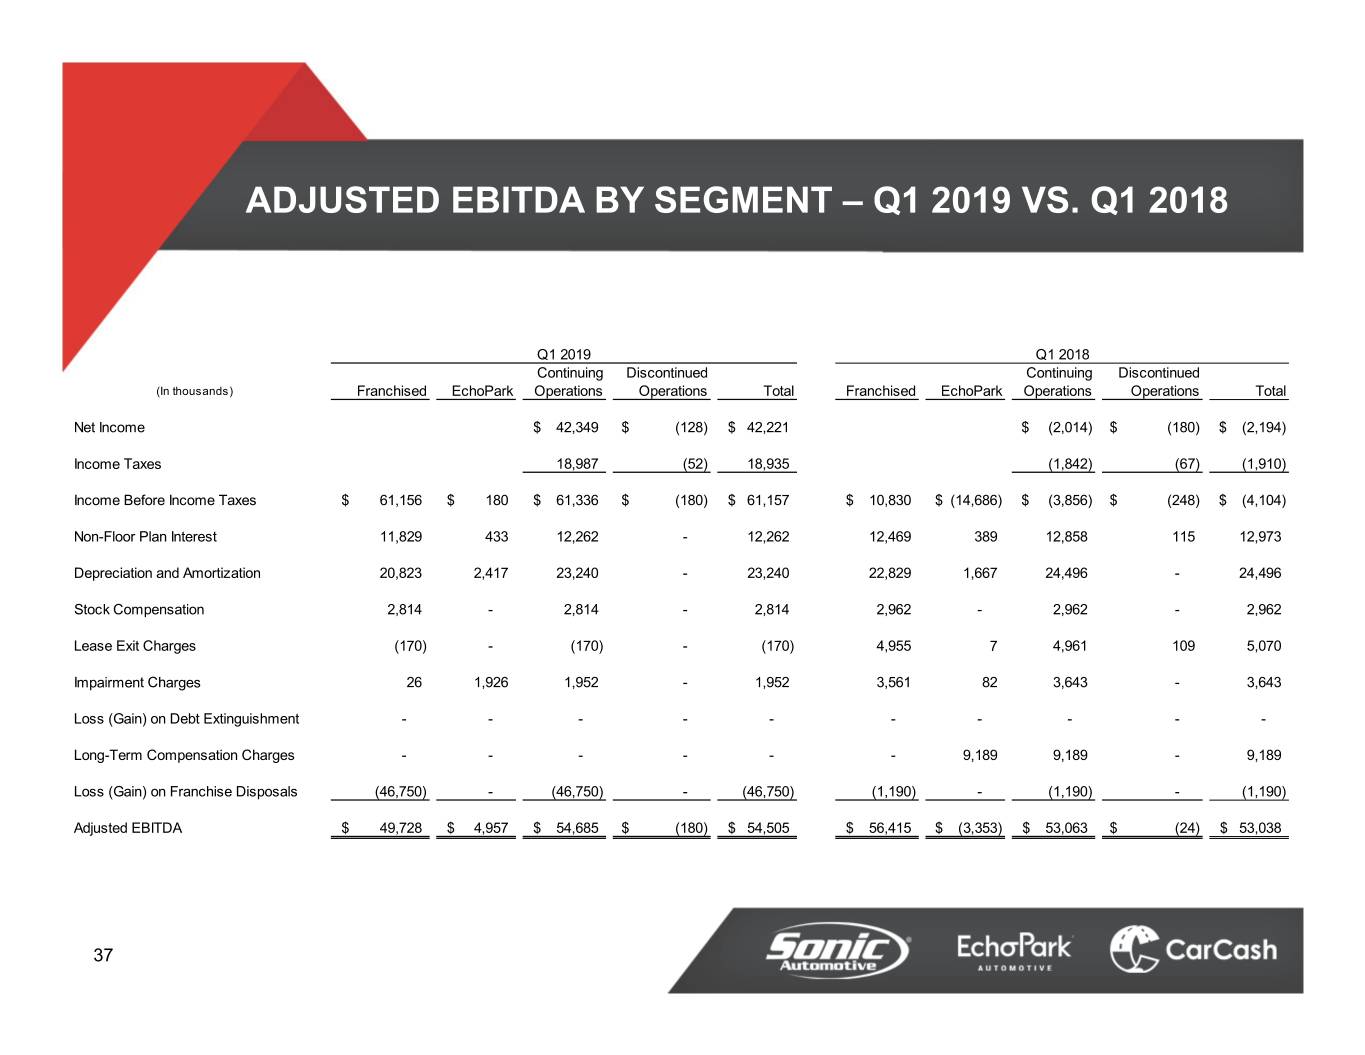
ADJUSTED EBITDA BY SEGMENT – Q1 2019 VS. Q1 2018 Q1 2019 Q1 2018 Continuing Discontinued Continuing Discontinued (In thousands) Franchised EchoPark Operations Operations Total Franchised EchoPark Operations Operations Total Net Income$ 42,349 $ (128) $ 42,221 $ (2,014) $ (180) $ (2,194) Income Taxes 18,987 (52) 18,935 (1,842) (67) (1,910) Income Before Income Taxes$ 61,156 $ 180 $ 61,336 $ (180) $ 61,157 $ 10,830 $ (14,686) $ (3,856) $ (248) $ (4,104) Non-Floor Plan Interest 11,829 433 12,262 - 12,262 12,469 389 12,858 115 12,973 Depreciation and Amortization 20,823 2,417 23,240 - 23,240 22,829 1,667 24,496 - 24,496 Stock Compensation 2,814 - 2,814 - 2,814 2,962 - 2,962 - 2,962 Lease Exit Charges (170) - (170) - (170) 4,955 7 4,961 109 5,070 Impairment Charges 26 1,926 1,952 - 1,952 3,561 82 3,643 - 3,643 Loss (Gain) on Debt Extinguishment - - - - - - - - - - Long-Term Compensation Charges - - - - - - 9,189 9,189 - 9,189 Loss (Gain) on Franchise Disposals (46,750) - (46,750) - (46,750) (1,190) - (1,190) - (1,190) Adjusted EBITDA$ 49,728 $ 4,957 $ 54,685 $ (180) $ 54,505 $ 56,415 $ (3,353) $ 53,063 $ (24) $ 53,038 37
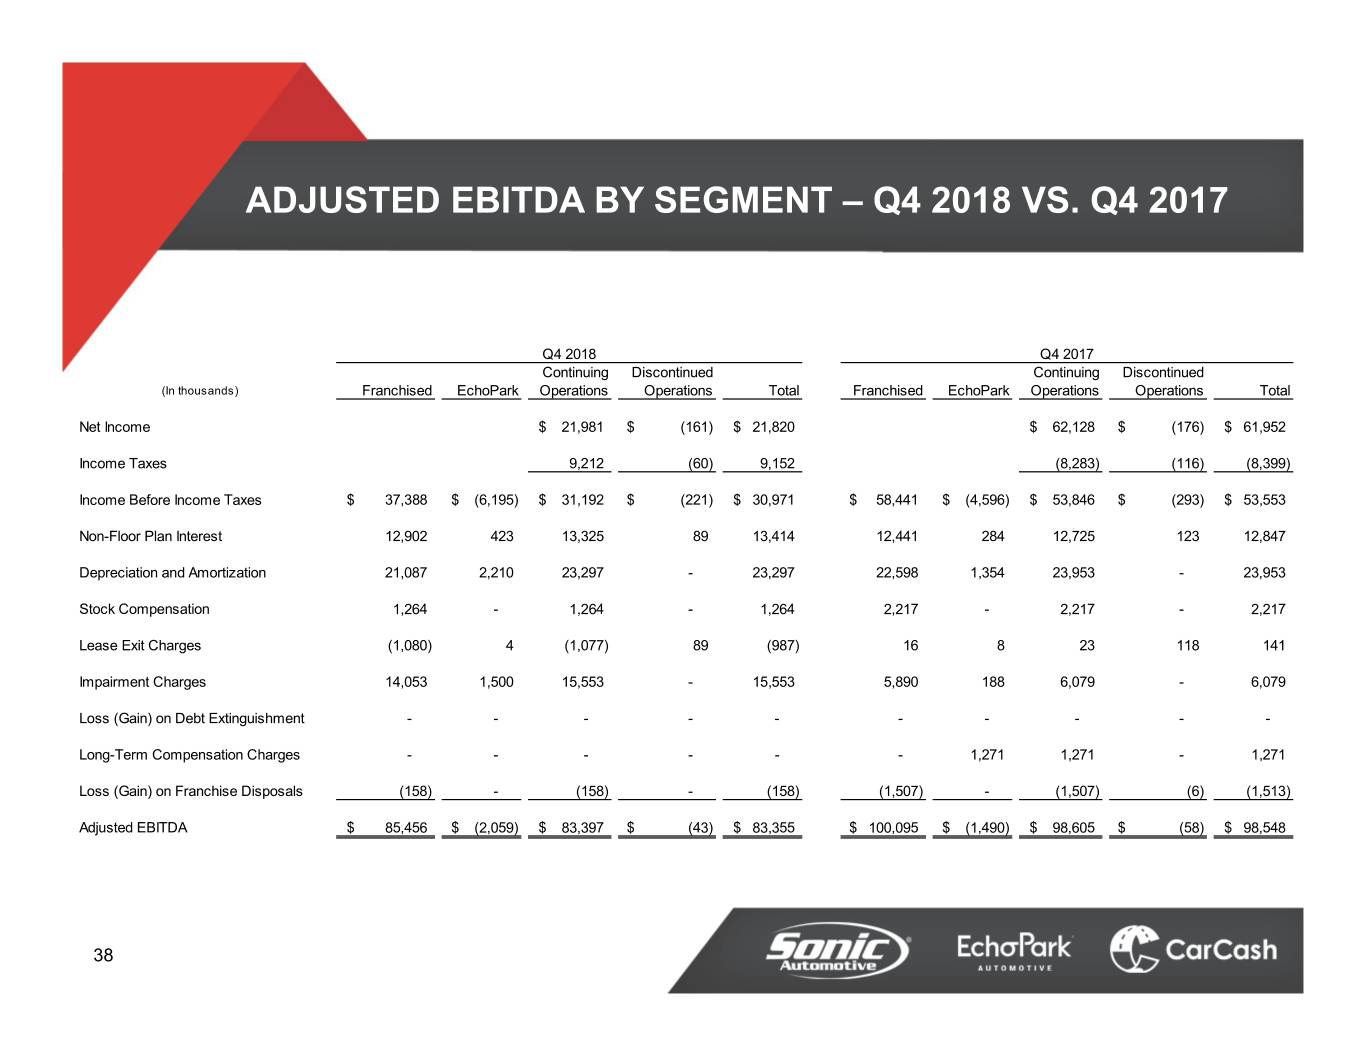
ADJUSTED EBITDA BY SEGMENT – Q4 2018 VS. Q4 2017 Q4 2018 Q4 2017 Continuing Discontinued Continuing Discontinued (In thousands) Franchised EchoPark Operations Operations Total Franchised EchoPark Operations Operations Total Net Income$ 21,981 $ (161) $ 21,820 $ 62,128 $ (176) $ 61,952 Income Taxes 9,212 (60) 9,152 (8,283) (116) (8,399) Income Before Income Taxes$ 37,388 $ (6,195) $ 31,192 $ (221) $ 30,971 $ 58,441 $ (4,596) $ 53,846 $ (293) $ 53,553 Non-Floor Plan Interest 12,902 423 13,325 89 13,414 12,441 284 12,725 123 12,847 Depreciation and Amortization 21,087 2,210 23,297 - 23,297 22,598 1,354 23,953 - 23,953 Stock Compensation 1,264 - 1,264 - 1,264 2,217 - 2,217 - 2,217 Lease Exit Charges (1,080) 4 (1,077) 89 (987) 16 8 23 118 141 Impairment Charges 14,053 1,500 15,553 - 15,553 5,890 188 6,079 - 6,079 Loss (Gain) on Debt Extinguishment - - - - - - - - - - Long-Term Compensation Charges - - - - - - 1,271 1,271 - 1,271 Loss (Gain) on Franchise Disposals (158) - (158) - (158) (1,507) - (1,507) (6) (1,513) Adjusted EBITDA$ 85,456 $ (2,059) $ 83,397 $ (43) $ 83,355 $ 100,095 $ (1,490) $ 98,605 $ (58) $ 98,548 38
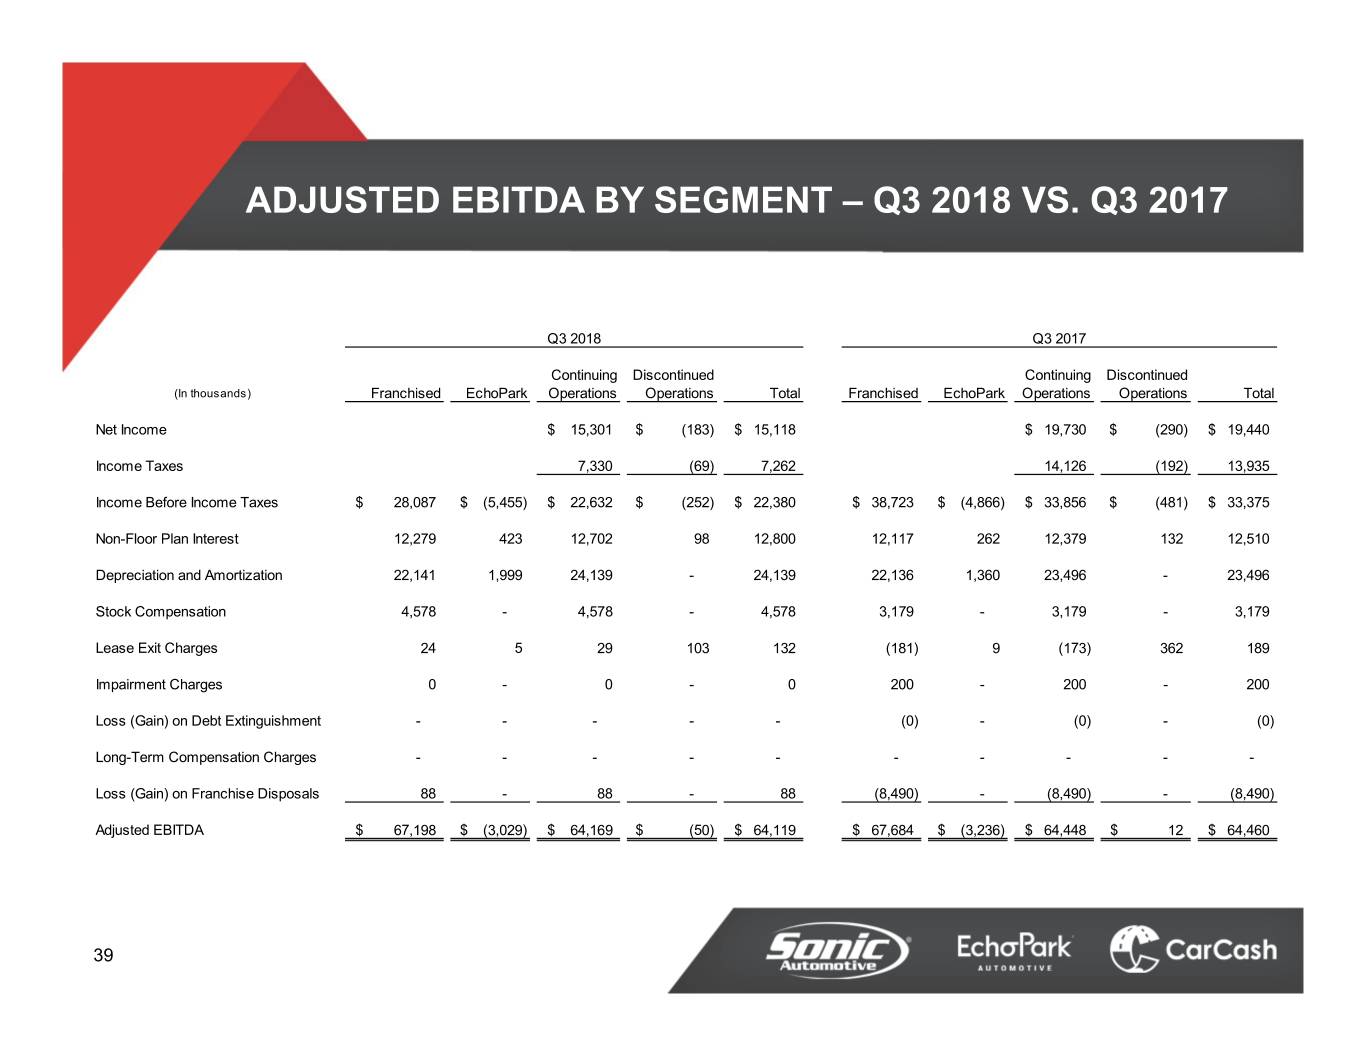
ADJUSTED EBITDA BY SEGMENT – Q3 2018 VS. Q3 2017 Q3 2018 Q3 2017 Continuing Discontinued Continuing Discontinued (In thousands) Franchised EchoPark Operations Operations Total Franchised EchoPark Operations Operations Total Net Income$ 15,301 $ (183) $ 15,118 $ 19,730 $ (290) $ 19,440 Income Taxes 7,330 (69) 7,262 14,126 (192) 13,935 Income Before Income Taxes$ 28,087 $ (5,455) $ 22,632 $ (252) $ 22,380 $ 38,723 $ (4,866) $ 33,856 $ (481) $ 33,375 Non-Floor Plan Interest 12,279 423 12,702 98 12,800 12,117 262 12,379 132 12,510 Depreciation and Amortization 22,141 1,999 24,139 - 24,139 22,136 1,360 23,496 - 23,496 Stock Compensation 4,578 - 4,578 - 4,578 3,179 - 3,179 - 3,179 Lease Exit Charges 24 5 29 103 132 (181) 9 (173) 362 189 Impairment Charges 0 - 0 - 0 200 - 200 - 200 Loss (Gain) on Debt Extinguishment - - - - - (0) - (0) - (0) Long-Term Compensation Charges - - - - - - - - - - Loss (Gain) on Franchise Disposals 88 - 88 - 88 (8,490) - (8,490) - (8,490) Adjusted EBITDA$ 67,198 $ (3,029) $ 64,169 $ (50) $ 64,119 $ 67,684 $ (3,236) $ 64,448 $ 12 $ 64,460 39
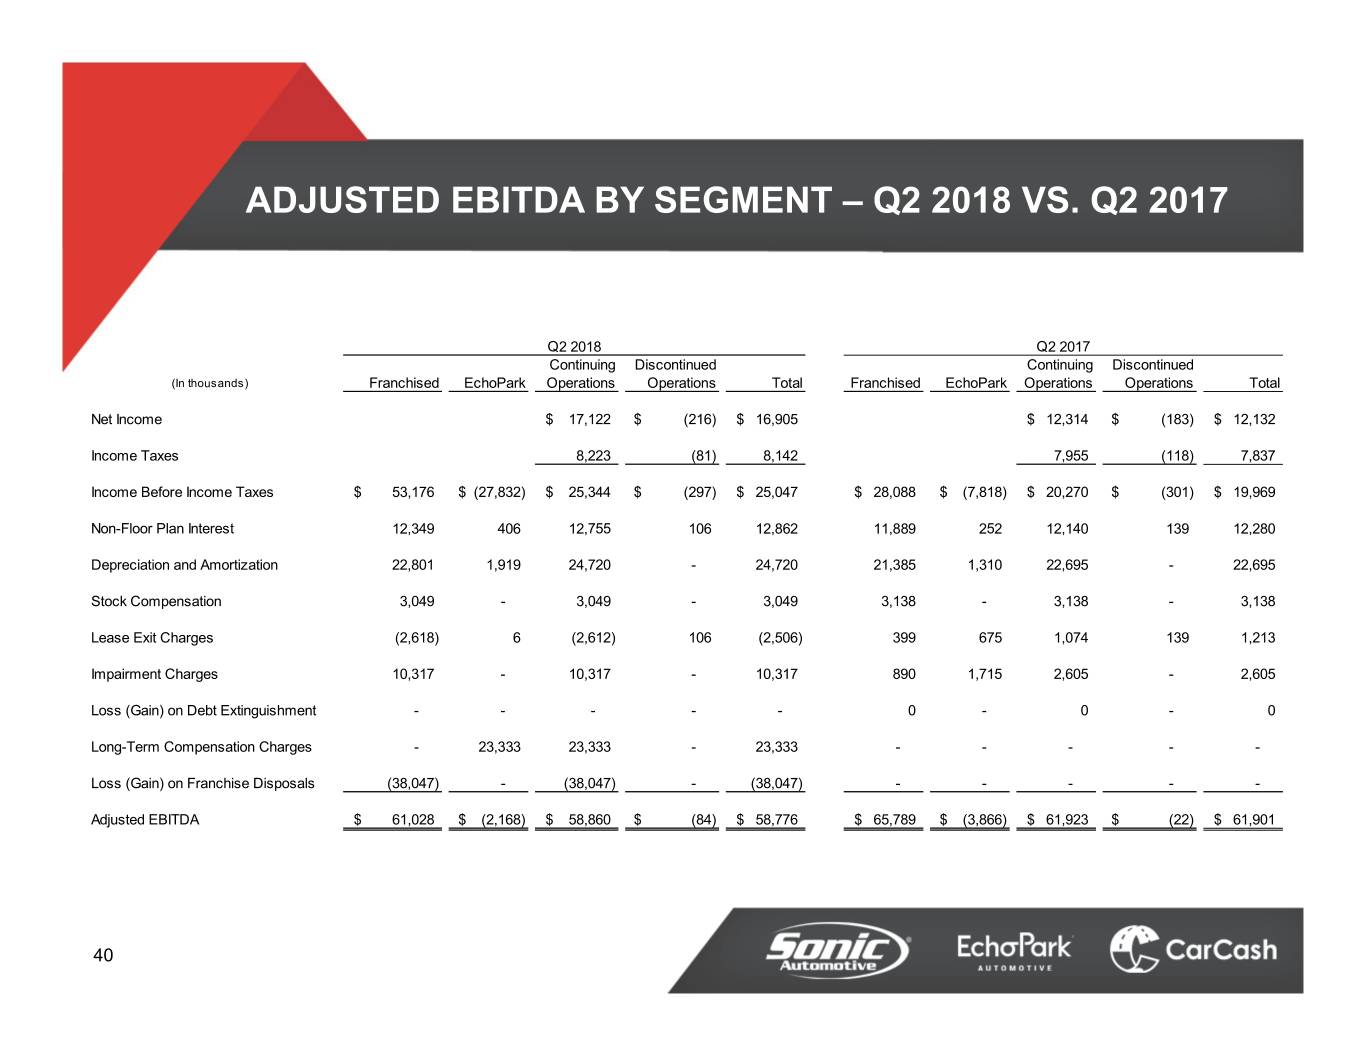
ADJUSTED EBITDA BY SEGMENT – Q2 2018 VS. Q2 2017 Q2 2018 Q2 2017 Continuing Discontinued Continuing Discontinued (In thousands) Franchised EchoPark Operations Operations Total Franchised EchoPark Operations Operations Total Net Income$ 17,122 $ (216) $ 16,905 $ 12,314 $ (183) $ 12,132 Income Taxes 8,223 (81) 8,142 7,955 (118) 7,837 Income Before Income Taxes$ 53,176 $ (27,832) $ 25,344 $ (297) $ 25,047 $ 28,088 $ (7,818) $ 20,270 $ (301) $ 19,969 Non-Floor Plan Interest 12,349 406 12,755 106 12,862 11,889 252 12,140 139 12,280 Depreciation and Amortization 22,801 1,919 24,720 - 24,720 21,385 1,310 22,695 - 22,695 Stock Compensation 3,049 - 3,049 - 3,049 3,138 - 3,138 - 3,138 Lease Exit Charges (2,618) 6 (2,612) 106 (2,506) 399 675 1,074 139 1,213 Impairment Charges 10,317 - 10,317 - 10,317 890 1,715 2,605 - 2,605 Loss (Gain) on Debt Extinguishment - - - - - 0 - 0 - 0 Long-Term Compensation Charges - 23,333 23,333 - 23,333 - - - - - Loss (Gain) on Franchise Disposals (38,047) - (38,047) - (38,047) - - - - - Adjusted EBITDA$ 61,028 $ (2,168) $ 58,860 $ (84) $ 58,776 $ 65,789 $ (3,866) $ 61,923 $ (22) $ 61,901 40
41