
Exhibit 99.2 Sonic Automotive – A Holistic Approach to Creating Shareholder Value February 19, 2020
Forward-Looking Statements This presentation contains “forward-looking statements” within the meaning of the Private Securities Litigation Reform Act of 1995. These statements relate to future events, are not historical facts and are based on our current expectations and assumptions regarding our business, the economy and other future conditions. These statements can generally be identified by lead-in words such as “may,” “will,” “should,” “could,” “believe,” “expect,” “estimate,” “anticipate,” “intend,” “plan,” “foresee” and other similar words or phrases. Statements that describe our Company’s objectives, plans or goals are also forward-looking statements. Examples of such forward-looking information we may be discussing in this presentation include, without limitation, long-term annual revenue targets, anticipated future growth and profitability in our EchoPark Segment, anticipated openings of new EchoPark stores, anticipated future performance and growth of our Franchised Dealerships Segment, anticipated future debt reduction in 2020, anticipated 2020 industry new vehicle sales volume, the implementation of growth and operating strategies, including acquisitions of dealerships and properties, the return of capital to stockholders, anticipated future success and impacts from the implementation of our strategic initiatives, and earnings per share expectations. You are cautioned that these forward-looking statements are not guarantees of future performance, involve risks and uncertainties and actual results may differ materially from those projected in the forward-looking statements as a result of various factors. These risks and uncertainties include, without limitation, economic conditions in the markets in which we operate, new and used vehicle industry sales volume, the success of our operational strategies, the rate and timing of overall economic expansion or contraction, and the risk factors described in the Company’s Annual Report on Form 10-K for the year ended December 31, 2018 and the Company’s other periodic reports and information filed with the Securities and Exchange Commission (the “SEC”). These forward-looking statements, risks, uncertainties and additional factors speak only as of the date of this presentation. We undertake no obligation to update any such statements, except as required under federal securities laws and the rules and regulations of the SEC. 2
COMPANY OVERVIEW 3
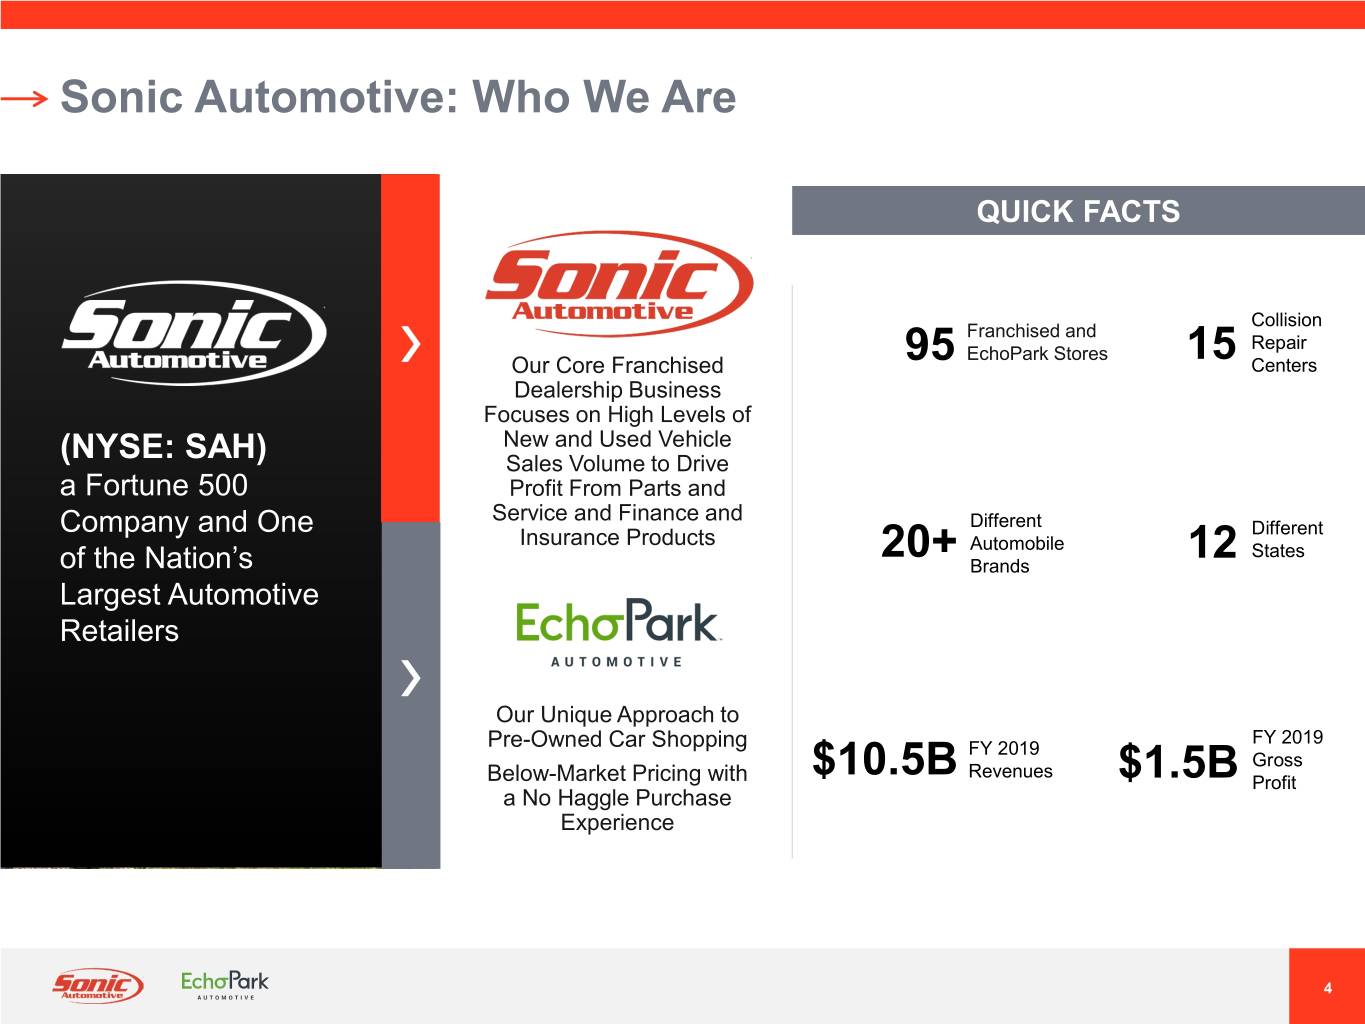
Sonic Automotive: Who We Are QUICK FACTS Collision Franchised and Repair EchoPark Stores Our Core Franchised 95 15 Centers Dealership Business Focuses on High Levels of New and Used Vehicle (NYSE: SAH) Sales Volume to Drive a Fortune 500 Profit From Parts and Service and Finance and Different Company and One Insurance Products Different Automobile States of the Nation’s 20+ Brands 12 Largest Automotive Retailers Our Unique Approach to FY 2019 Pre-Owned Car Shopping FY 2019 Gross Revenues Below-Market Pricing with $10.5B $1.5B Profit a No Haggle Purchase Experience 4
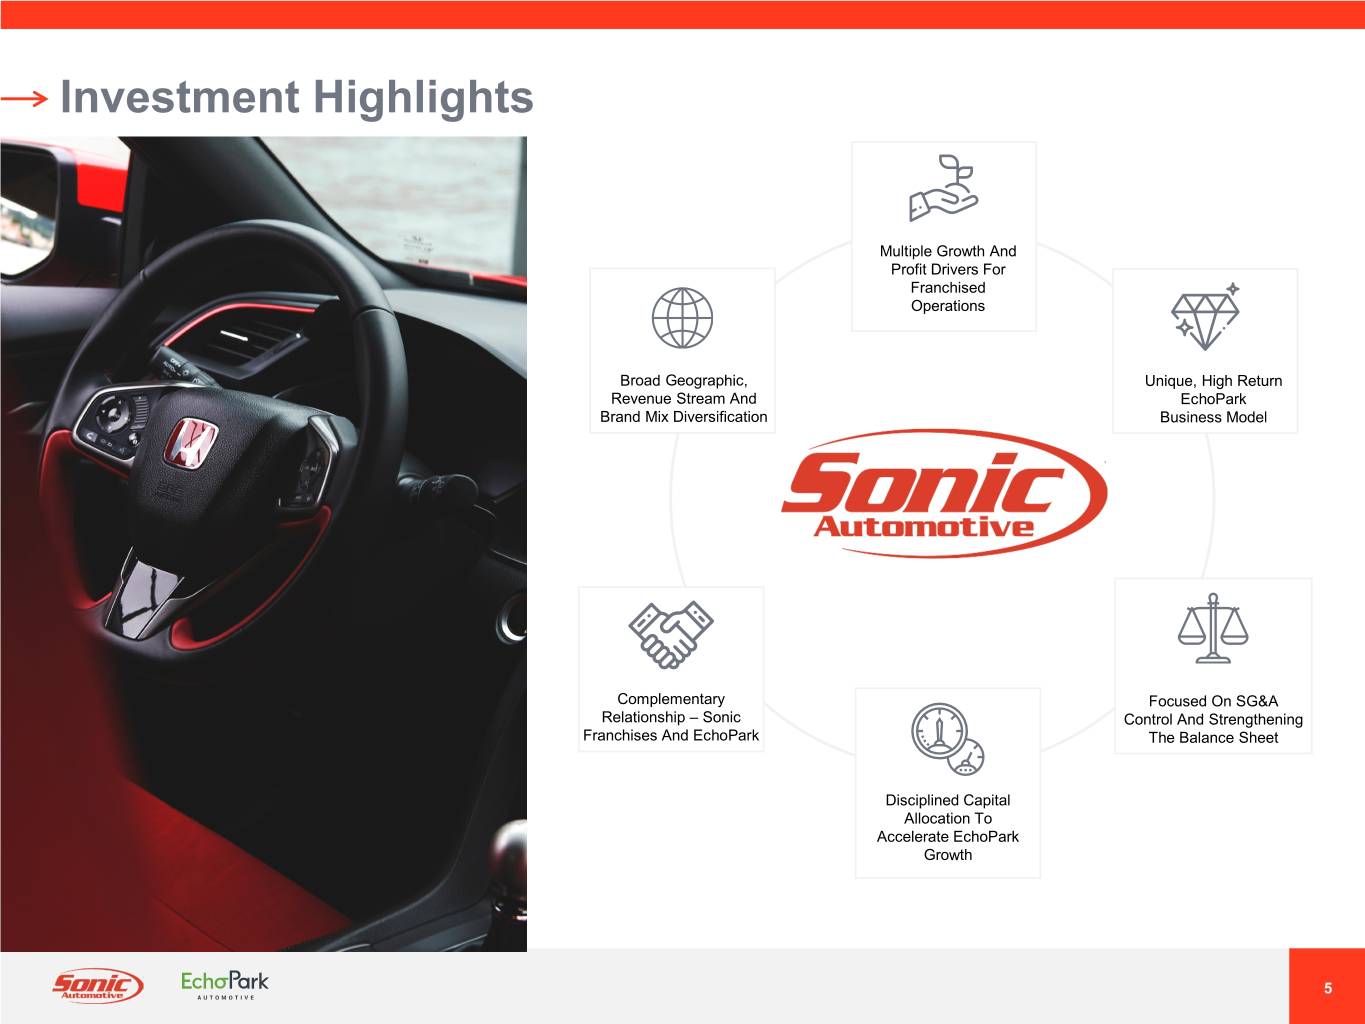
Investment Highlights Multiple Growth And Profit Drivers For Franchised Operations Broad Geographic, Unique, High Return Revenue Stream And EchoPark Brand Mix Diversification Business Model Complementary Focused On SG&A Relationship – Sonic Control And Strengthening Franchises And EchoPark The Balance Sheet Disciplined Capital Allocation To Accelerate EchoPark Growth 5
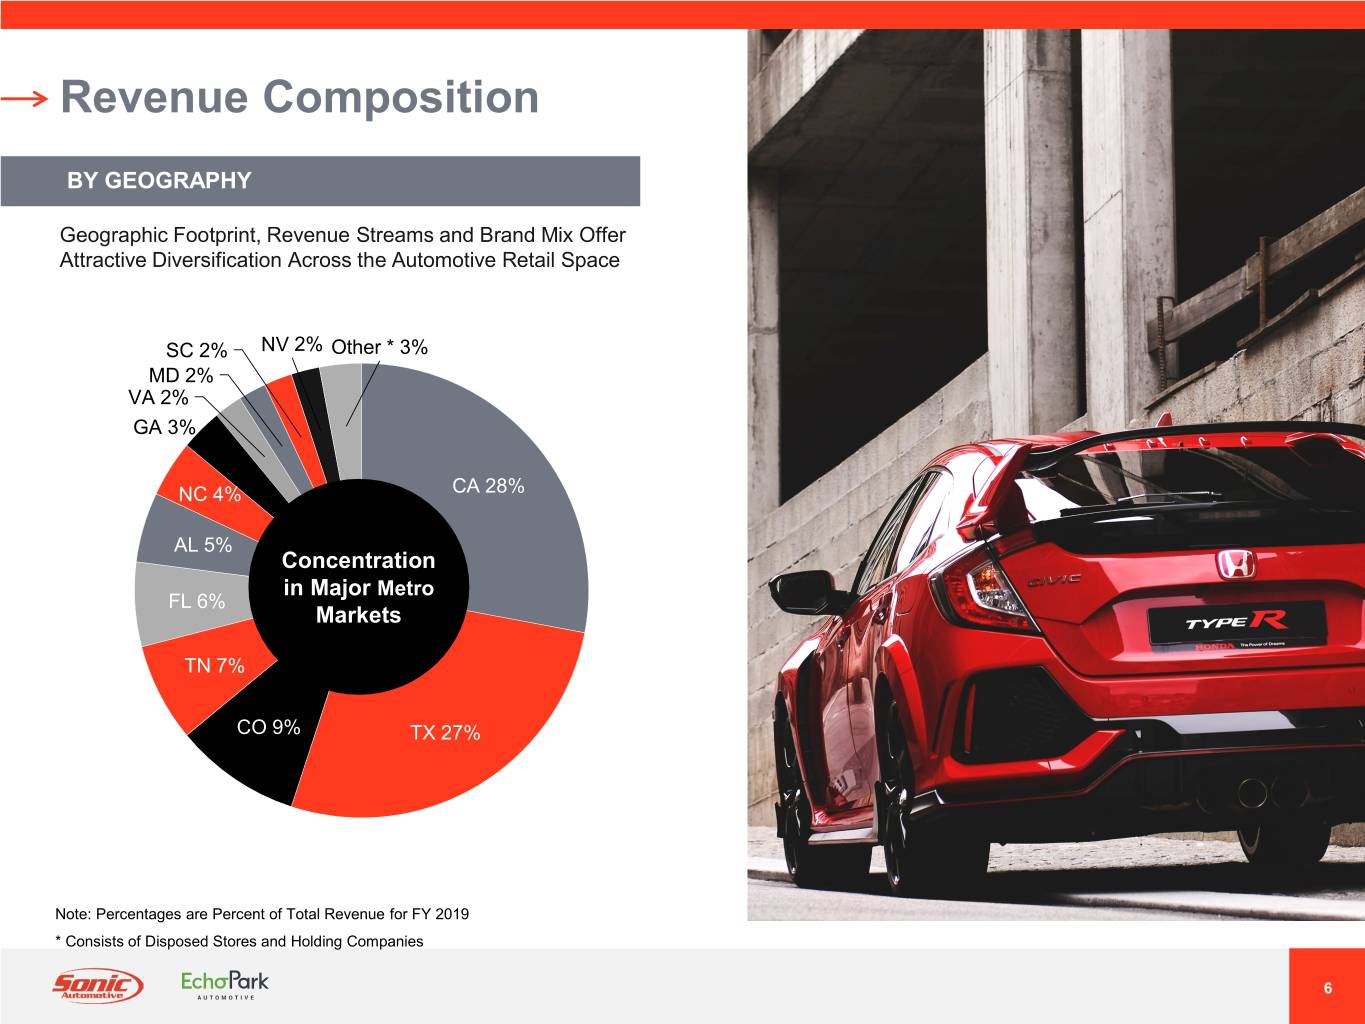
Revenue Composition BY GEOGRAPHY Geographic Footprint, Revenue Streams and Brand Mix Offer Attractive Diversification Across the Automotive Retail Space SC 2% NV 2% Other * 3% MD 2% VA 2% GA 3% NC 4% CA 28% AL 5% Concentration in Major Metro FL 6% Markets TN 7% CO 9% TX 27% Note: Percentages are Percent of Total Revenue for FY 2019 * Consists of Disposed Stores and Holding Companies 6
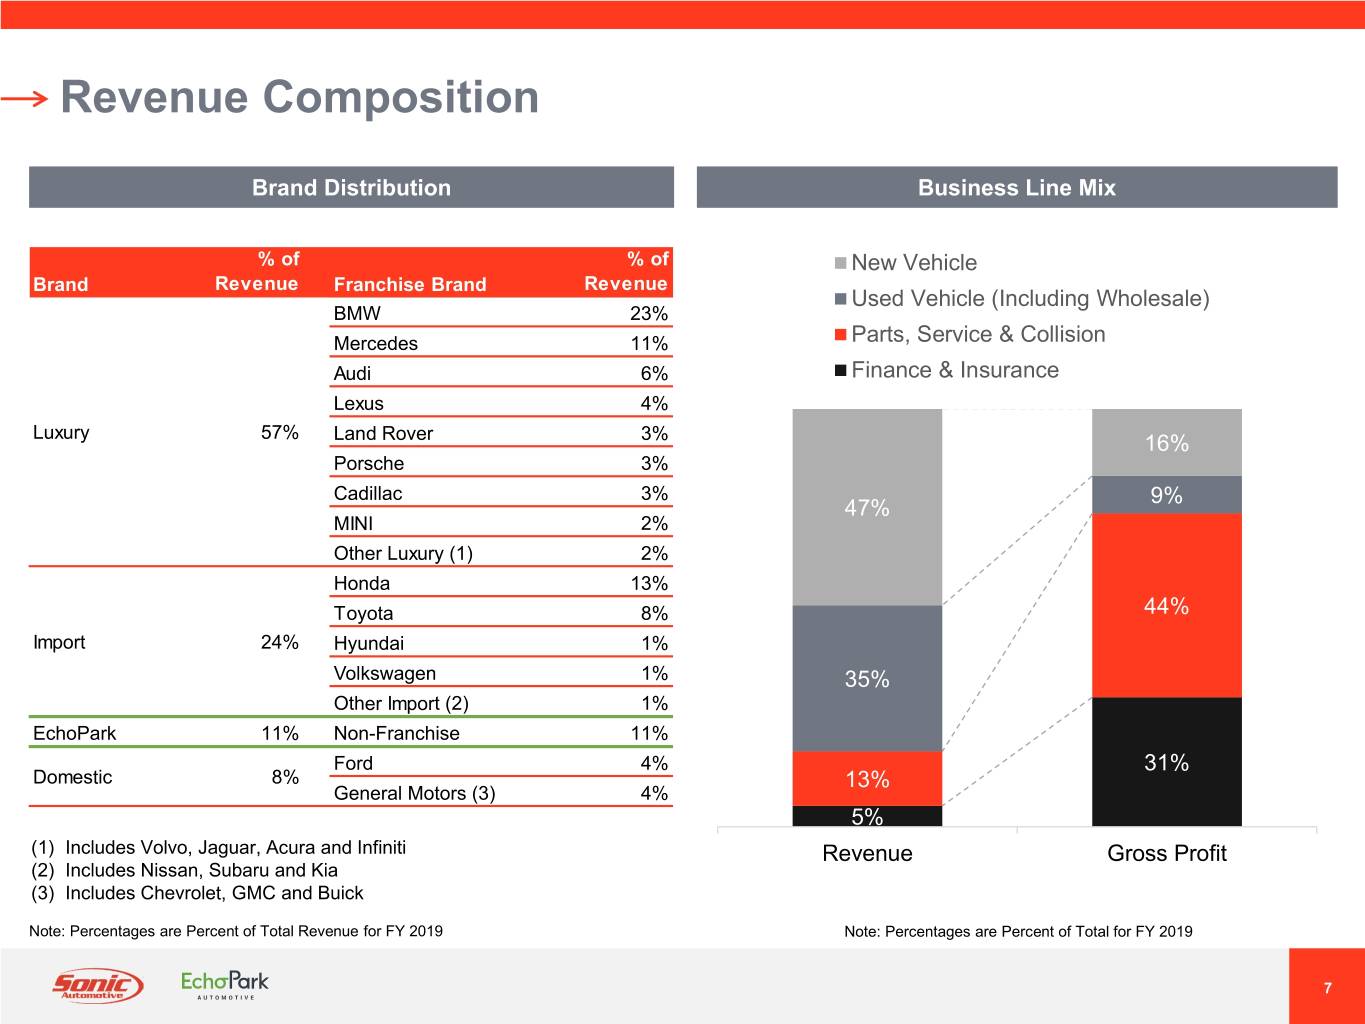
Revenue Composition Brand Distribution Business Line Mix % of % of New Vehicle Brand Revenue Franchise Brand Revenue Used Vehicle (Including Wholesale) BMW 23% Mercedes 11% Parts, Service & Collision Audi 6% Finance & Insurance Lexus 4% Luxury 57% Land Rover 3% 16% Porsche 3% Cadillac 3% 9% 47% MINI 2% Other Luxury (1) 2% Honda 13% Toyota 8% 44% Import 24% Hyundai 1% Volkswagen 1% 35% Other Import (2) 1% EchoPark 11% Non-Franchise 11% Ford 4% 31% Domestic 8% 13% General Motors (3) 4% 5% (1) Includes Volvo, Jaguar, Acura and Infiniti Revenue Gross Profit (2) Includes Nissan, Subaru and Kia (3) Includes Chevrolet, GMC and Buick Note: Percentages are Percent of Total Revenue for FY 2019 Note: Percentages are Percent of Total for FY 2019 7
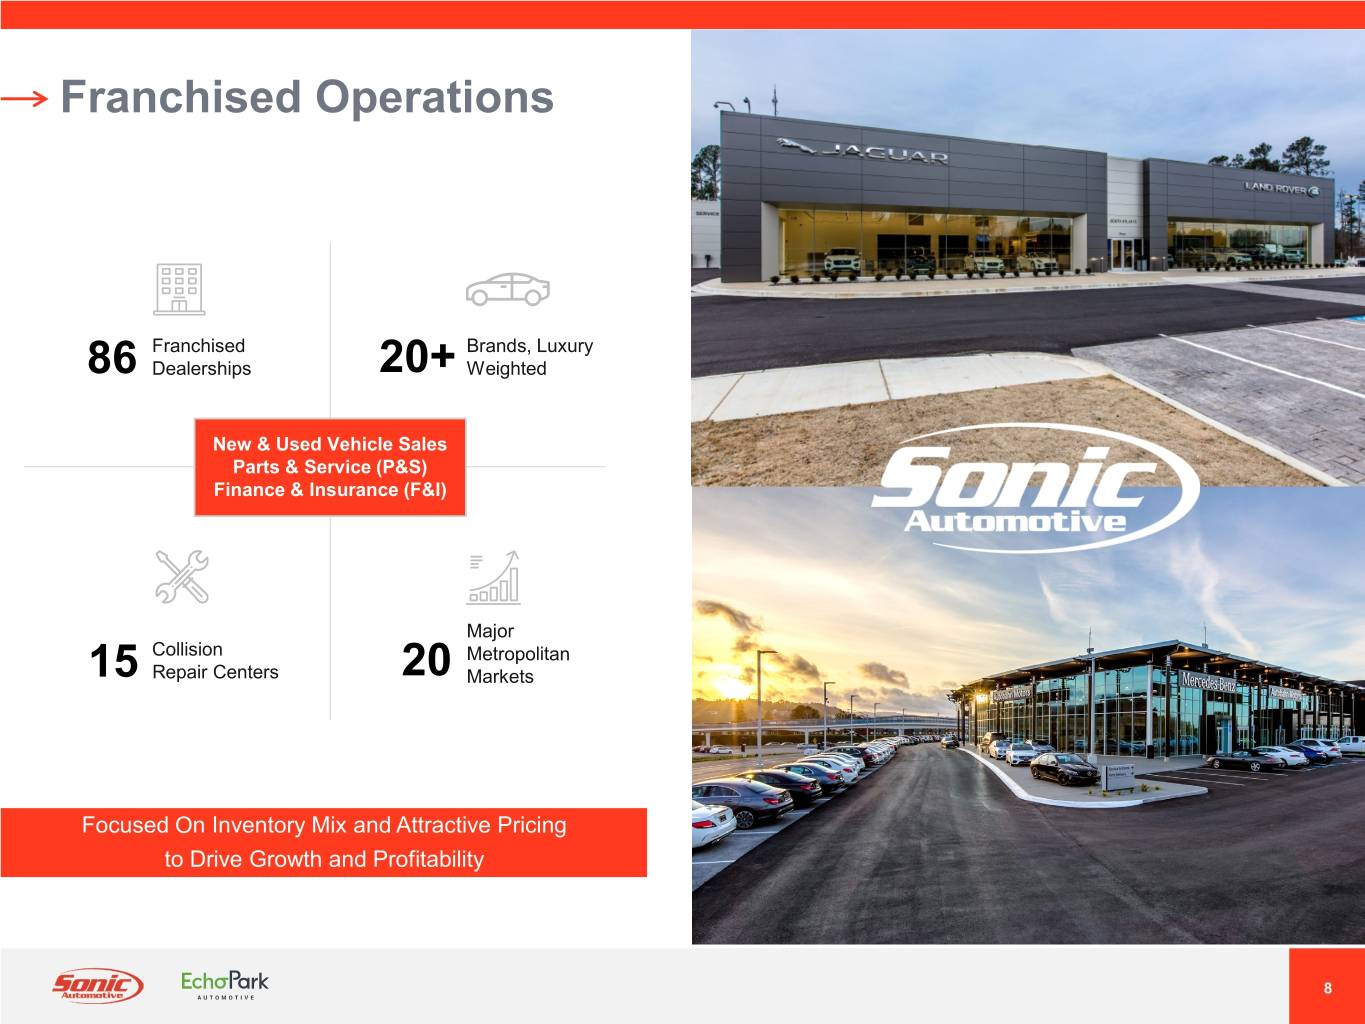
Franchised Operations Franchised Brands, Luxury 86 Dealerships 20+ Weighted New & Used Vehicle Sales Parts & Service (P&S) Finance & Insurance (F&I) Major Collision Metropolitan 15 Repair Centers 20 Markets Focused On Inventory Mix and Attractive Pricing to Drive Growth and Profitability 8
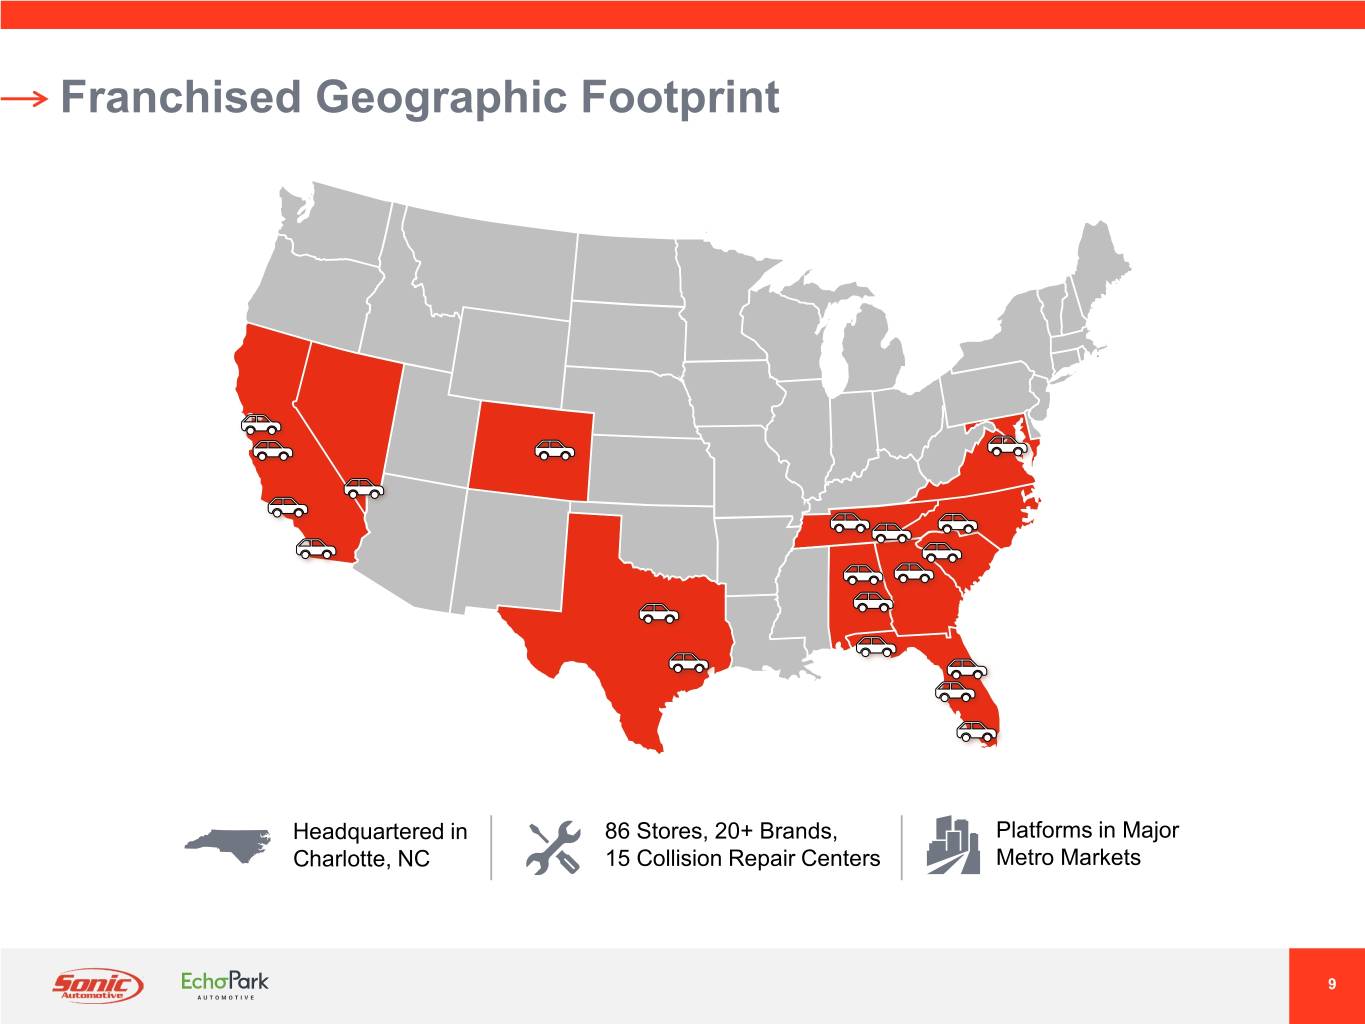
Franchised Geographic Footprint Headquartered in 86 Stores, 20+ Brands, Platforms in Major Charlotte, NC 15 Collision Repair Centers Metro Markets 9
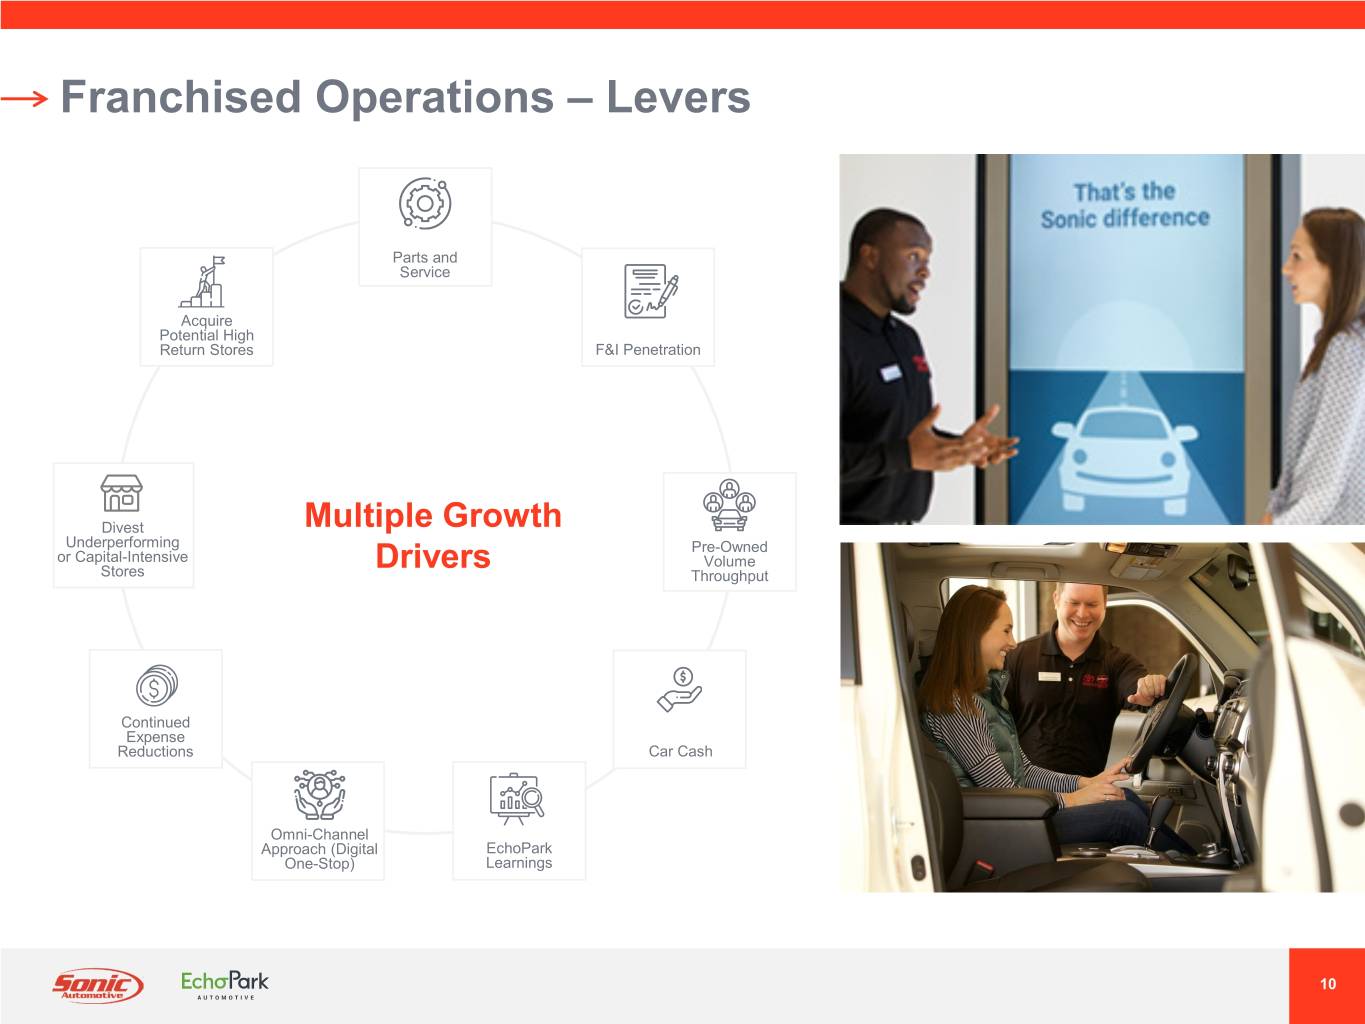
Franchised Operations – Levers Parts and Service Acquire Potential High Return Stores F&I Penetration Divest Multiple Growth Underperforming Pre-Owned or Capital-Intensive Volume Stores Drivers Throughput Continued Expense Reductions Car Cash Omni-Channel Approach (Digital EchoPark One-Stop) Learnings 10
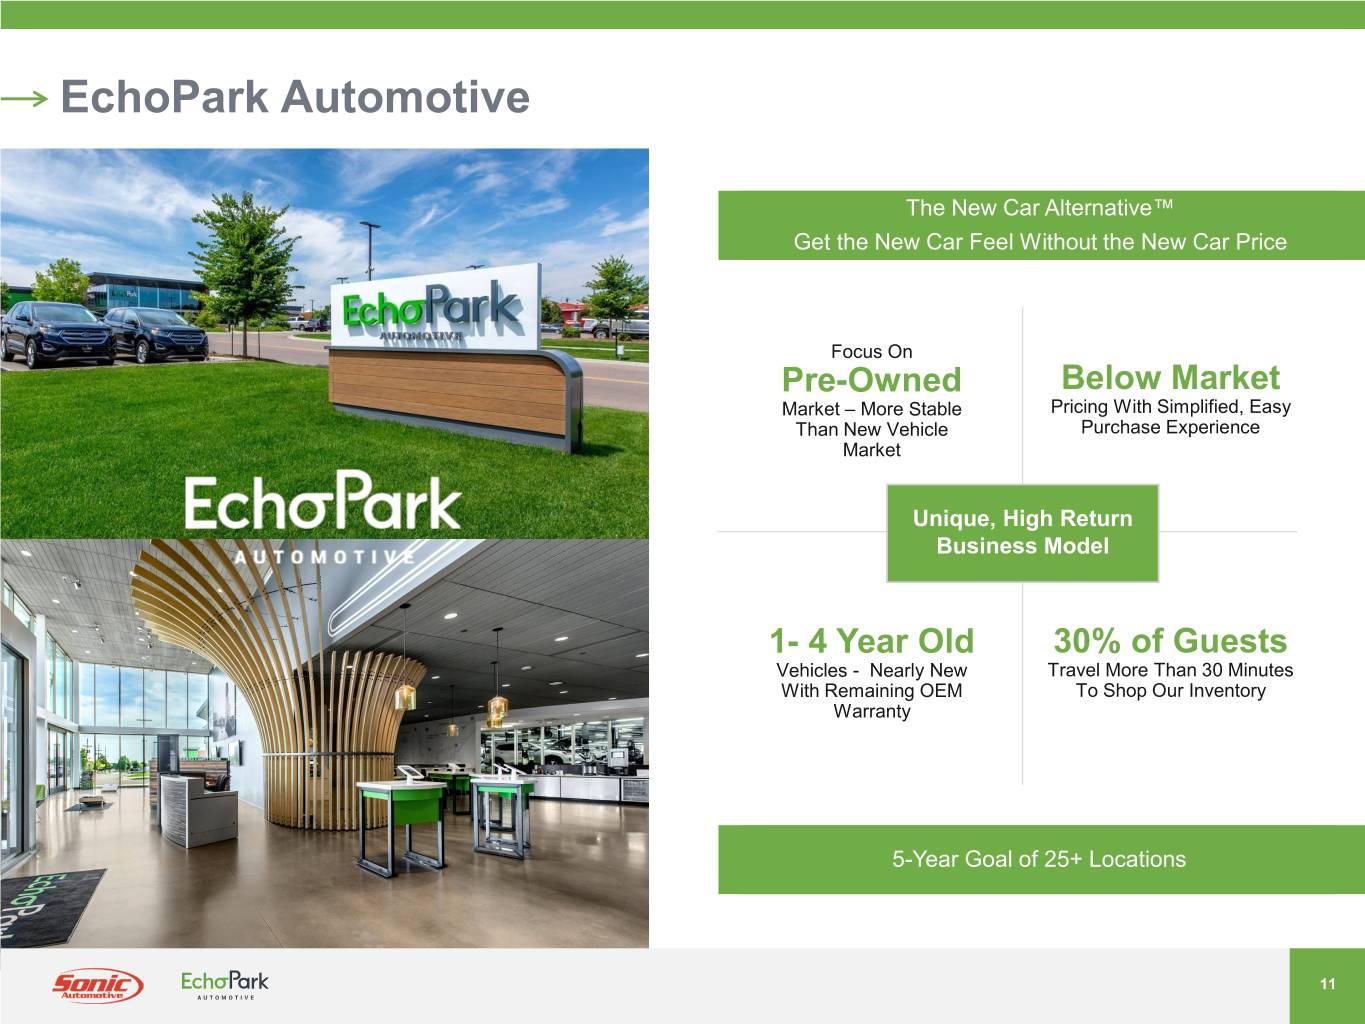
EchoPark Automotive The New Car Alternative™ Get the New Car Feel Without the New Car Price Focus On Pre-Owned Below Market Market – More Stable Pricing With Simplified, Easy Than New Vehicle Purchase Experience Market Unique, High Return Business Model 1- 4 Year Old 30% of Guests Vehicles - Nearly New Travel More Than 30 Minutes With Remaining OEM To Shop Our Inventory Warranty 5-Year Goal of 25+ Locations 11
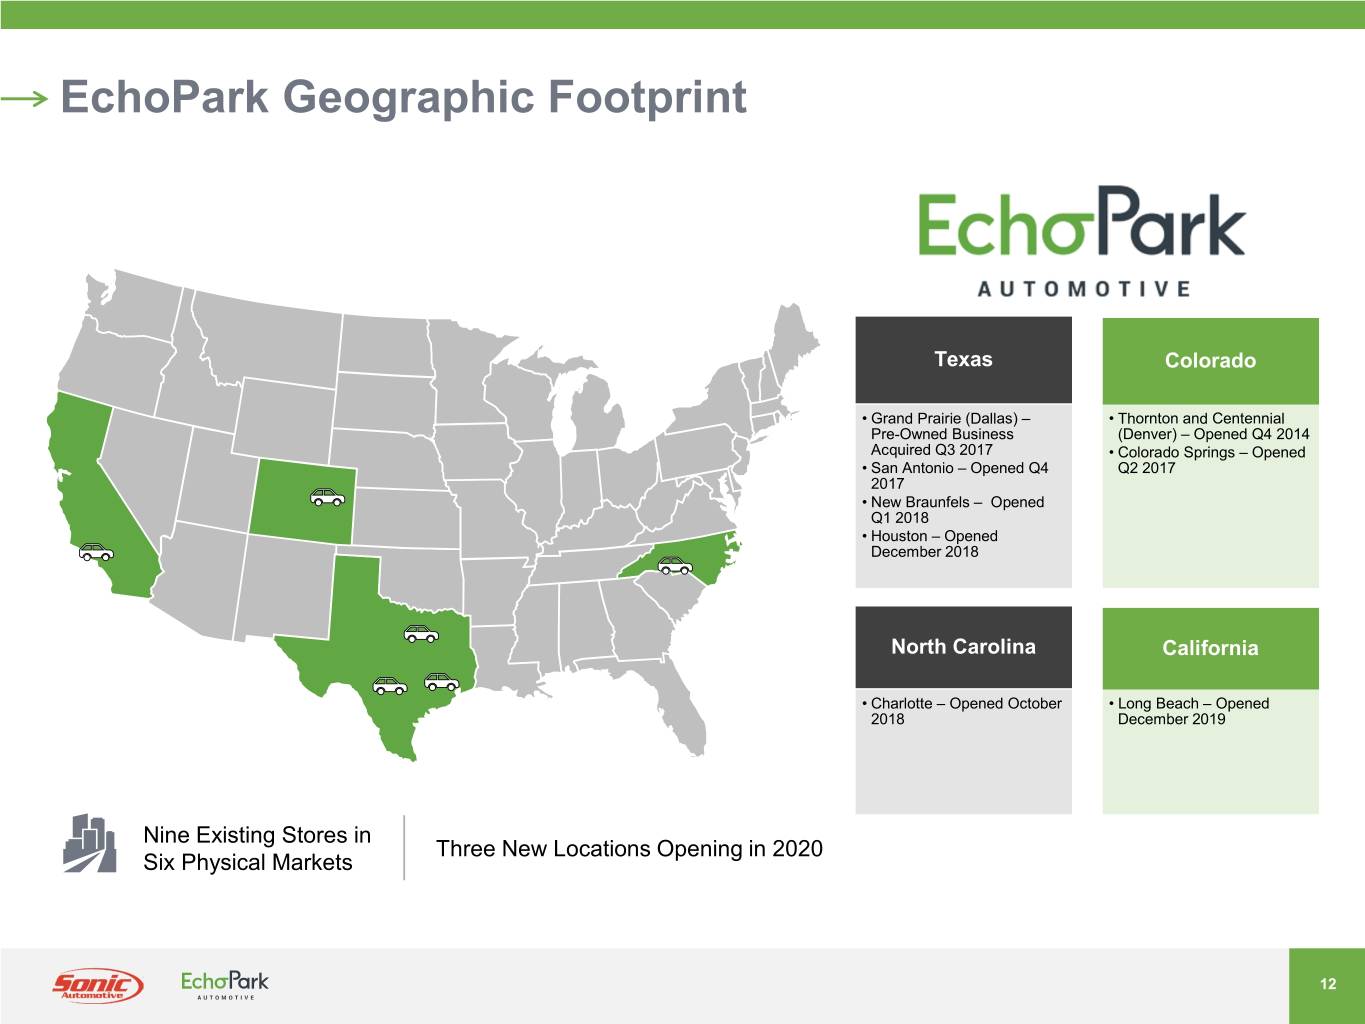
EchoPark Geographic Footprint Texas Colorado • Grand Prairie (Dallas) – • Thornton and Centennial Pre-Owned Business (Denver) – Opened Q4 2014 Acquired Q3 2017 • Colorado Springs – Opened • San Antonio – Opened Q4 Q2 2017 2017 • New Braunfels – Opened Q1 2018 • Houston – Opened December 2018 North Carolina California • Charlotte – Opened October • Long Beach – Opened 2018 December 2019 Nine Existing Stores in Three New Locations Opening in 2020 Six Physical Markets 12
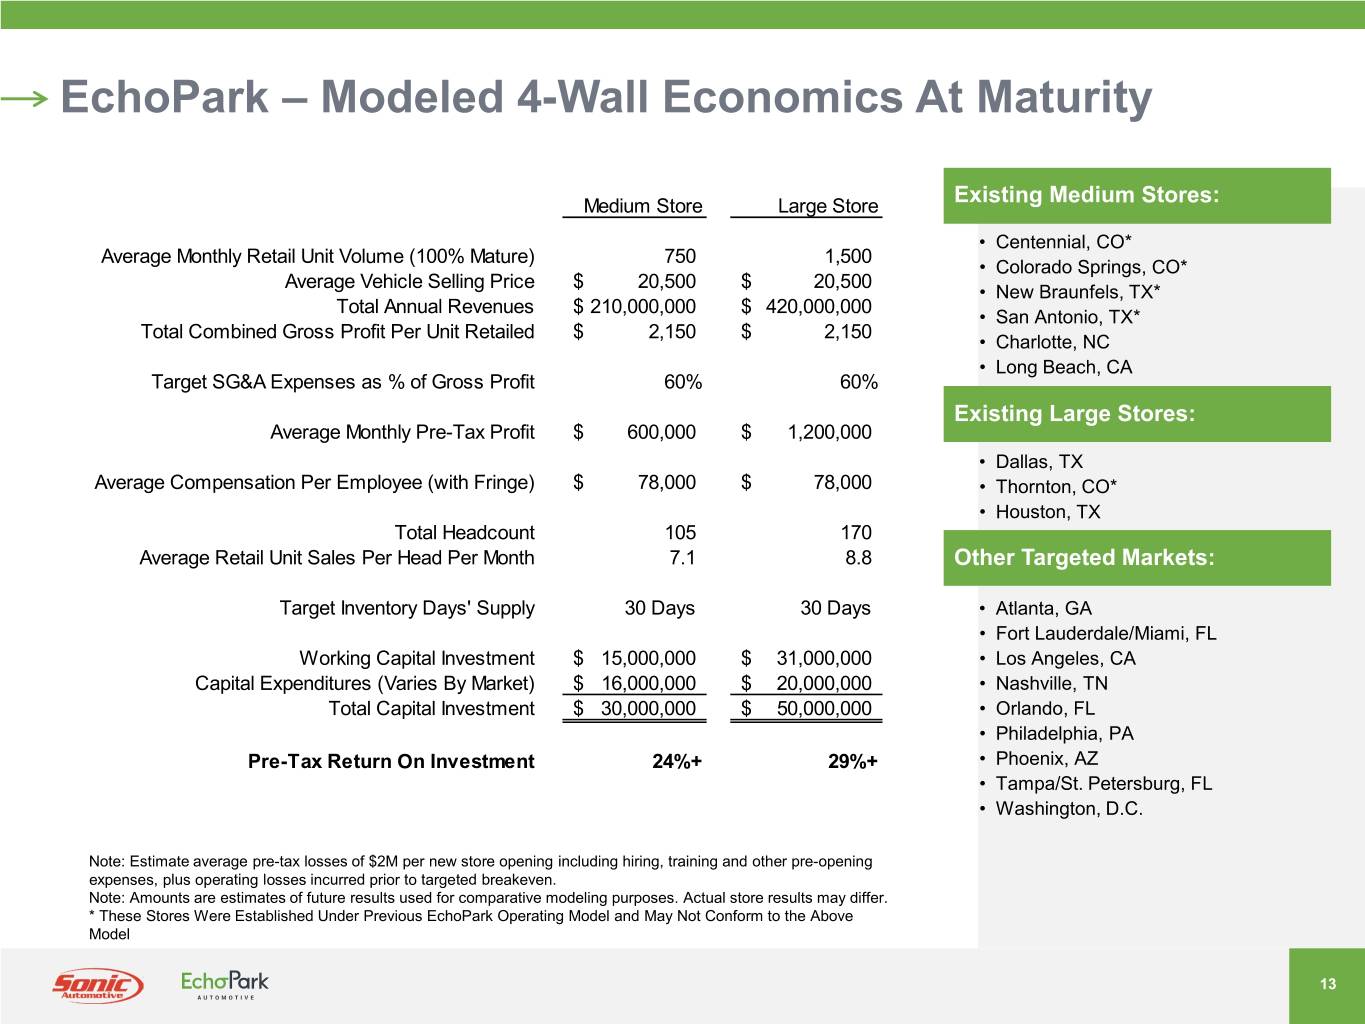
EchoPark – Modeled 4-Wall Economics At Maturity Medium Store Large Store Existing Medium Stores: • Centennial, CO* Average Monthly Retail Unit Volume (100% Mature) 750 1,500 • Colorado Springs, CO* Average Vehicle Selling Price $ 20,500 $ 20,500 • New Braunfels, TX* Total Annual Revenues $ 210,000,000 $ 420,000,000 • San Antonio, TX* Total Combined Gross Profit Per Unit Retailed $ 2,150 $ 2,150 • Charlotte, NC • Long Beach, CA Target SG&A Expenses as % of Gross Profit 60% 60% Existing Large Stores: Average Monthly Pre-Tax Profit $ 600,000 $ 1,200,000 • Dallas, TX Average Compensation Per Employee (with Fringe) $ 78,000 $ 78,000 • Thornton, CO* • Houston, TX Total Headcount 105 170 Average Retail Unit Sales Per Head Per Month 7.1 8.8 Other Targeted Markets: Target Inventory Days' Supply 30 Days 30 Days • Atlanta, GA • Fort Lauderdale/Miami, FL Working Capital Investment $ 15,000,000 $ 31,000,000 • Los Angeles, CA Capital Expenditures (Varies By Market) $ 16,000,000 $ 20,000,000 • Nashville, TN Total Capital Investment $ 30,000,000 $ 50,000,000 • Orlando, FL • Philadelphia, PA Pre-Tax Return On Investment 24%+ 29%+ • Phoenix, AZ • Tampa/St. Petersburg, FL • Washington, D.C. Note: Estimate average pre-tax losses of $2M per new store opening including hiring, training and other pre-opening expenses, plus operating losses incurred prior to targeted breakeven. Note: Amounts are estimates of future results used for comparative modeling purposes. Actual store results may differ. * These Stores Were Established Under Previous EchoPark Operating Model and May Not Conform to the Above Model 13
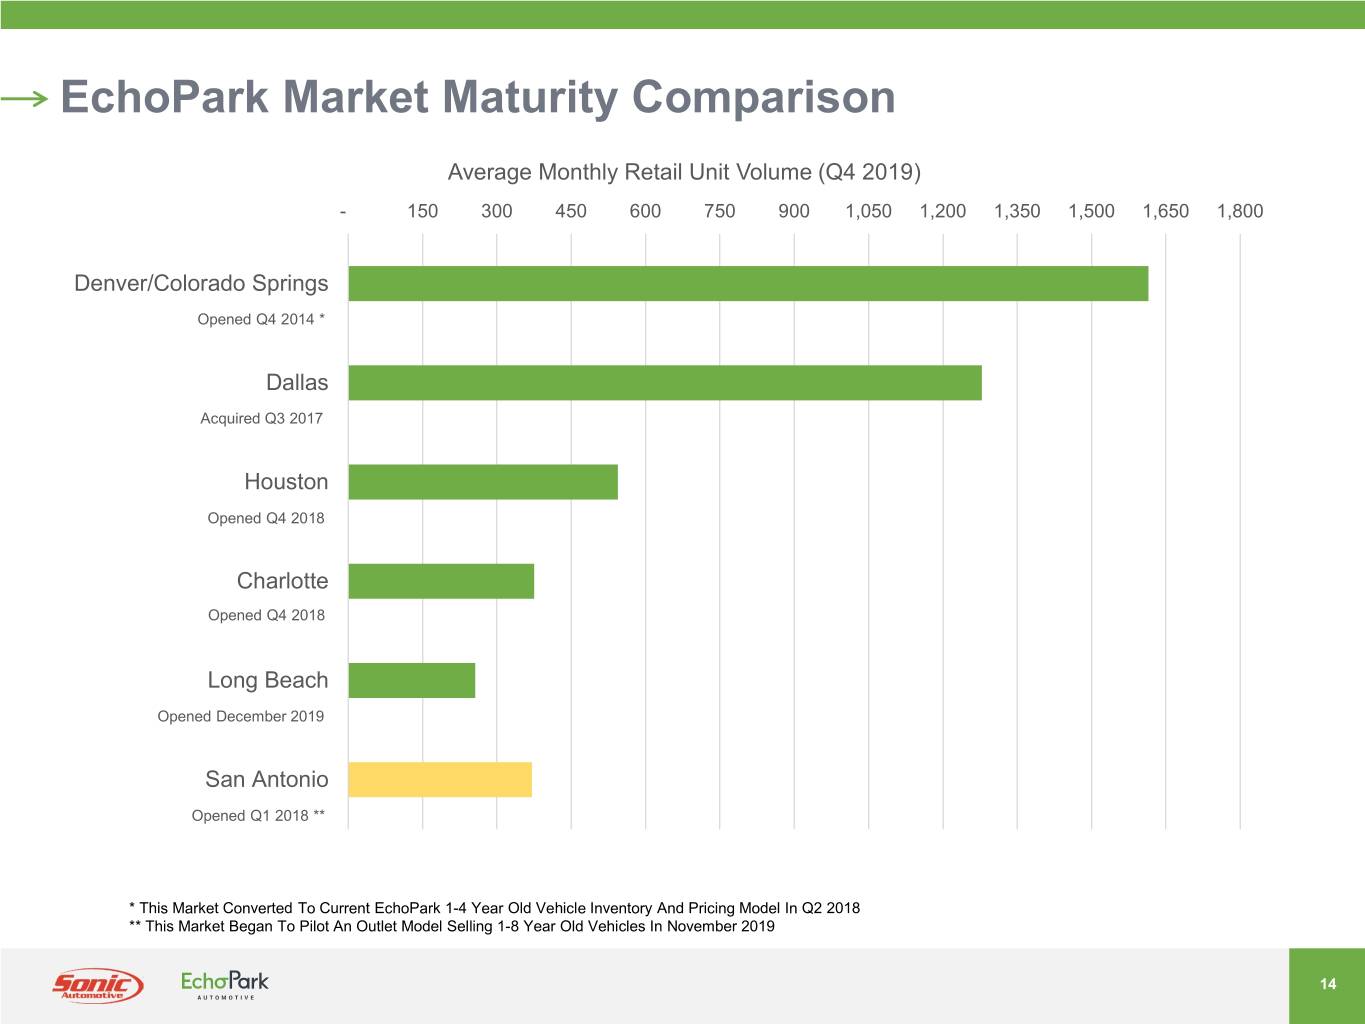
EchoPark Market Maturity Comparison Average Monthly Retail Unit Volume (Q4 2019) - 150 300 450 600 750 900 1,050 1,200 1,350 1,500 1,650 1,800 Denver/Colorado Springs Opened Q4 2014 * Dallas Acquired Q3 2017 Houston Opened Q4 2018 Charlotte Opened Q4 2018 Long Beach Opened December 2019 San Antonio Opened Q1 2018 ** * This Market Converted To Current EchoPark 1-4 Year Old Vehicle Inventory And Pricing Model In Q2 2018 ** This Market Began To Pilot An Outlet Model Selling 1-8 Year Old Vehicles In November 2019 14 14
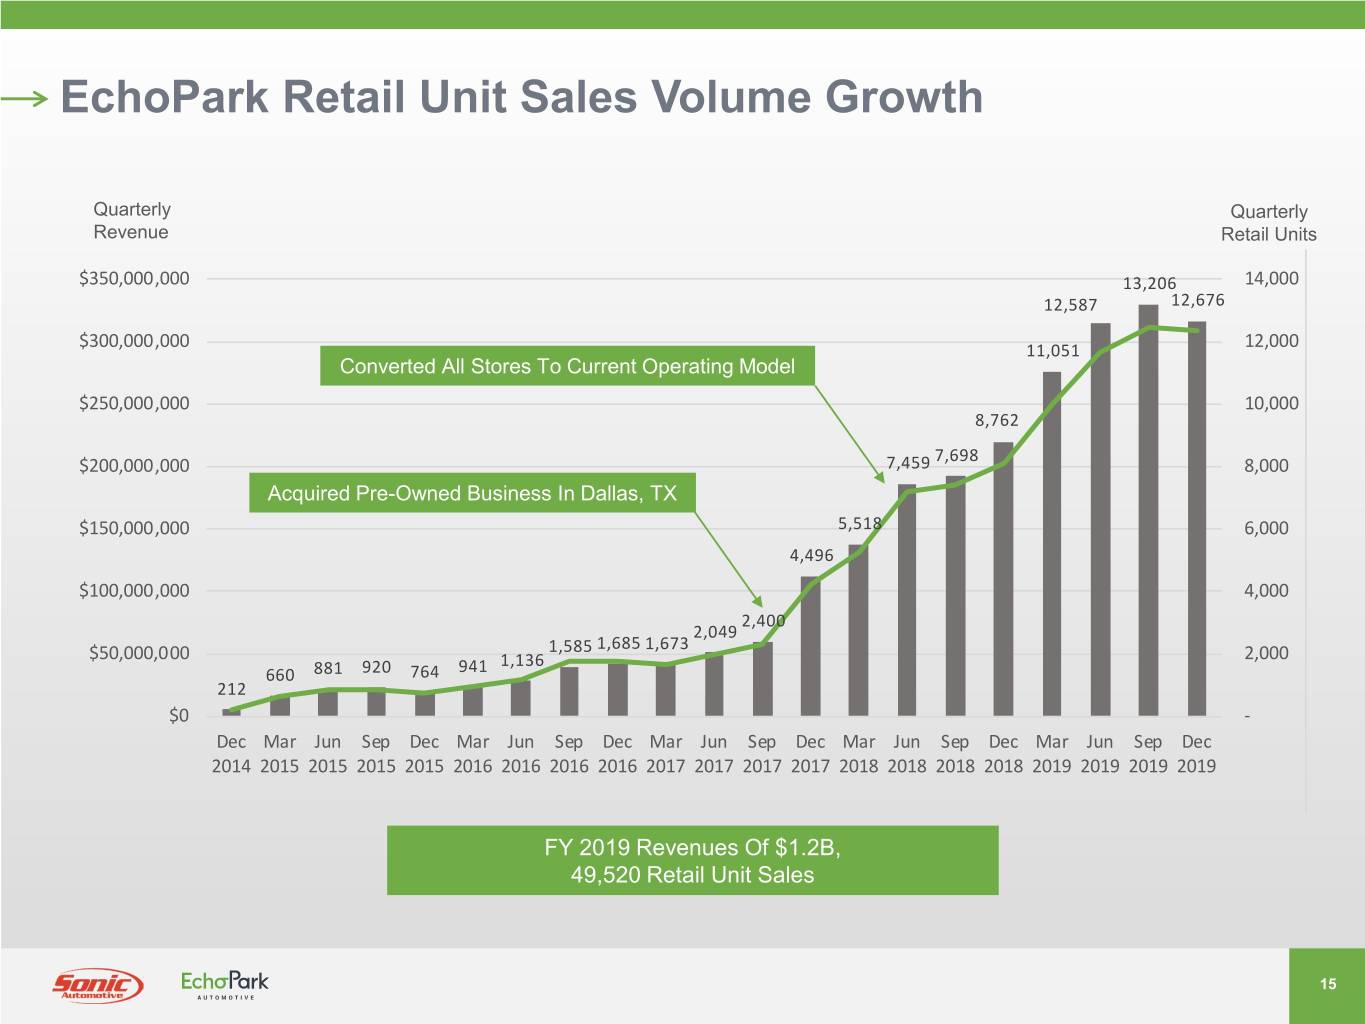
EchoPark Retail Unit Sales Volume Growth Quarterly Quarterly Revenue Retail Units $350,000,000 13,206 14,000 12,587 12,676 $300,000,000 11,051 12,000 Converted All Stores To Current Operating Model $250,000,000 10,000 8,762 7,698 $200,000,000 7,459 8,000 Acquired Pre-Owned Business In Dallas, TX $150,000,000 5,518 6,000 4,496 $100,000,000 4,000 2,400 2,049 1,585 1,685 1,673 $50,000,000 1,136 2,000 660 881 920 764 941 212 $0 - Dec Mar Jun Sep Dec Mar Jun Sep Dec Mar Jun Sep Dec Mar Jun Sep Dec Mar Jun Sep Dec 2014 2015 2015 2015 2015 2016 2016 2016 2016 2017 2017 2017 2017 2018 2018 2018 2018 2019 2019 2019 2019 FY 2019 Revenues Of $1.2B, 49,520 Retail Unit Sales 15
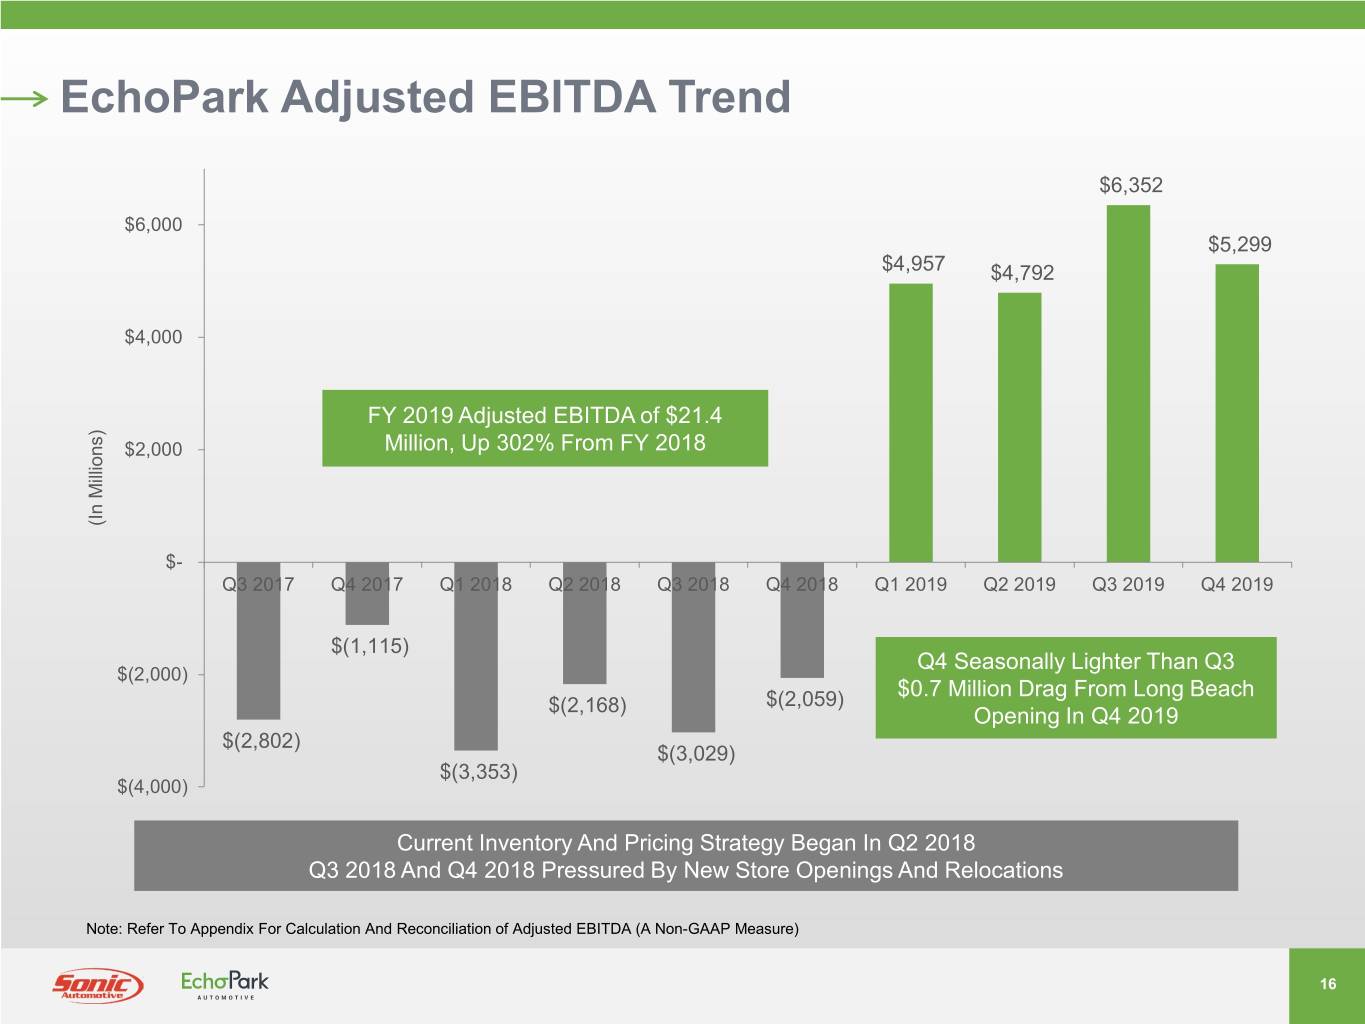
EchoPark Adjusted EBITDA Trend $6,352 $6,000 $5,299 $4,957 $4,792 $4,000 FY 2019 Adjusted EBITDA of $21.4 $2,000 Million, Up 302% From FY 2018 (In Millions) $- Q3 2017 Q4 2017 Q1 2018 Q2 2018 Q3 2018 Q4 2018 Q1 2019 Q2 2019 Q3 2019 Q4 2019 $(1,115) Q4 Seasonally Lighter Than Q3 $(2,000) $(2,059) $0.7 Million Drag From Long Beach $(2,168) Opening In Q4 2019 $(2,802) $(3,029) $(3,353) $(4,000) Current Inventory And Pricing Strategy Began In Q2 2018 Q3 2018 And Q4 2018 Pressured By New Store Openings And Relocations Note: Refer To Appendix For Calculation And Reconciliation of Adjusted EBITDA (A Non-GAAP Measure) 16
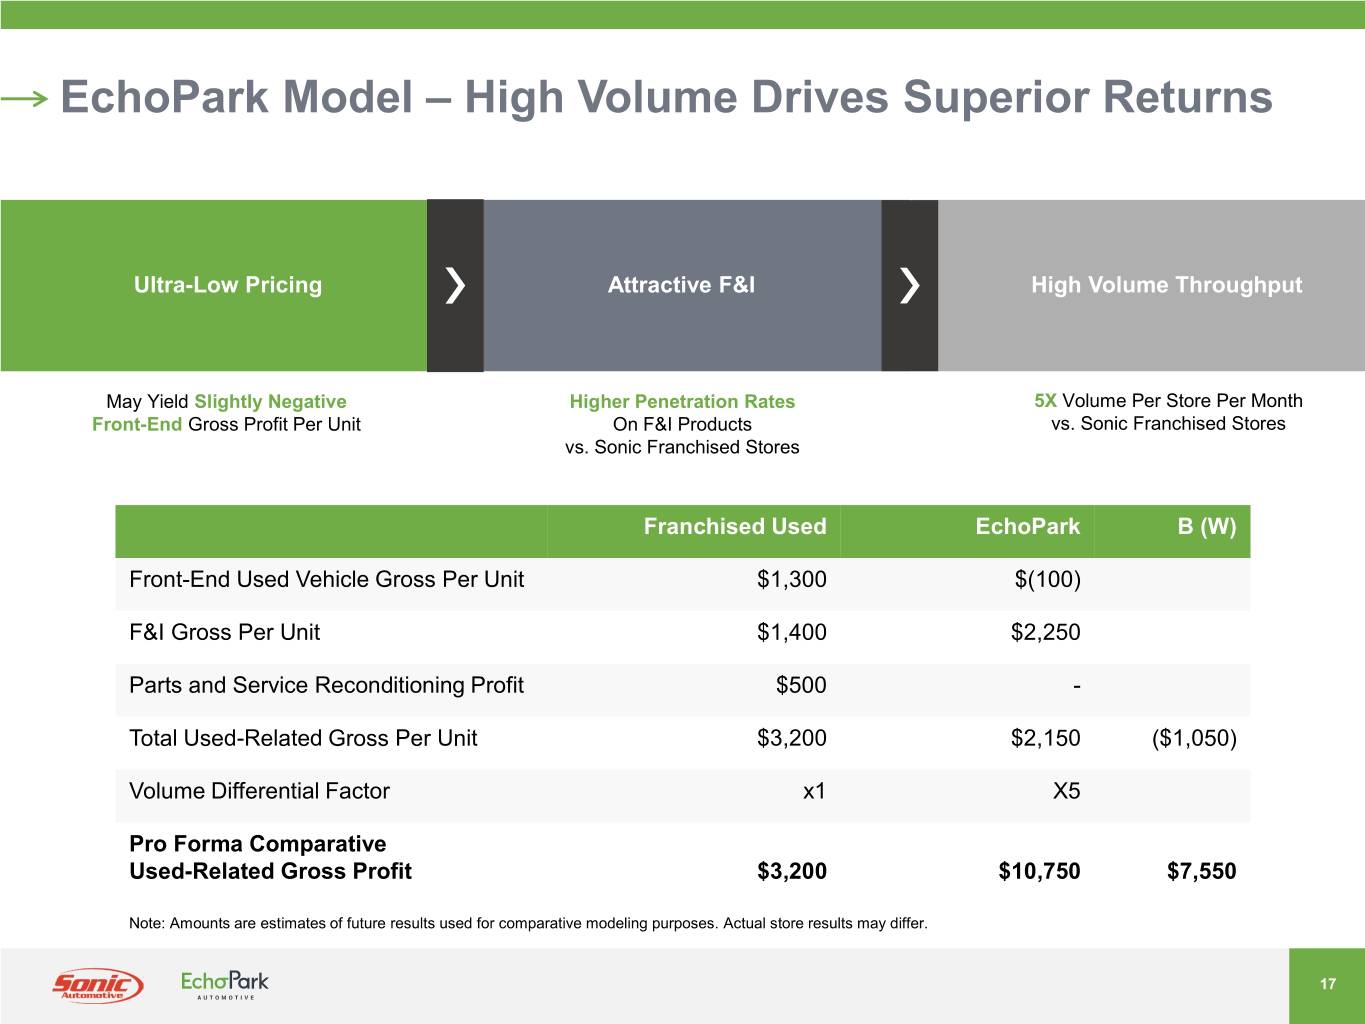
EchoPark Model – High Volume Drives Superior Returns Ultra-Low Pricing Attractive F&I High Volume Throughput May Yield Slightly Negative Higher Penetration Rates 5X Volume Per Store Per Month Front-End Gross Profit Per Unit On F&I Products vs. Sonic Franchised Stores vs. Sonic Franchised Stores Franchised Used EchoPark B (W) Front-End Used Vehicle Gross Per Unit $1,300 $(100) F&I Gross Per Unit $1,400 $2,250 Parts and Service Reconditioning Profit $500 - Total Used-Related Gross Per Unit $3,200 $2,150 ($1,050) Volume Differential Factor x1 X5 Pro Forma Comparative Used-Related Gross Profit $3,200 $10,750 $7,550 Note: Amounts are estimates of future results used for comparative modeling purposes. Actual store results may differ. 17 17
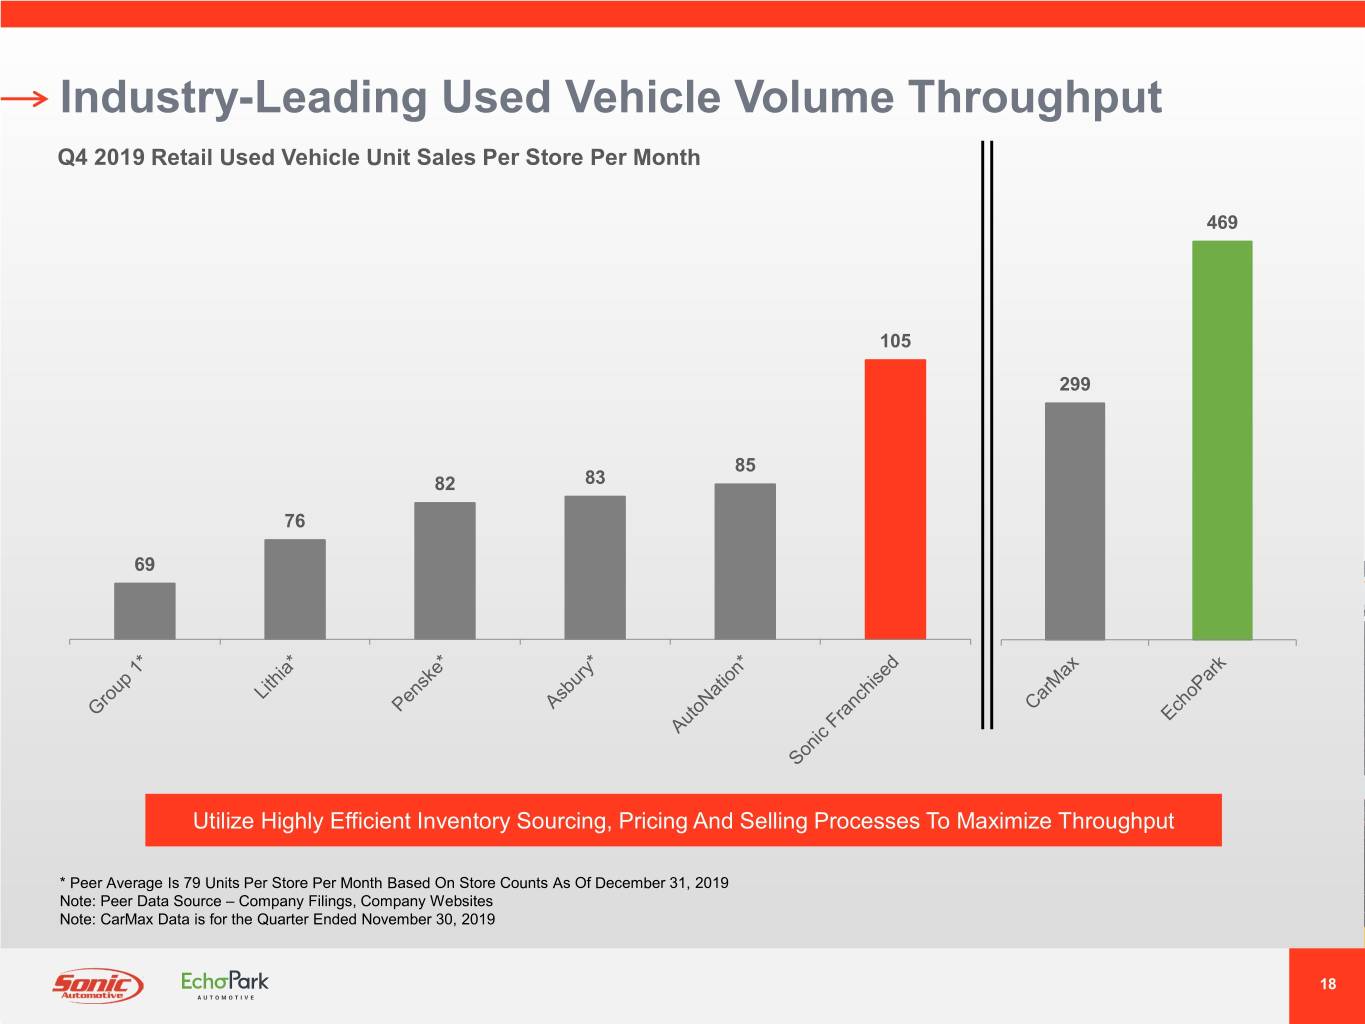
Industry-Leading Used Vehicle Volume Throughput Q4 2019 Retail Used Vehicle Unit Sales Per Store Per Month 469 105 299 85 82 83 76 69 Utilize Highly Efficient Inventory Sourcing, Pricing And Selling Processes To Maximize Throughput * Peer Average Is 79 Units Per Store Per Month Based On Store Counts As Of December 31, 2019 Note: Peer Data Source – Company Filings, Company Websites Note: CarMax Data is for the Quarter Ended November 30, 2019 18
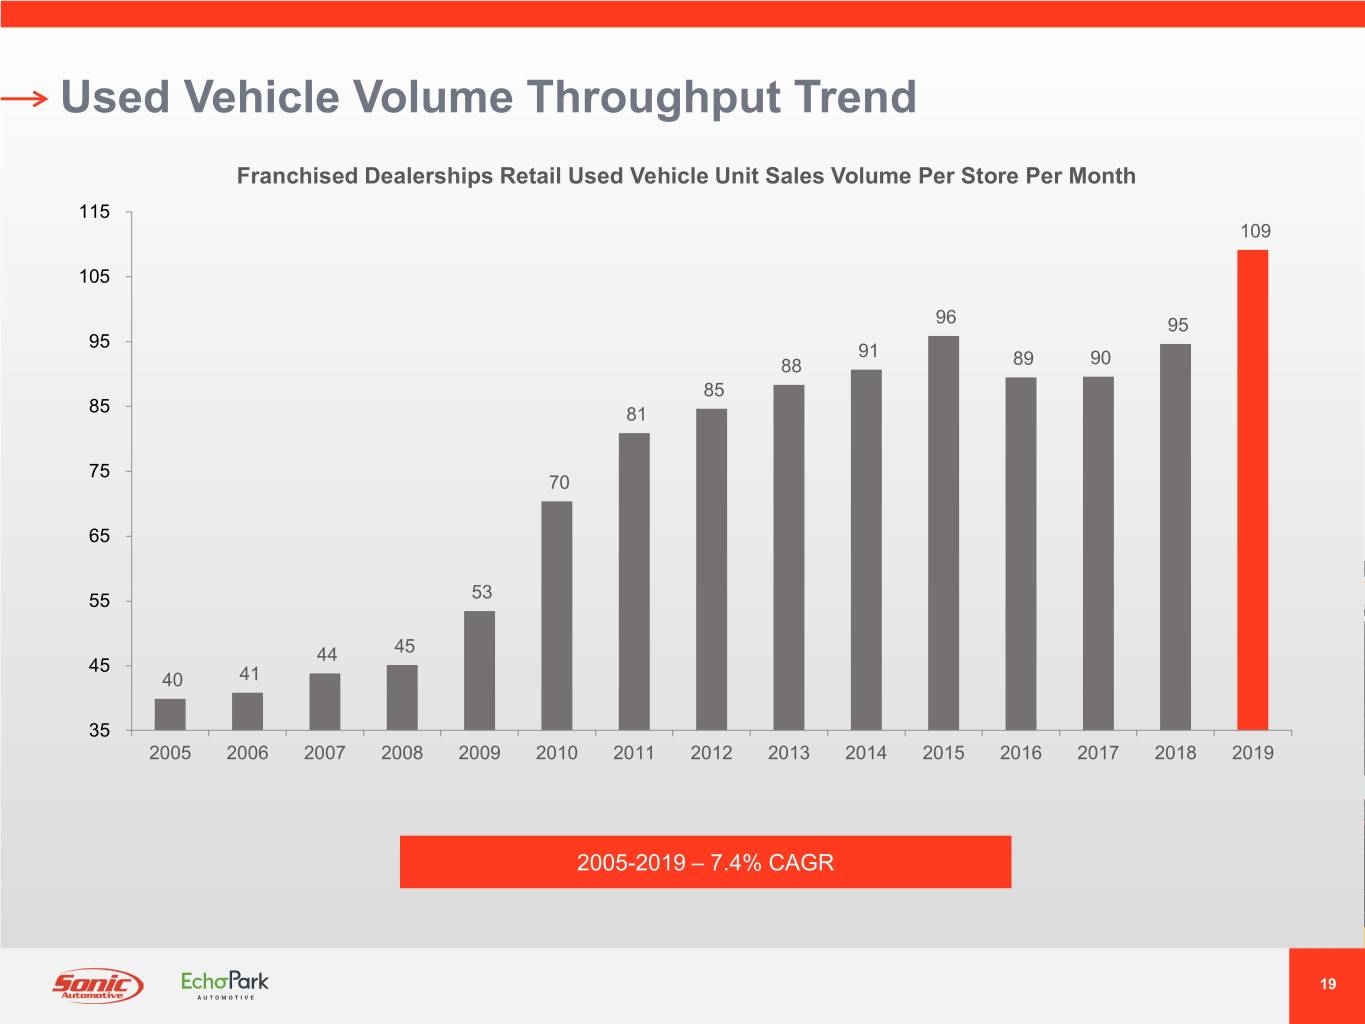
Used Vehicle Volume Throughput Trend Franchised Dealerships Retail Used Vehicle Unit Sales Volume Per Store Per Month 115 109 105 96 95 95 91 88 89 90 85 85 81 75 70 65 55 53 44 45 45 40 41 35 2005 2006 2007 2008 2009 2010 2011 2012 2013 2014 2015 2016 2017 2018 2019 2005-2019 – 7.4% CAGR 19
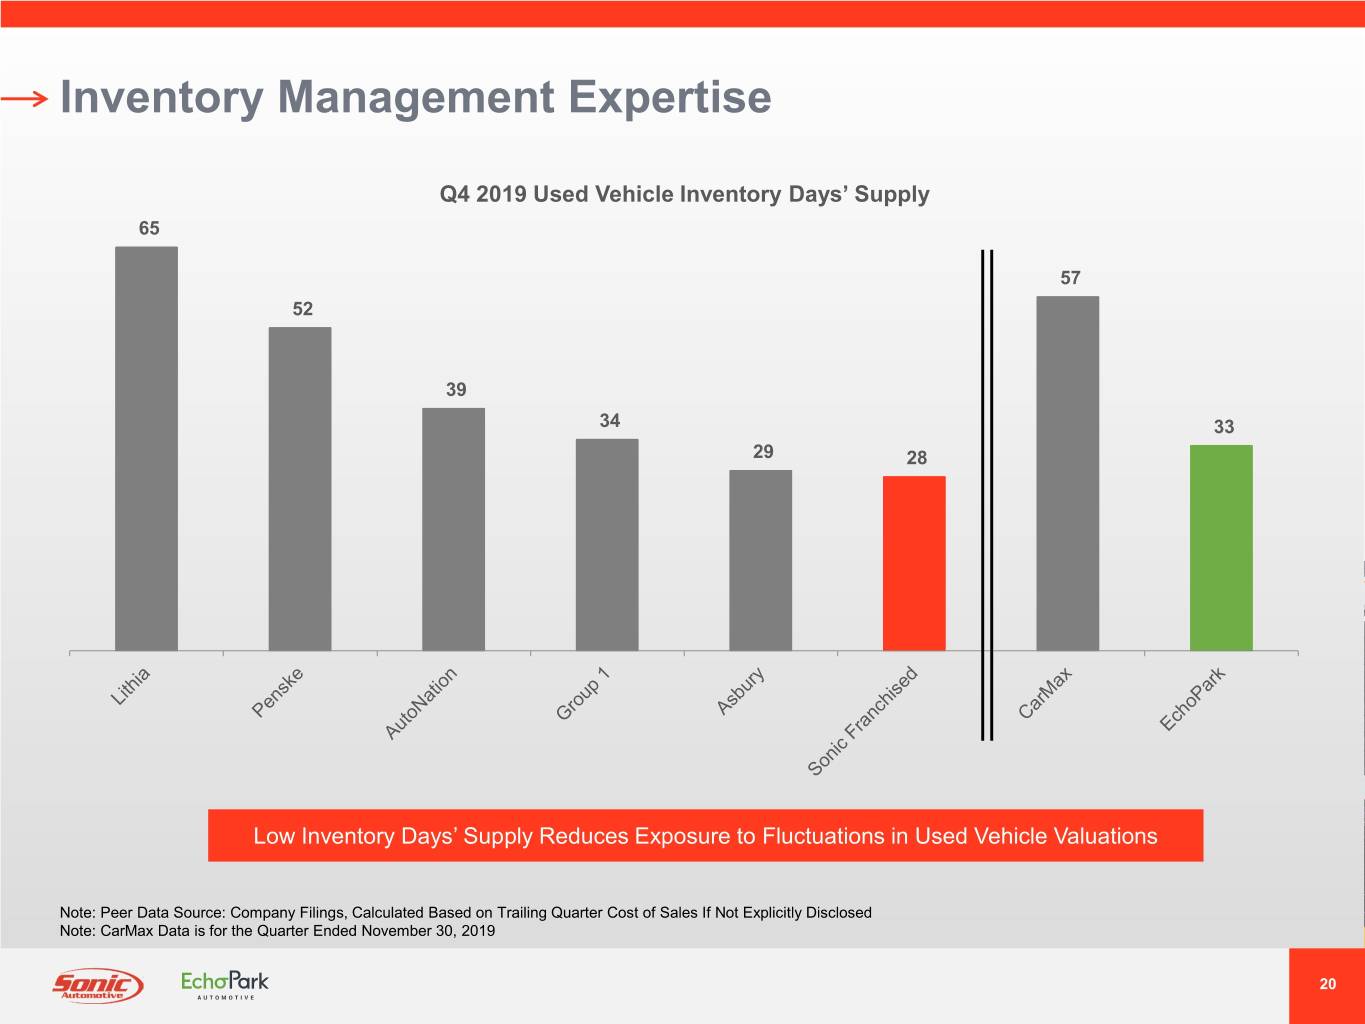
Inventory Management Expertise Q4 2019 Used Vehicle Inventory Days’ Supply 65 57 52 39 34 33 29 28 Low Inventory Days’ Supply Reduces Exposure to Fluctuations in Used Vehicle Valuations Note: Peer Data Source: Company Filings, Calculated Based on Trailing Quarter Cost of Sales If Not Explicitly Disclosed Note: CarMax Data is for the Quarter Ended November 30, 2019 20
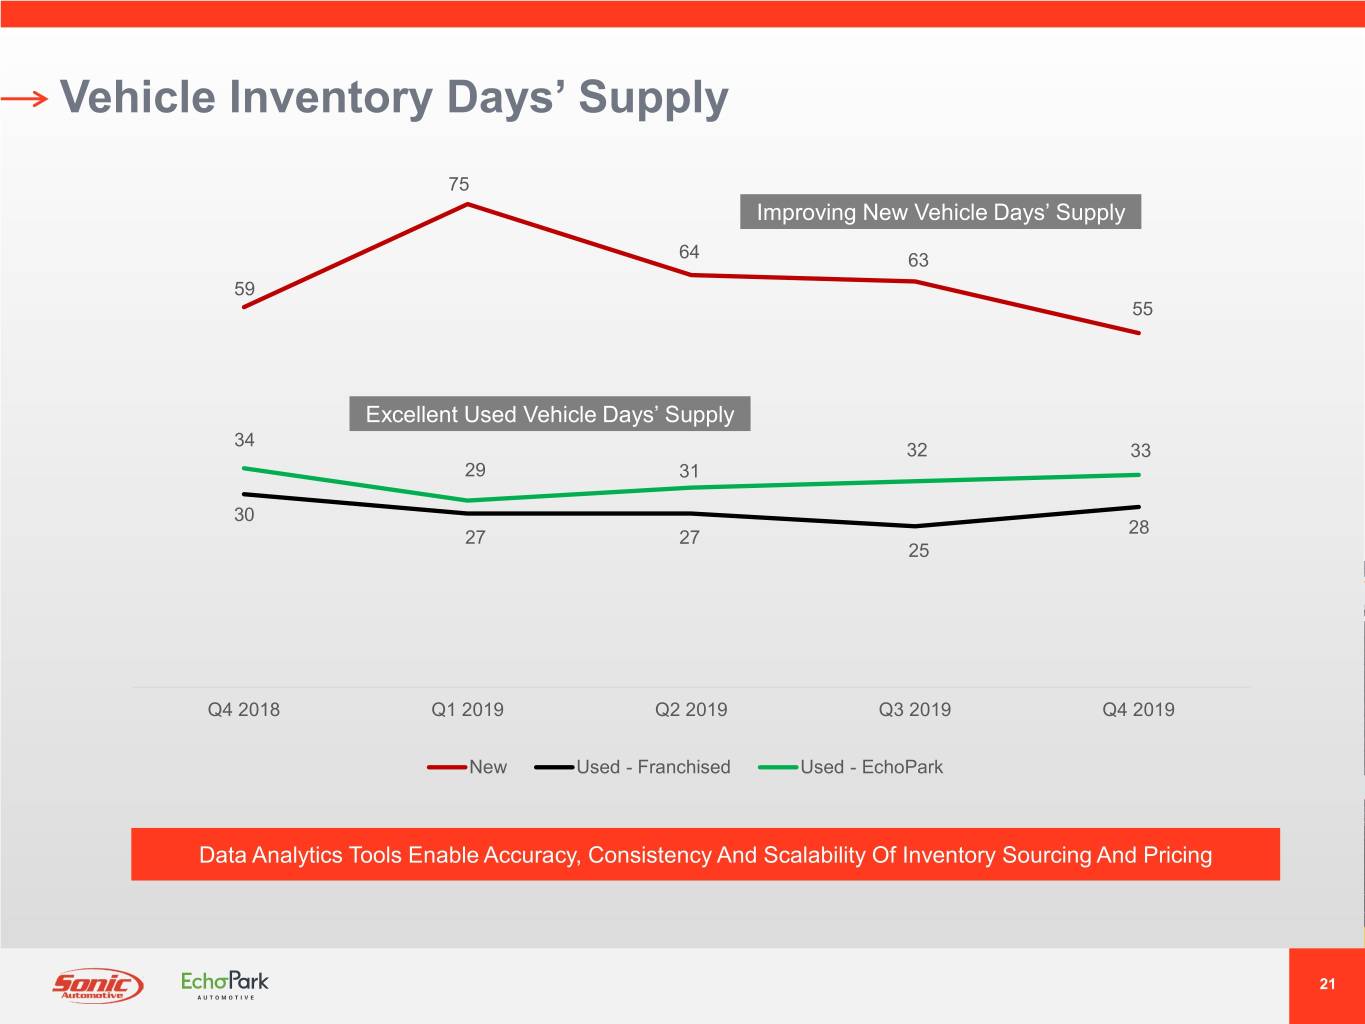
Vehicle Inventory Days’ Supply 75 Improving New Vehicle Days’ Supply 64 63 59 55 Excellent Used Vehicle Days’ Supply 34 32 33 29 31 30 28 27 27 25 Q4 2018 Q1 2019 Q2 2019 Q3 2019 Q4 2019 New Used - Franchised Used - EchoPark Data Analytics Tools Enable Accuracy, Consistency And Scalability Of Inventory Sourcing And Pricing 21
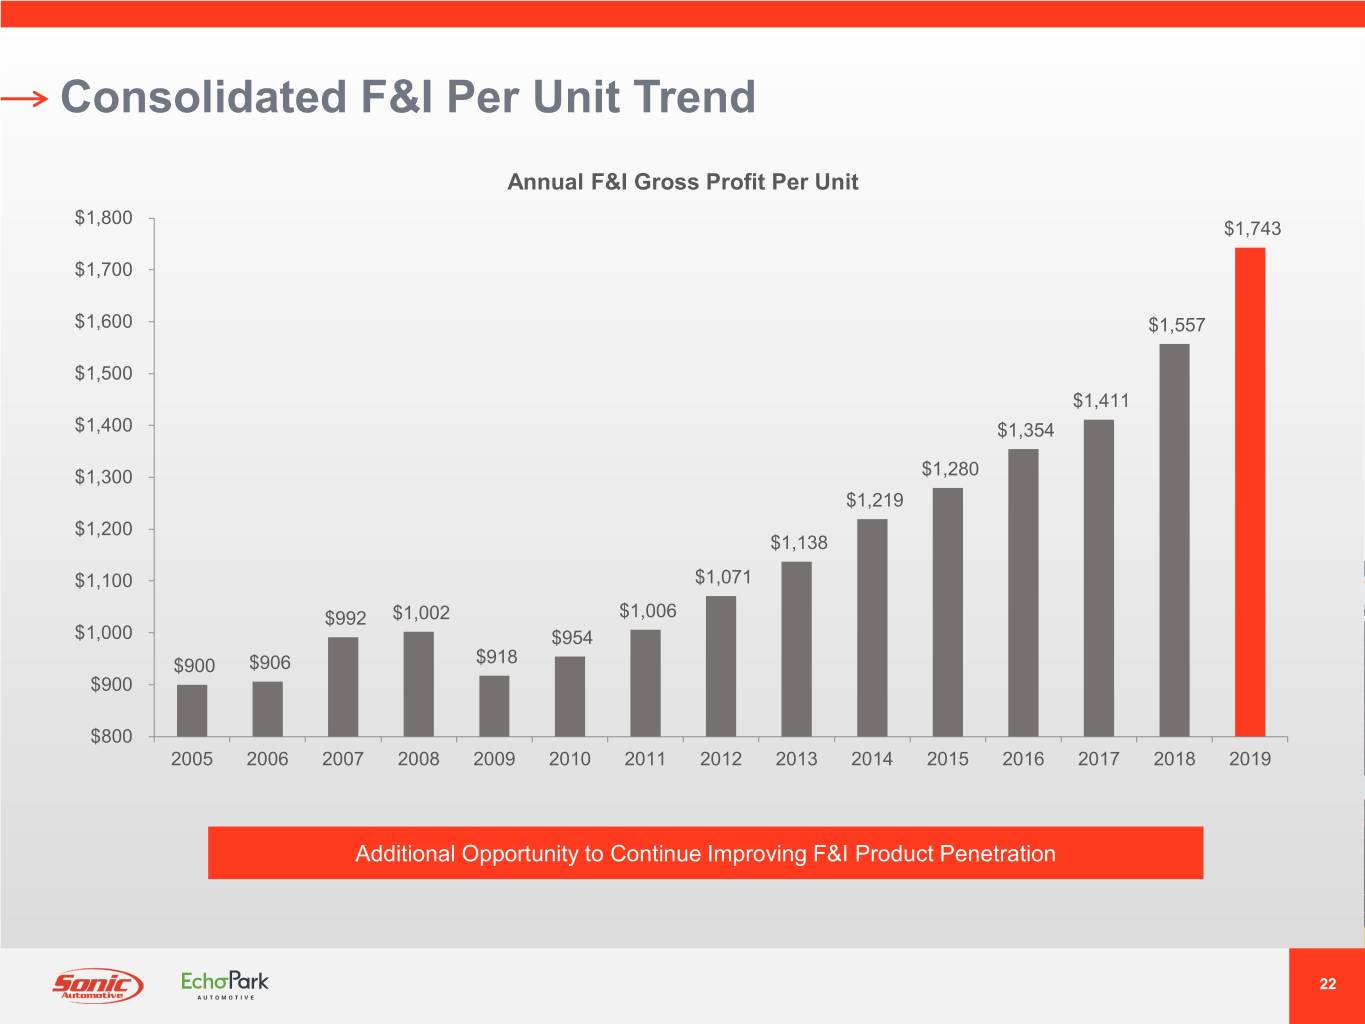
Consolidated F&I Per Unit Trend Annual F&I Gross Profit Per Unit $1,800 $1,743 $1,700 $1,600 $1,557 $1,500 $1,411 $1,400 $1,354 $1,300 $1,280 $1,219 $1,200 $1,138 $1,100 $1,071 $992 $1,002 $1,006 $1,000 $954 $900 $906 $918 $900 $800 2005 2006 2007 2008 2009 2010 2011 2012 2013 2014 2015 2016 2017 2018 2019 Additional Opportunity to Continue Improving F&I Product Penetration 22
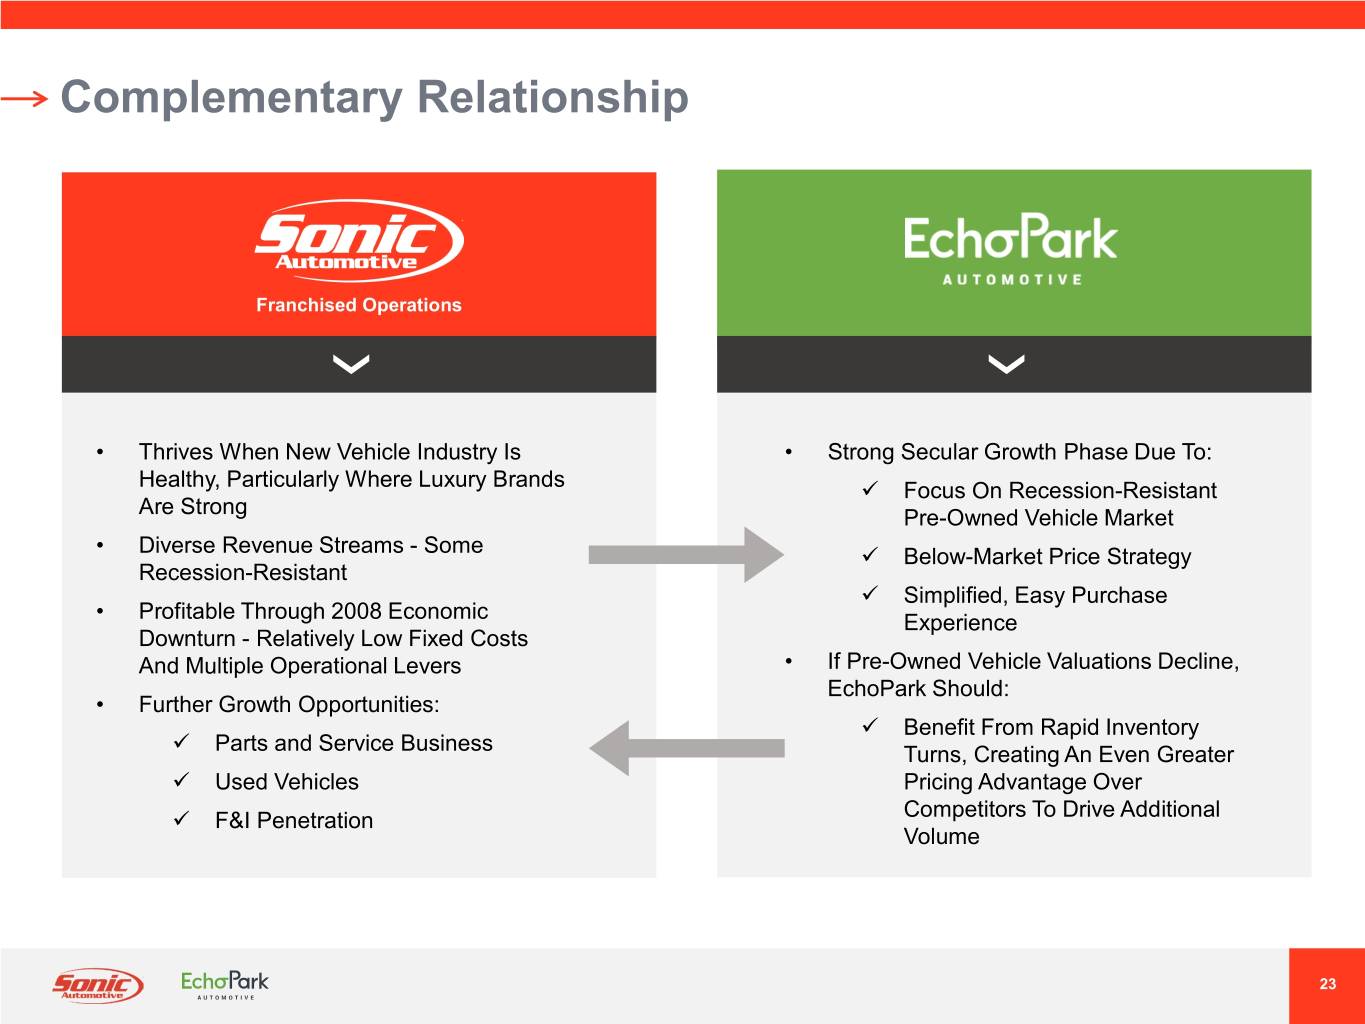
Complementary Relationship Franchised Operations • Thrives When New Vehicle Industry Is • Strong Secular Growth Phase Due To: Healthy, Particularly Where Luxury Brands Focus On Recession-Resistant Are Strong Pre-Owned Vehicle Market • Diverse Revenue Streams - Some Below-Market Price Strategy Recession-Resistant Simplified, Easy Purchase • Profitable Through 2008 Economic Experience Downturn - Relatively Low Fixed Costs And Multiple Operational Levers • If Pre-Owned Vehicle Valuations Decline, EchoPark Should: • Further Growth Opportunities: Benefit From Rapid Inventory Parts and Service Business Turns, Creating An Even Greater Used Vehicles Pricing Advantage Over F&I Penetration Competitors To Drive Additional Volume 23
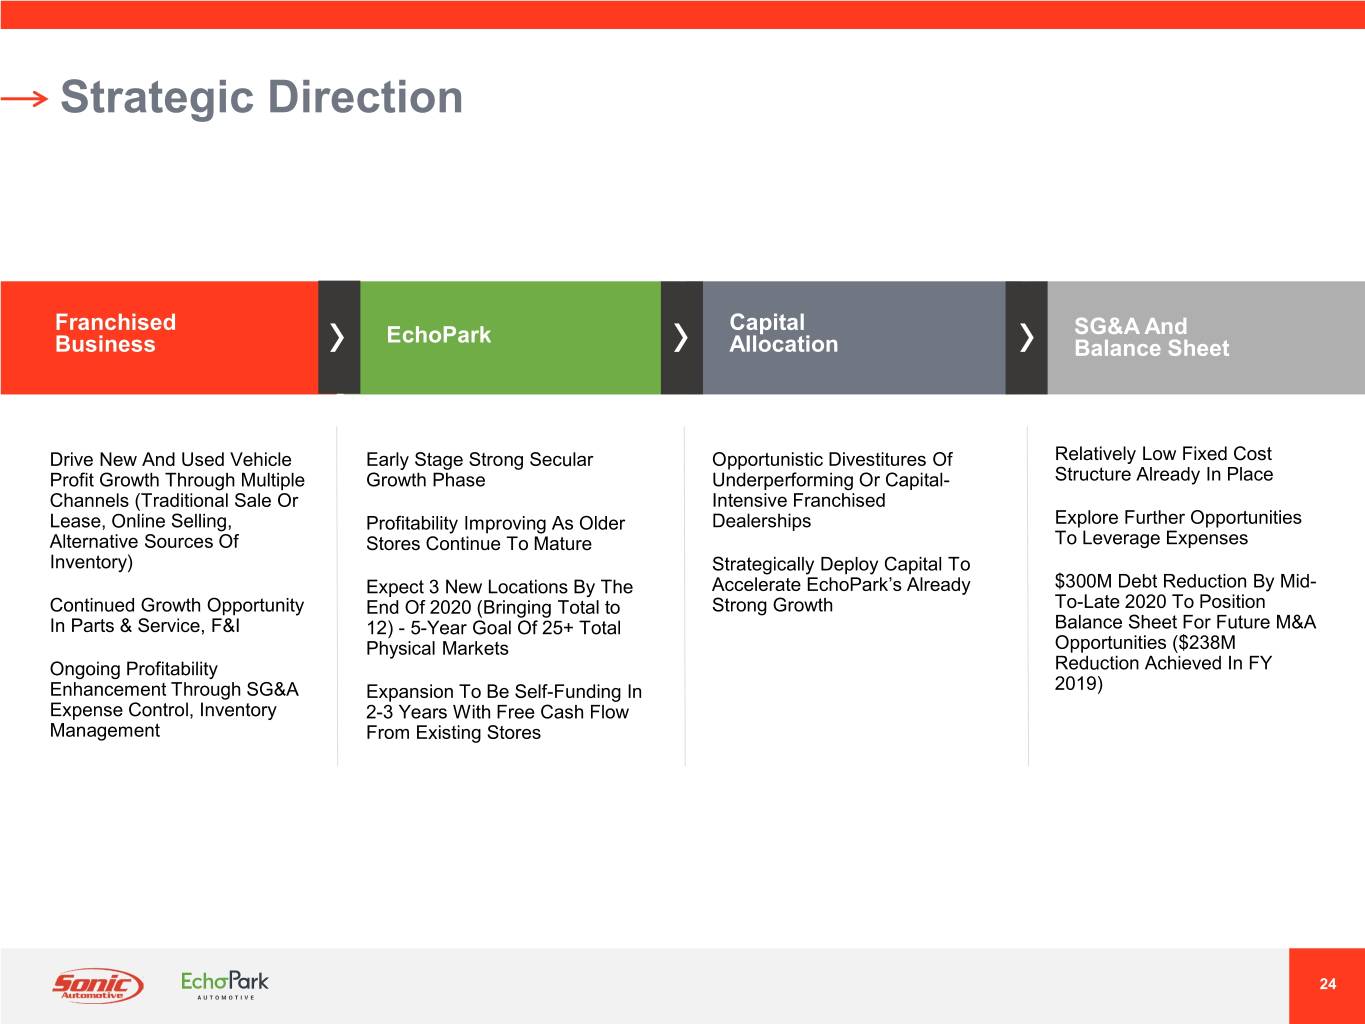
Strategic Direction Franchised Capital EchoPark SG&A And Business Allocation Balance Sheet Drive New And Used Vehicle Early Stage Strong Secular Opportunistic Divestitures Of Relatively Low Fixed Cost Profit Growth Through Multiple Growth Phase Underperforming Or Capital- Structure Already In Place Channels (Traditional Sale Or Intensive Franchised Lease, Online Selling, Profitability Improving As Older Dealerships Explore Further Opportunities Alternative Sources Of Stores Continue To Mature To Leverage Expenses Inventory) Strategically Deploy Capital To Expect 3 New Locations By The Accelerate EchoPark’s Already $300M Debt Reduction By Mid- Continued Growth Opportunity End Of 2020 (Bringing Total to Strong Growth To-Late 2020 To Position In Parts & Service, F&I 12) - 5-Year Goal Of 25+ Total Balance Sheet For Future M&A Physical Markets Opportunities ($238M Ongoing Profitability Reduction Achieved In FY Enhancement Through SG&A Expansion To Be Self-Funding In 2019) Expense Control, Inventory 2-3 Years With Free Cash Flow Management From Existing Stores 24
FINANCIAL OVERVIEW 25
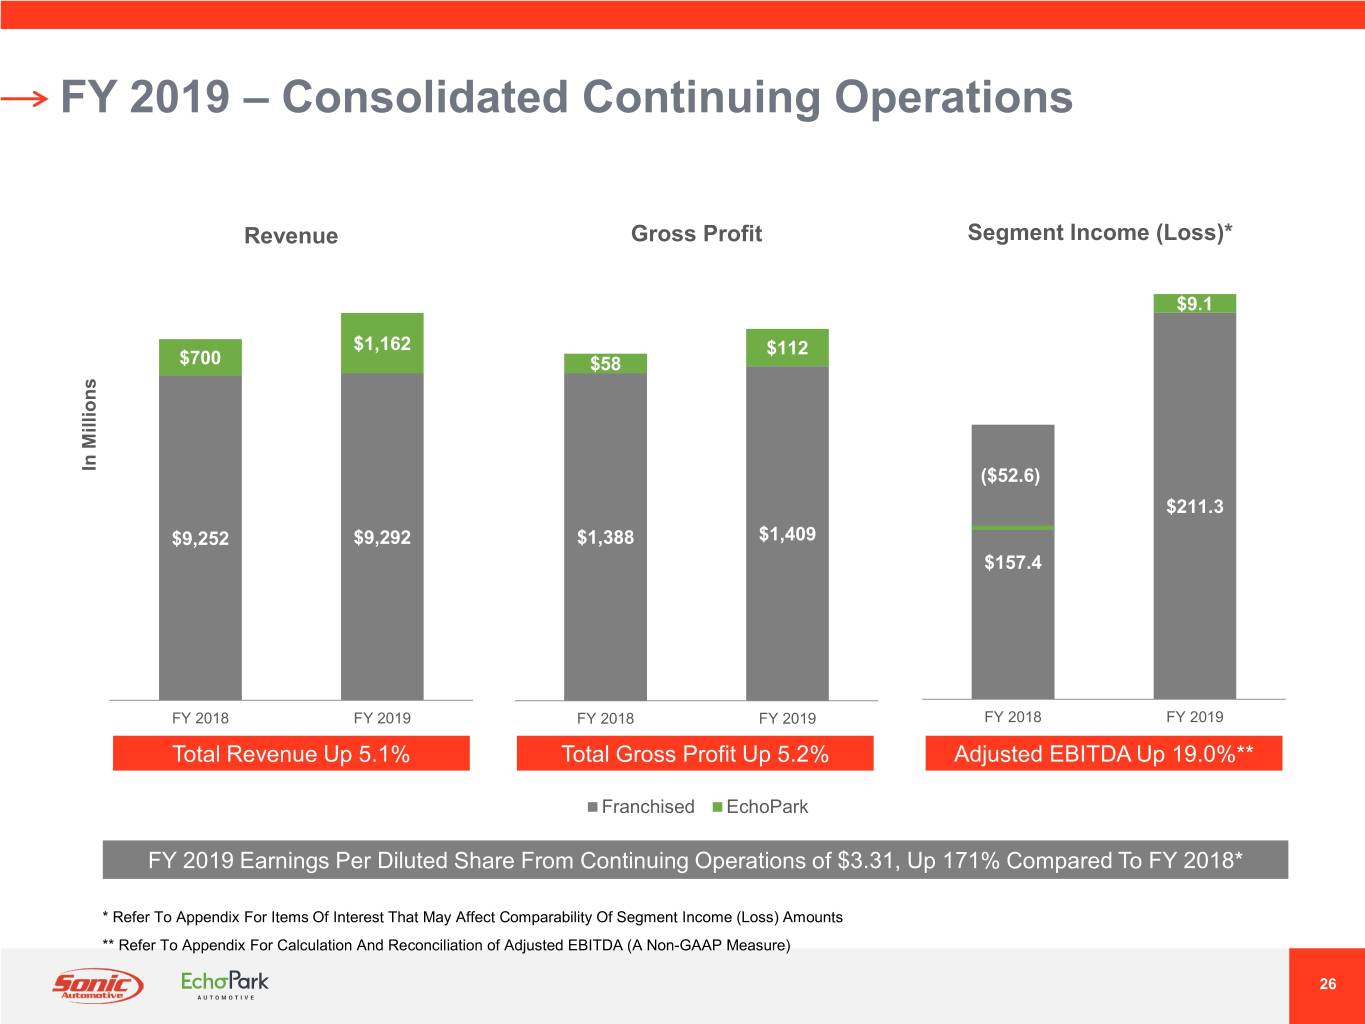
FY 2019 – Consolidated Continuing Operations Revenue Gross Profit Segment Income (Loss)* $9.1 $1,162 $112 $700 $58 In Millions ($52.6) $211.3 $9,252 $9,292 $1,388 $1,409 $157.4 FY 2018 FY 2019 FY 2018 FY 2019 FY 2018 FY 2019 Total Revenue Up 5.1% Total Gross Profit Up 5.2% Adjusted EBITDA Up 19.0%** Franchised EchoPark FY 2019 Earnings Per Diluted Share From Continuing Operations of $3.31, Up 171% Compared To FY 2018* * Refer To Appendix For Items Of Interest That May Affect Comparability Of Segment Income (Loss) Amounts ** Refer To Appendix For Calculation And Reconciliation of Adjusted EBITDA (A Non-GAAP Measure) 26
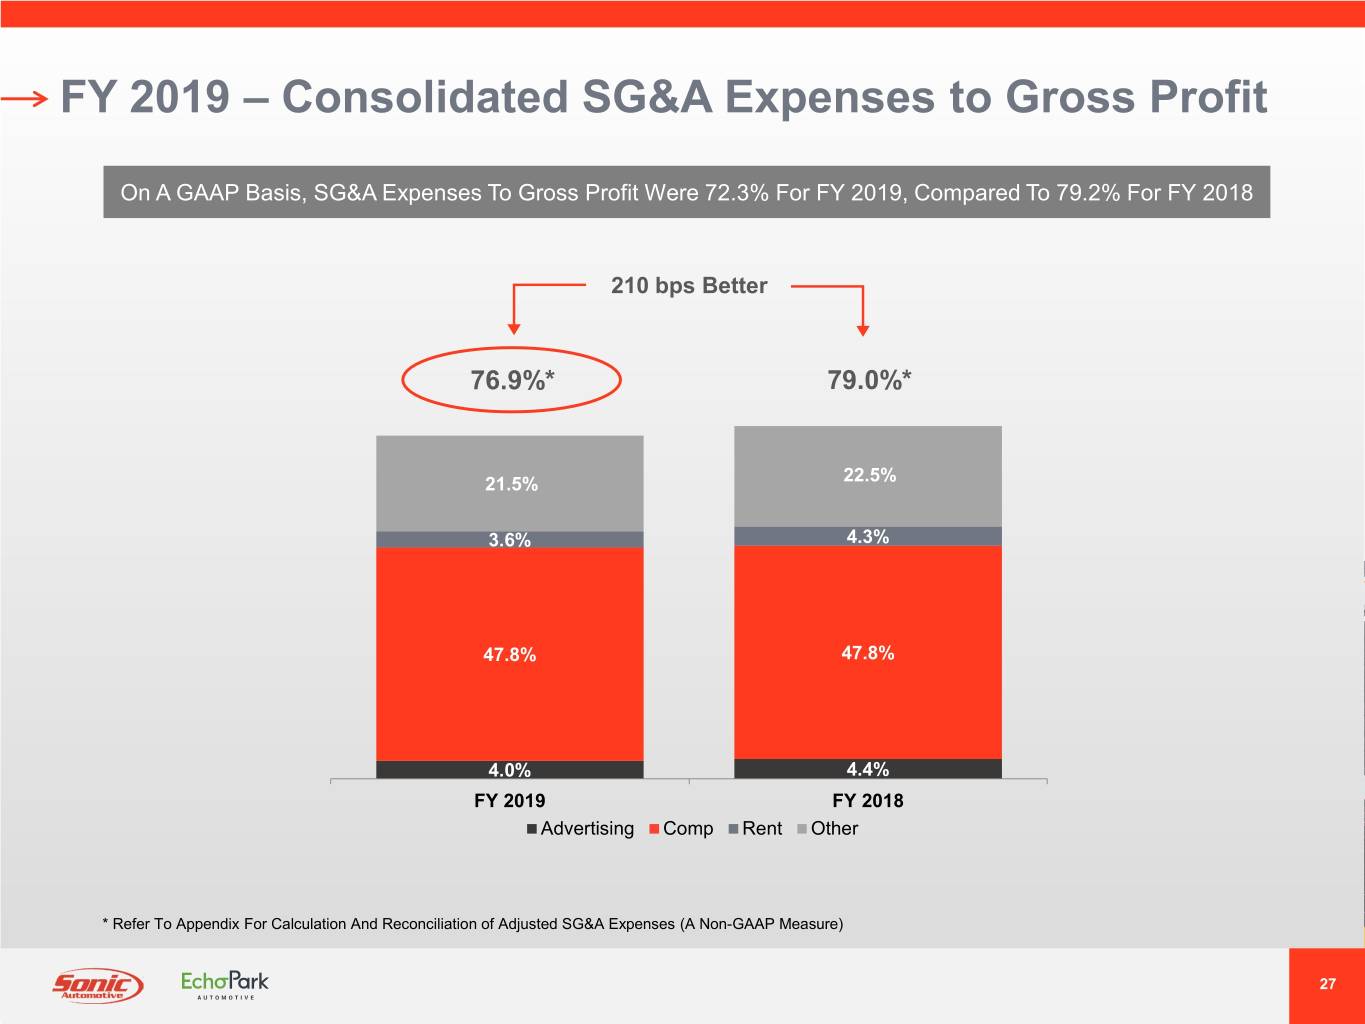
FY 2019 – Consolidated SG&A Expenses to Gross Profit On A GAAP Basis, SG&A Expenses To Gross Profit Were 72.3% For FY 2019, Compared To 79.2% For FY 2018 210 bps Better 76.9%* 79.0%* 21.5% 22.5% 3.6% 4.3% 47.8% 47.8% 4.0% 4.4% FY 2019 FY 2018 Advertising Comp Rent Other * Refer To Appendix For Calculation And Reconciliation of Adjusted SG&A Expenses (A Non-GAAP Measure) 27
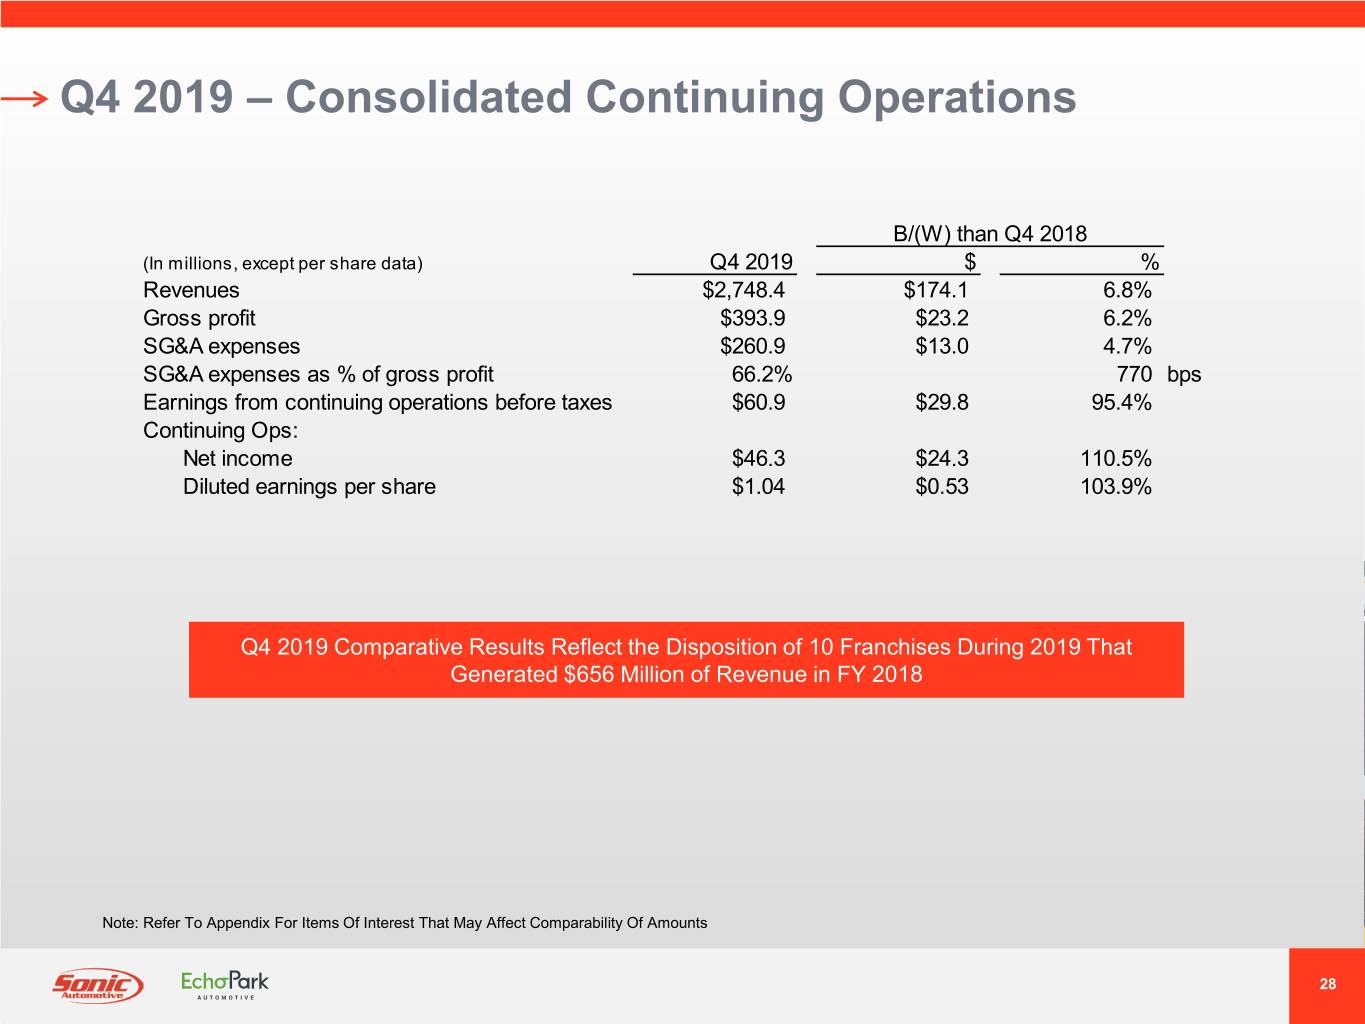
Q4 2019 – Consolidated Continuing Operations B/(W) than Q4 2018 (In millions, except per share data) Q4 2019 $ % Revenues $2,748.4 $174.1 6.8% Gross profit $393.9 $23.2 6.2% SG&A expenses $260.9 $13.0 4.7% SG&A expenses as % of gross profit 66.2% 770 bps Earnings from continuing operations before taxes $60.9 $29.8 95.4% Continuing Ops: Net income $46.3 $24.3 110.5% Diluted earnings per share $1.04 $0.53 103.9% Q4 2019 Comparative Results Reflect the Disposition of 10 Franchises During 2019 That Generated $656 Million of Revenue in FY 2018 Note: Refer To Appendix For Items Of Interest That May Affect Comparability Of Amounts 28
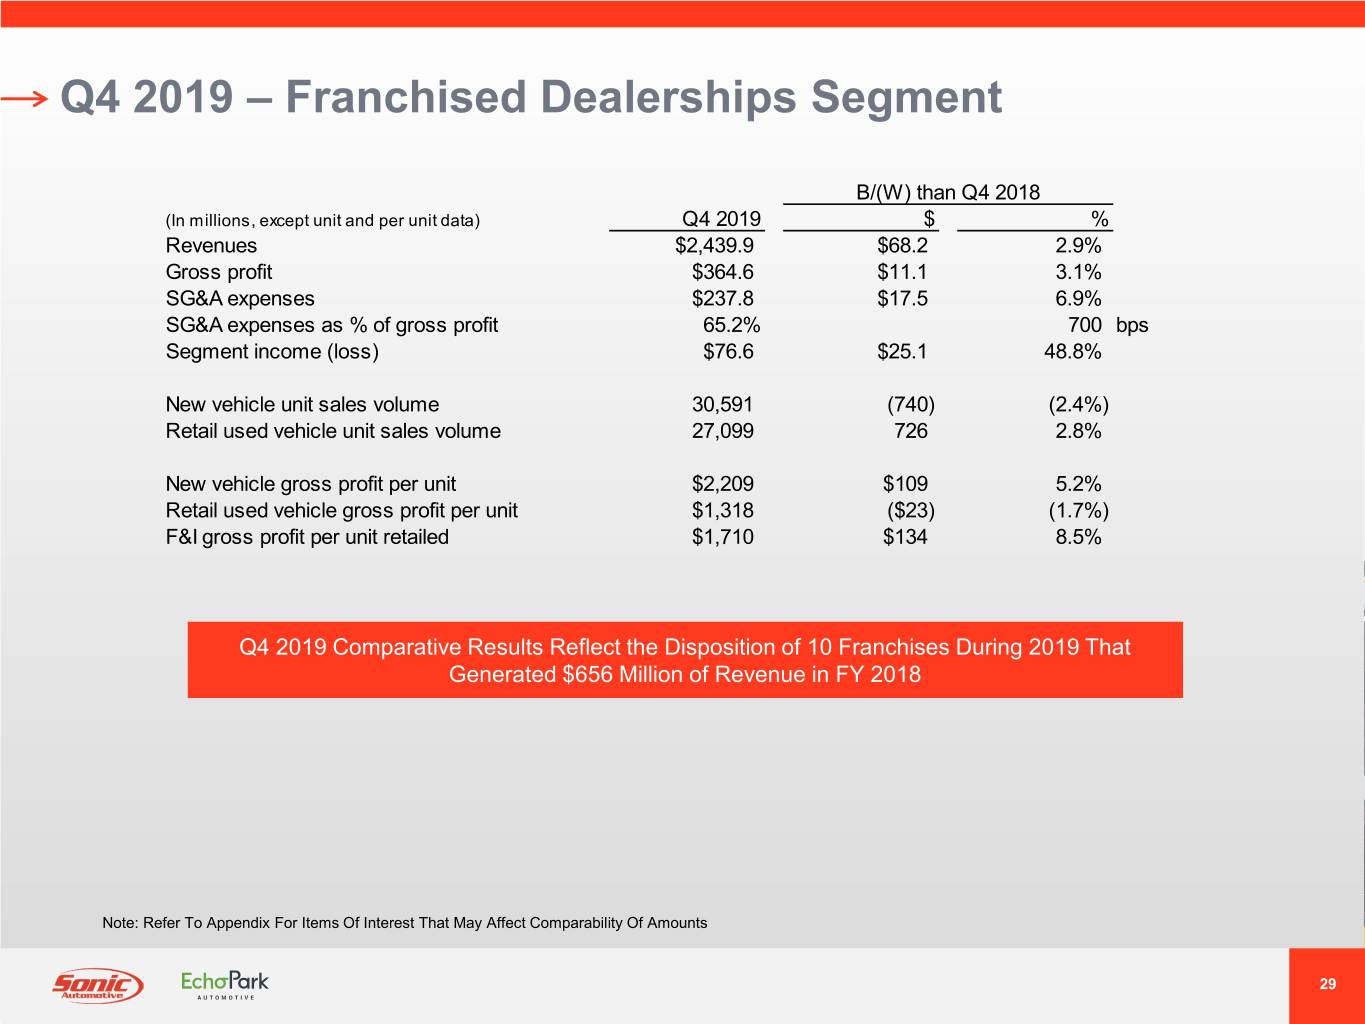
Q4 2019 – Franchised Dealerships Segment B/(W) than Q4 2018 (In millions, except unit and per unit data) Q4 2019 $ % Revenues $2,439.9 $68.2 2.9% Gross profit $364.6 $11.1 3.1% SG&A expenses $237.8 $17.5 6.9% SG&A expenses as % of gross profit 65.2% 700 bps Segment income (loss) $76.6 $25.1 48.8% New vehicle unit sales volume 30,591 (740) (2.4%) Retail used vehicle unit sales volume 27,099 726 2.8% New vehicle gross profit per unit $2,209 $109 5.2% Retail used vehicle gross profit per unit $1,318 ($23) (1.7%) F&I gross profit per unit retailed $1,710 $134 8.5% Q4 2019 Comparative Results Reflect the Disposition of 10 Franchises During 2019 That Generated $656 Million of Revenue in FY 2018 Note: Refer To Appendix For Items Of Interest That May Affect Comparability Of Amounts 29
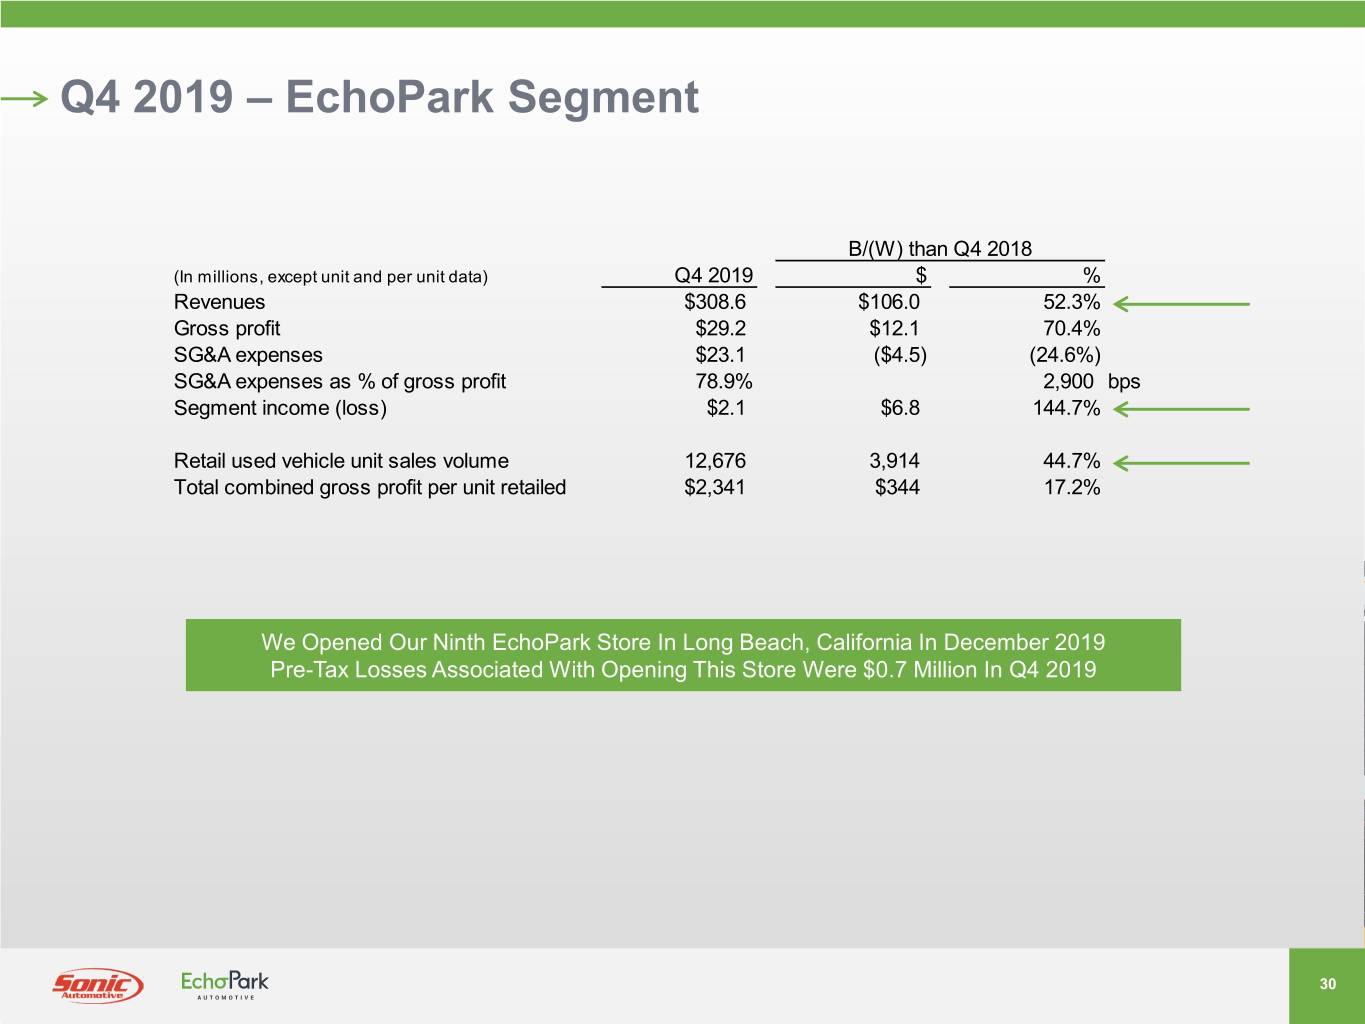
Q4 2019 – EchoPark Segment B/(W) than Q4 2018 (In millions, except unit and per unit data) Q4 2019 $ % Revenues $308.6 $106.0 52.3% Gross profit $29.2 $12.1 70.4% SG&A expenses $23.1 ($4.5) (24.6%) SG&A expenses as % of gross profit 78.9% 2,900 bps Segment income (loss) $2.1 $6.8 144.7% Retail used vehicle unit sales volume 12,676 3,914 44.7% Total combined gross profit per unit retailed $2,341 $344 17.2% We Opened Our Ninth EchoPark Store In Long Beach, California In December 2019 Pre-Tax Losses Associated With Opening This Store Were $0.7 Million In Q4 2019 30
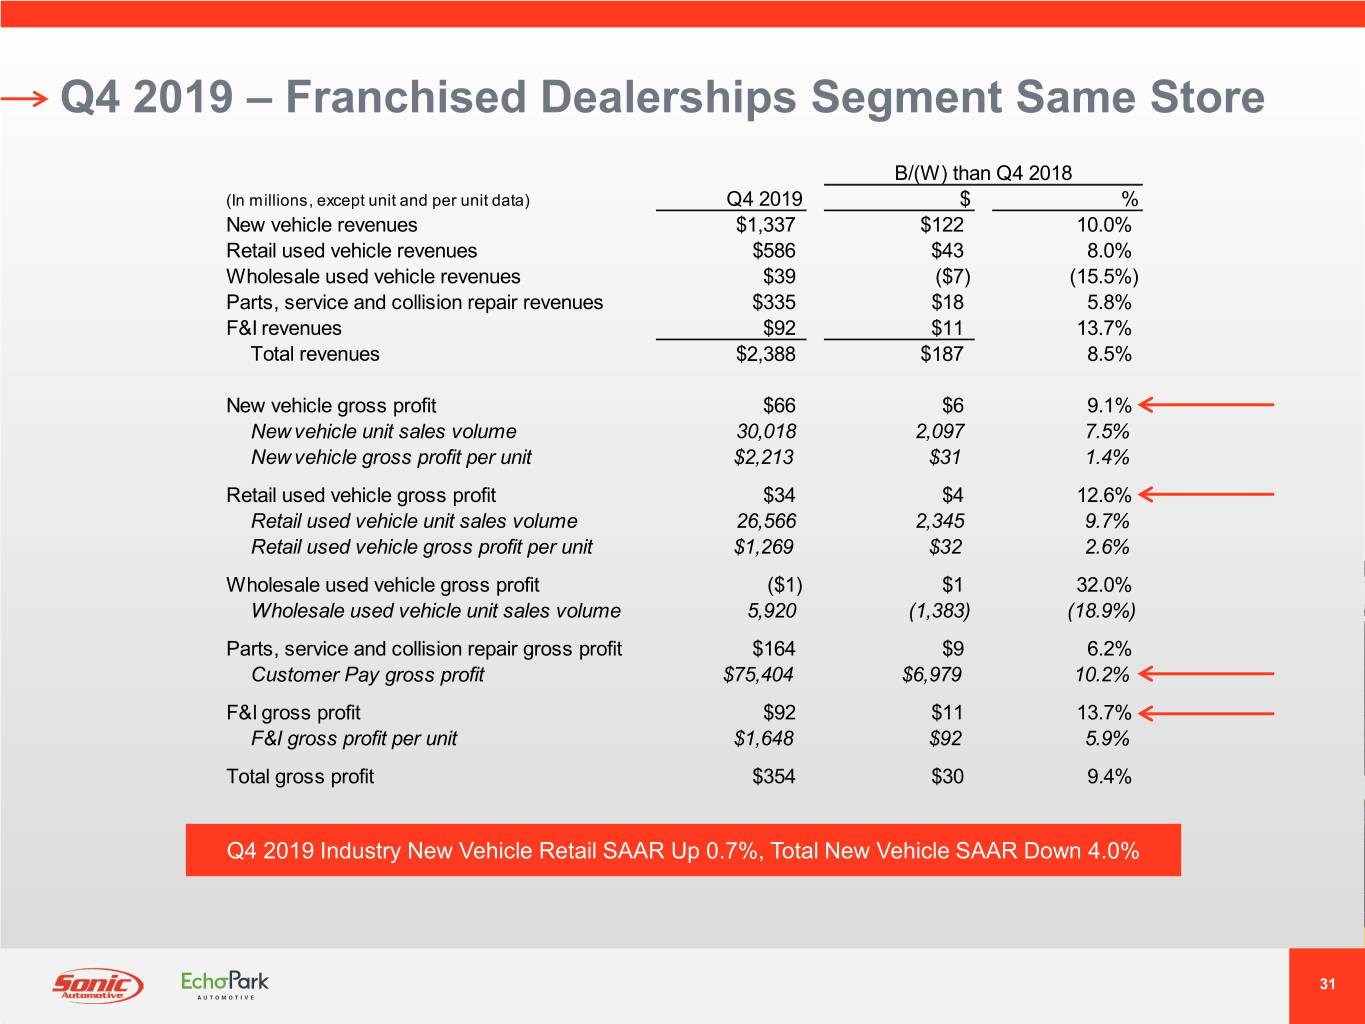
Q4 2019 – Franchised Dealerships Segment Same Store B/(W) than Q4 2018 (In millions, except unit and per unit data) Q4 2019 $ % New vehicle revenues $1,337 $122 10.0% Retail used vehicle revenues $586 $43 8.0% Wholesale used vehicle revenues $39 ($7) (15.5%) Parts, service and collision repair revenues $335 $18 5.8% F&I revenues $92 $11 13.7% Total revenues $2,388 $187 8.5% New vehicle gross profit $66 $6 9.1% New vehicle unit sales volume 30,018 2,097 7.5% New vehicle gross profit per unit $2,213 $31 1.4% Retail used vehicle gross profit $34 $4 12.6% Retail used vehicle unit sales volume 26,566 2,345 9.7% Retail used vehicle gross profit per unit $1,269 $32 2.6% Wholesale used vehicle gross profit ($1) $1 32.0% Wholesale used vehicle unit sales volume 5,920 (1,383) (18.9%) Parts, service and collision repair gross profit $164 $9 6.2% Customer Pay gross profit $75,404 $6,979 10.2% F&I gross profit $92 $11 13.7% F&I gross profit per unit $1,648 $92 5.9% Total gross profit $354 $30 9.4% Q4 2019 Industry New Vehicle Retail SAAR Up 0.7%, Total New Vehicle SAAR Down 4.0% 31
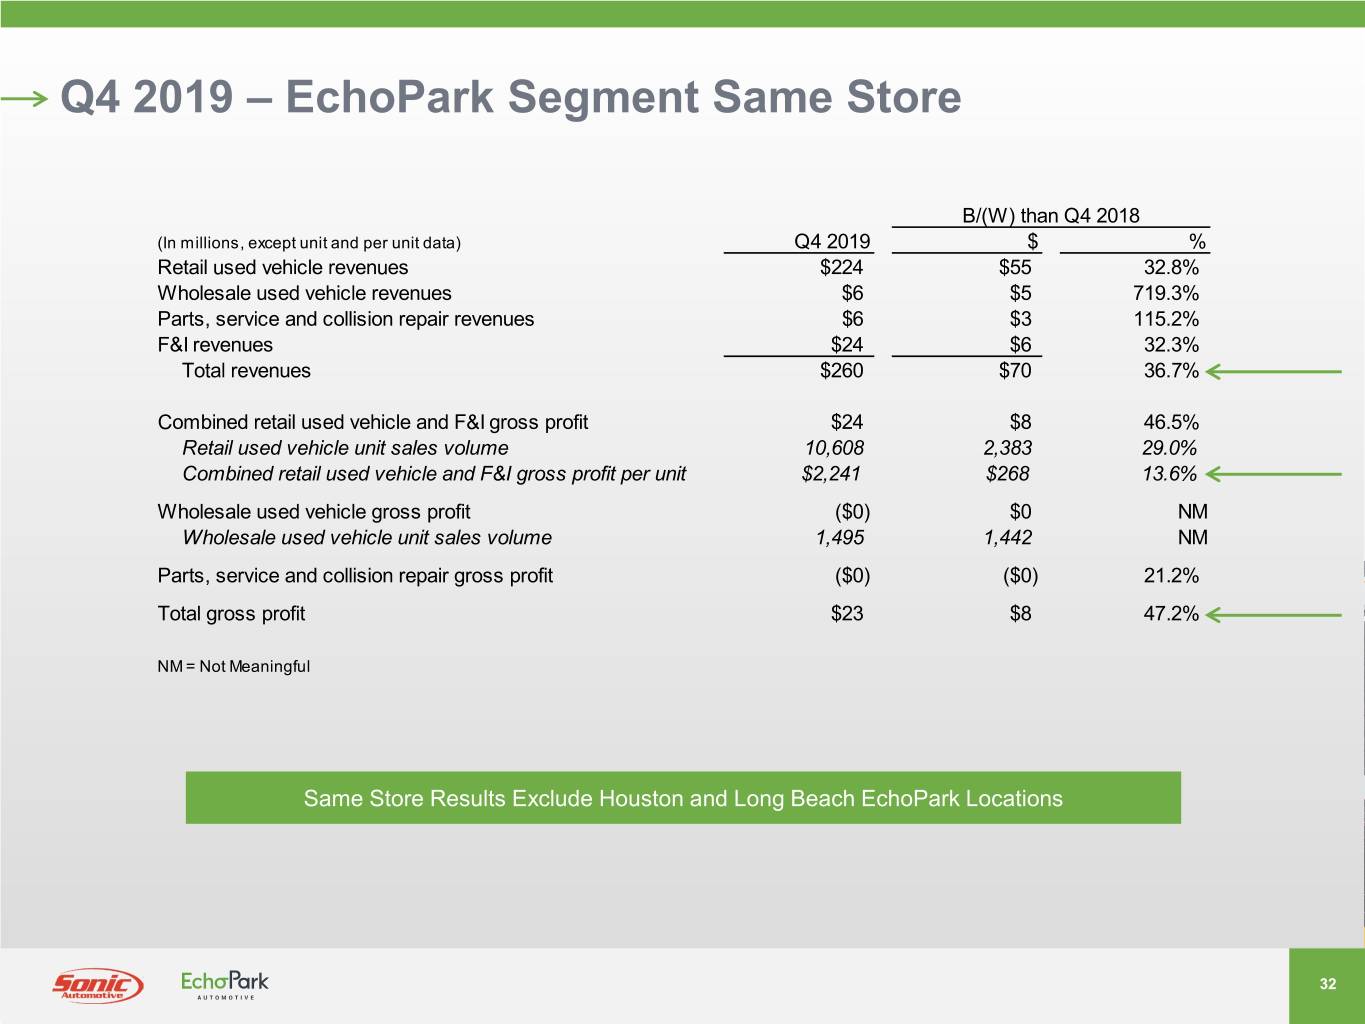
Q4 2019 – EchoPark Segment Same Store B/(W) than Q4 2018 (In millions, except unit and per unit data) Q4 2019 $ % Retail used vehicle revenues $224 $55 32.8% Wholesale used vehicle revenues $6 $5 719.3% Parts, service and collision repair revenues $6 $3 115.2% F&I revenues $24 $6 32.3% Total revenues $260 $70 36.7% Combined retail used vehicle and F&I gross profit $24 $8 46.5% Retail used vehicle unit sales volume 10,608 2,383 29.0% Combined retail used vehicle and F&I gross profit per unit $2,241 $268 13.6% Wholesale used vehicle gross profit ($0) $0 NM Wholesale used vehicle unit sales volume 1,495 1,442 NM Parts, service and collision repair gross profit ($0) ($0) 21.2% Total gross profit $23 $8 47.2% NM = Not Meaningful Same Store Results Exclude Houston and Long Beach EchoPark Locations 32
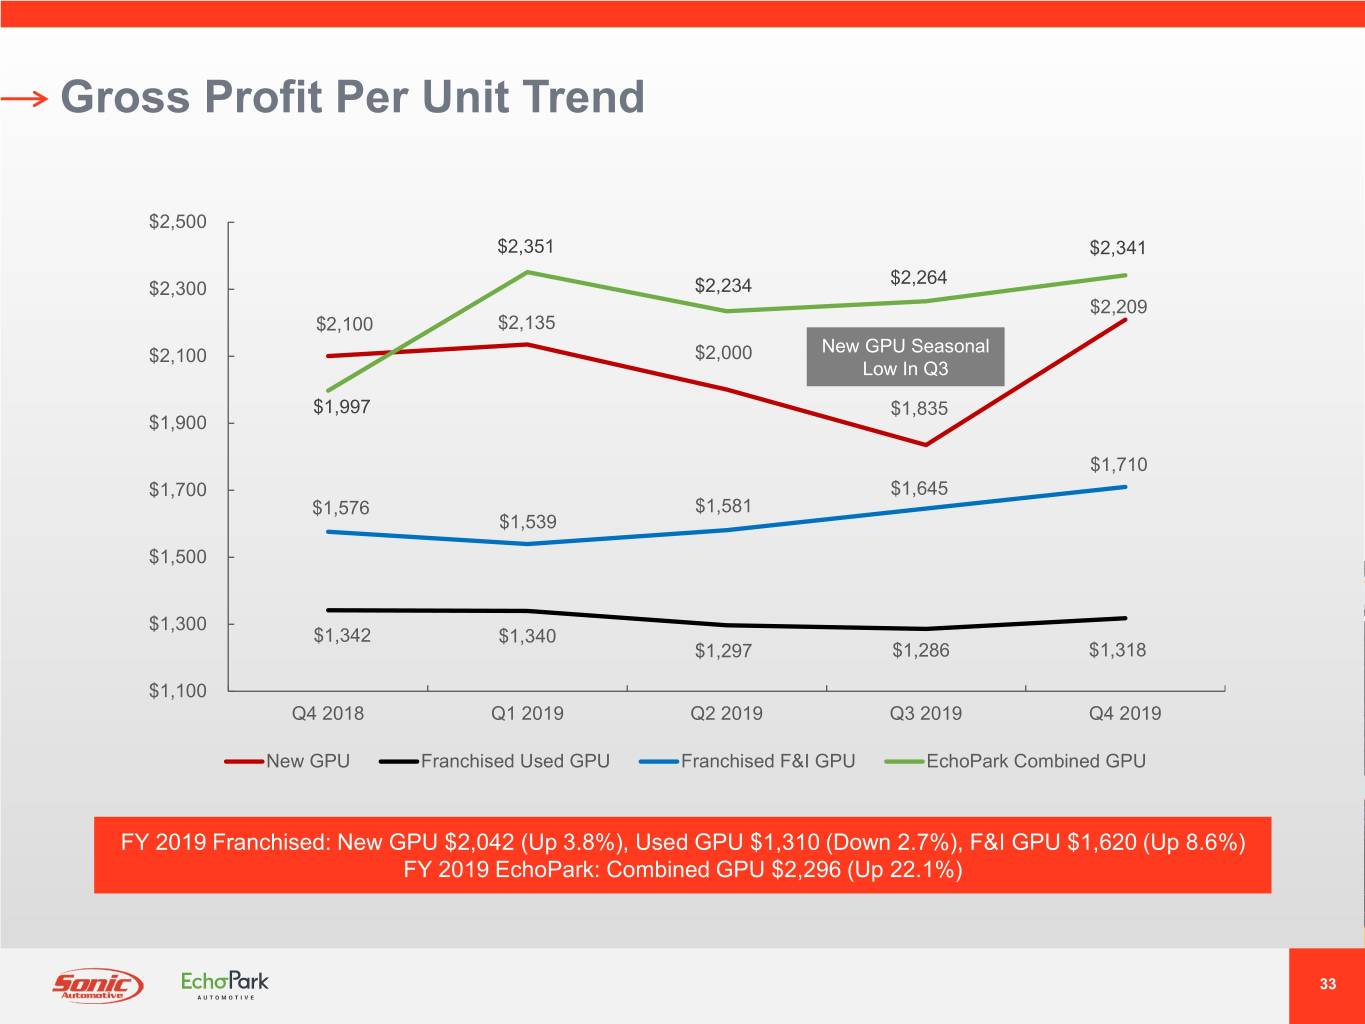
Gross Profit Per Unit Trend $2,500 $2,351 $2,341 $2,264 $2,300 $2,234 $2,209 $2,100 $2,135 New GPU Seasonal $2,100 $2,000 Low In Q3 $1,997 $1,835 $1,900 $1,710 $1,700 $1,645 $1,576 $1,581 $1,539 $1,500 $1,300 $1,342 $1,340 $1,297 $1,286 $1,318 $1,100 Q4 2018 Q1 2019 Q2 2019 Q3 2019 Q4 2019 New GPU Franchised Used GPU Franchised F&I GPU EchoPark Combined GPU FY 2019 Franchised: New GPU $2,042 (Up 3.8%), Used GPU $1,310 (Down 2.7%), F&I GPU $1,620 (Up 8.6%) FY 2019 EchoPark: Combined GPU $2,296 (Up 22.1%) 33
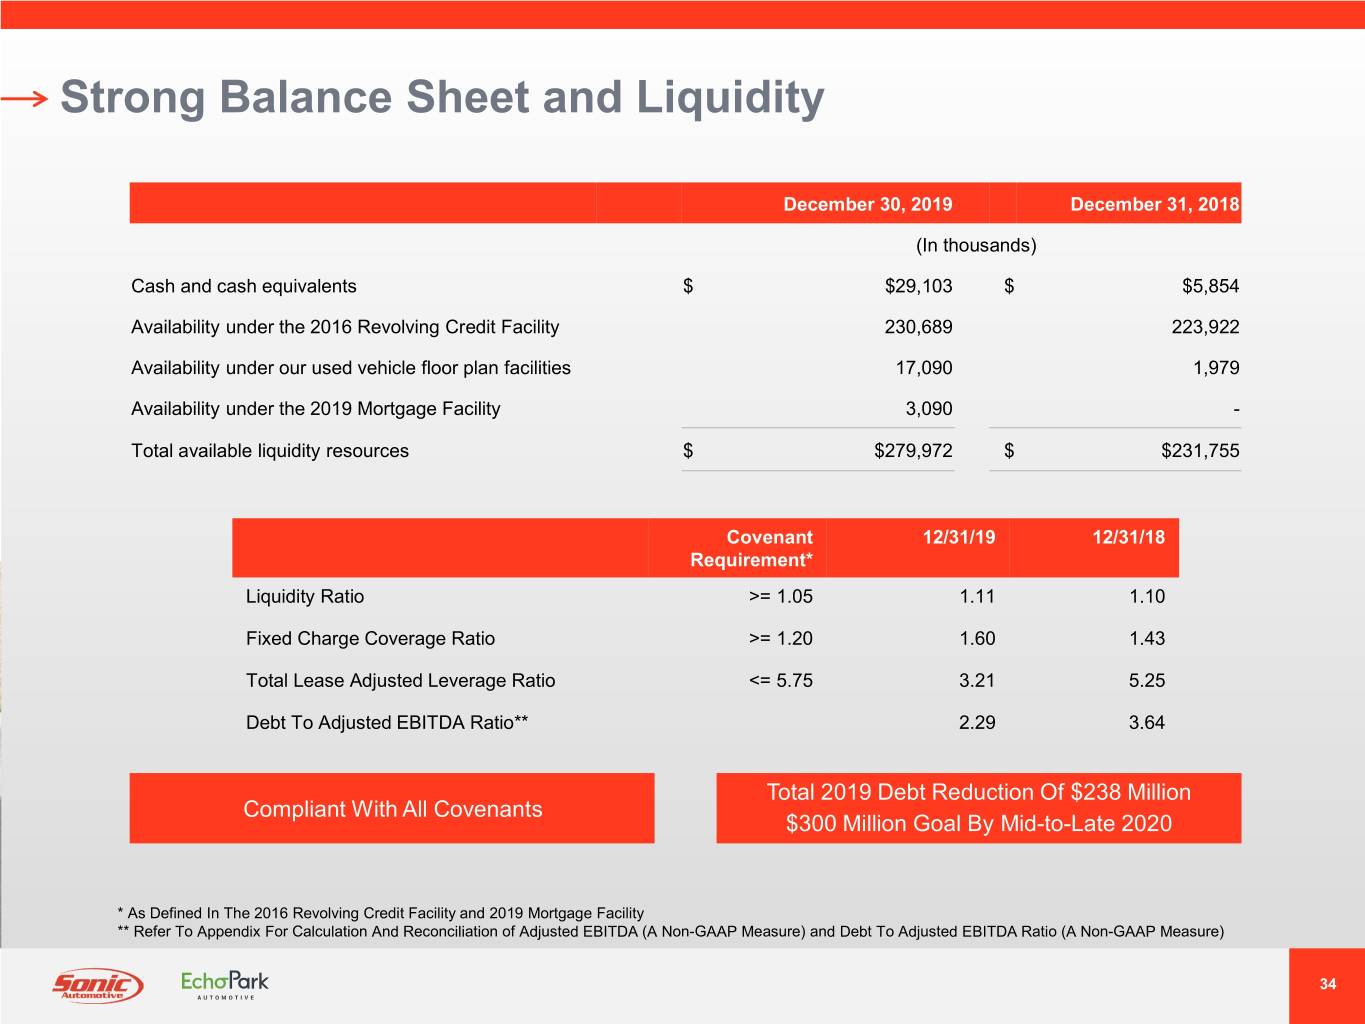
Strong Balance Sheet and Liquidity December 30, 2019 December 31, 2018 (In thousands) Cash and cash equivalents $ $29,103 $ $5,854 Availability under the 2016 Revolving Credit Facility 230,689 223,922 Availability under our used vehicle floor plan facilities 17,090 1,979 Availability under the 2019 Mortgage Facility 3,090 - Total available liquidity resources $ $279,972 $ $231,755 Covenant 12/31/19 12/31/18 Requirement* Liquidity Ratio >= 1.05 1.11 1.10 Fixed Charge Coverage Ratio >= 1.20 1.60 1.43 Total Lease Adjusted Leverage Ratio <= 5.75 3.21 5.25 Debt To Adjusted EBITDA Ratio** 2.29 3.64 Total 2019 Debt Reduction Of $238 Million Compliant With All Covenants $300 Million Goal By Mid-to-Late 2020 * As Defined In The 2016 Revolving Credit Facility and 2019 Mortgage Facility ** Refer To Appendix For Calculation And Reconciliation of Adjusted EBITDA (A Non-GAAP Measure) and Debt To Adjusted EBITDA Ratio (A Non-GAAP Measure) 34
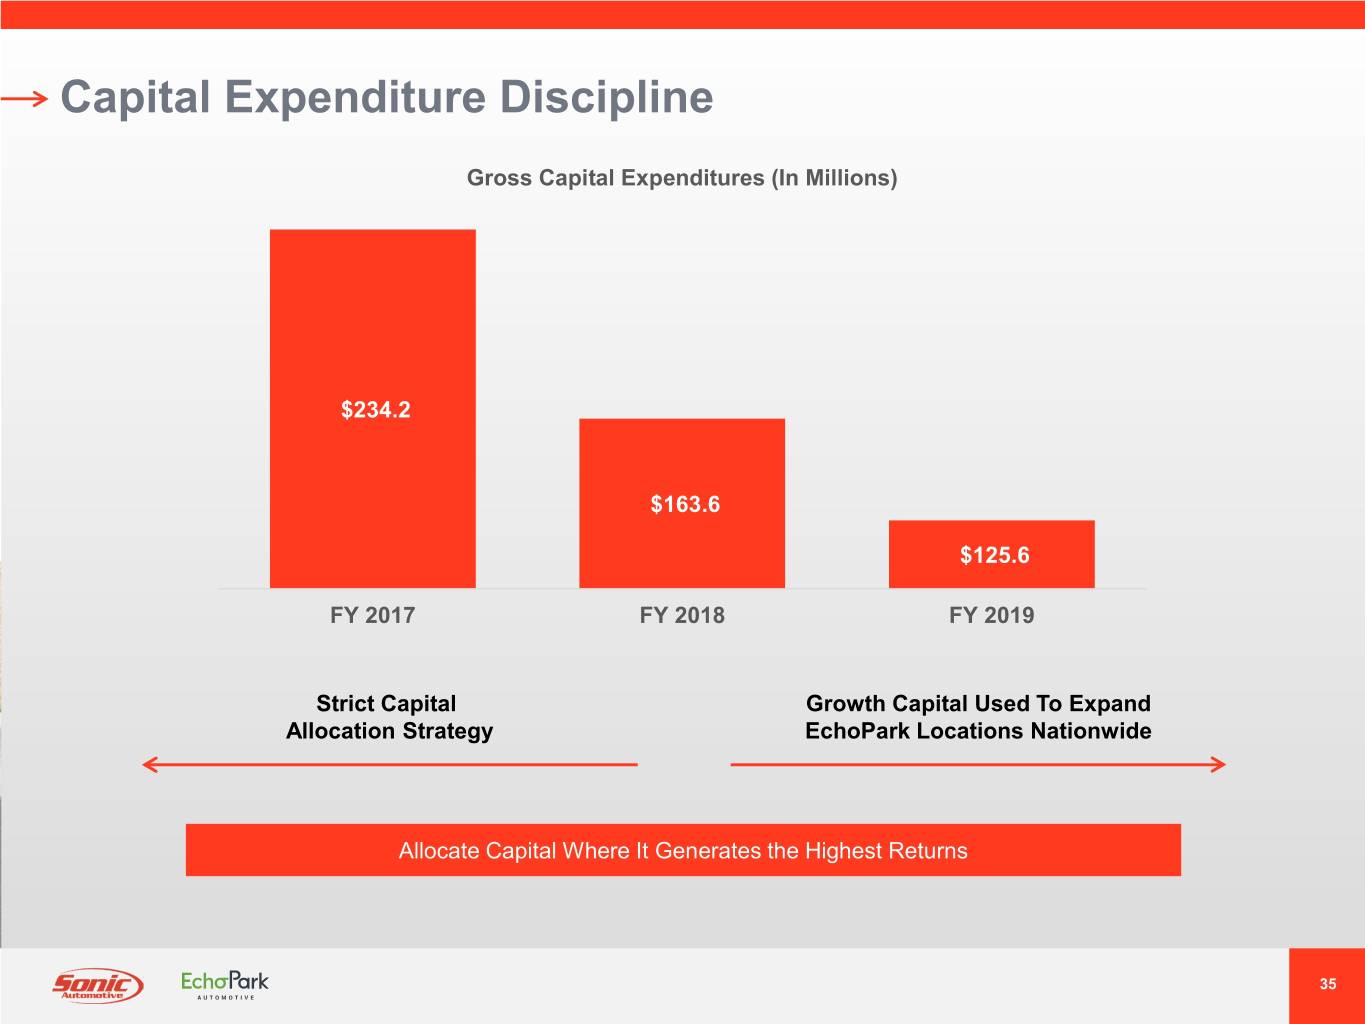
Capital Expenditure Discipline Gross Capital Expenditures (In Millions) $234.2 $163.6 $125.6 FY 2017 FY 2018 FY 2019 Strict Capital Growth Capital Used To Expand Allocation Strategy EchoPark Locations Nationwide Allocate Capital Where It Generates the Highest Returns 35
APPENDIX 36
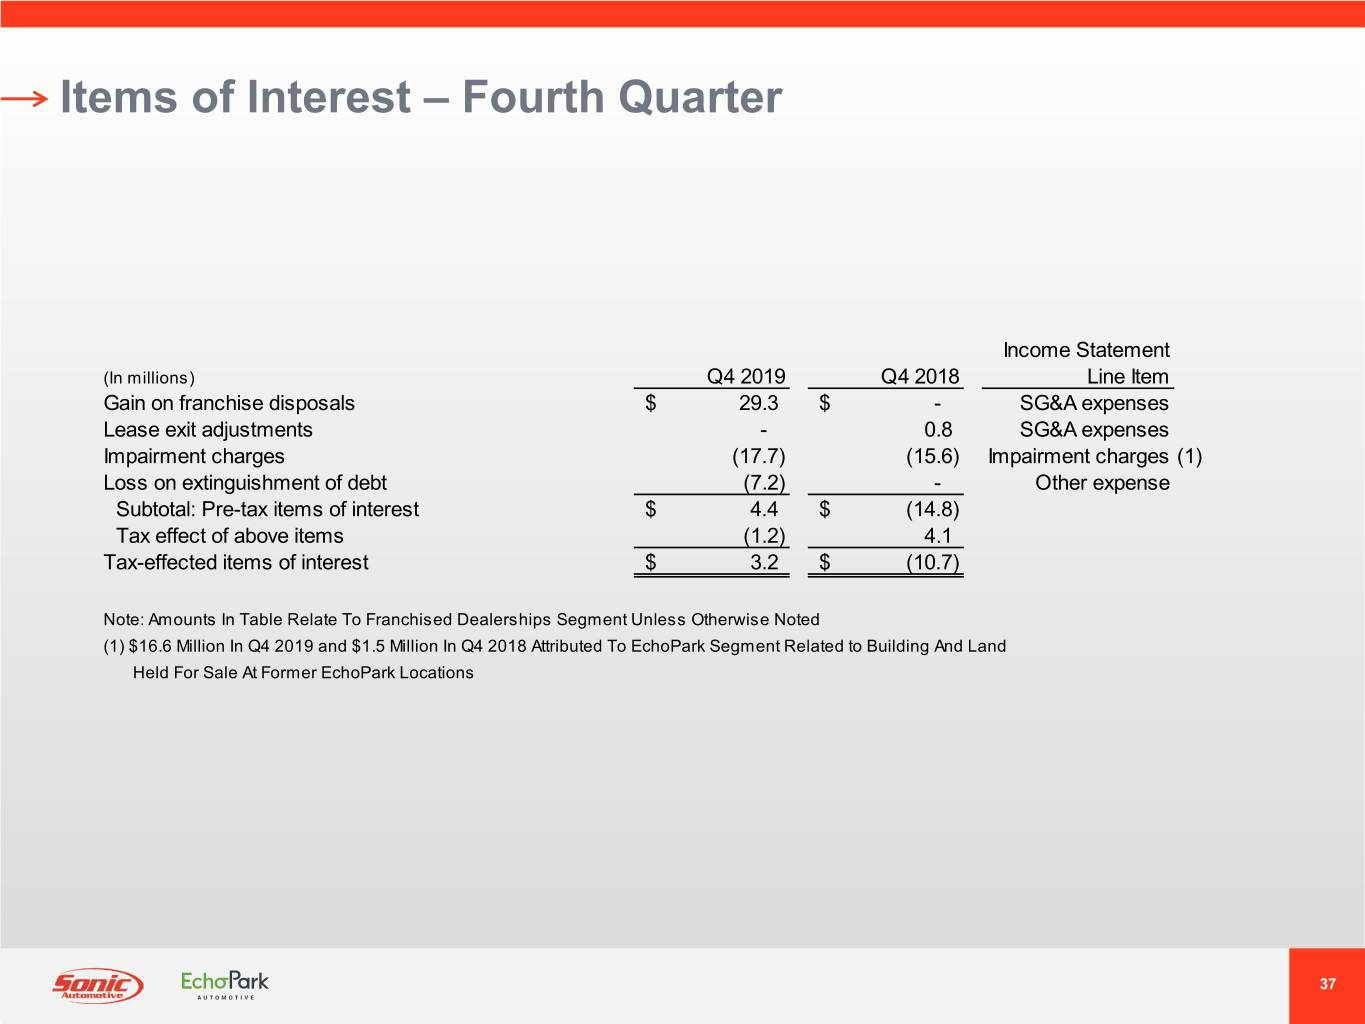
Items of Interest – Fourth Quarter Income Statement (In millions) Q4 2019 Q4 2018 Line Item Gain on franchise disposals $ 29.3 $ - SG&A expenses Lease exit adjustments - 0.8 SG&A expenses Impairment charges (17.7) (15.6) Impairment charges (1) Loss on extinguishment of debt (7.2) - Other expense Subtotal: Pre-tax items of interest $ 4.4 $ (14.8) Tax effect of above items (1.2) 4.1 Tax-effected items of interest $ 3.2 $ (10.7) Note: Amounts In Table Relate To Franchised Dealerships Segment Unless Otherwise Noted (1) $16.6 Million In Q4 2019 and $1.5 Million In Q4 2018 Attributed To EchoPark Segment Related to Building And Land Held For Sale At Former EchoPark Locations 37
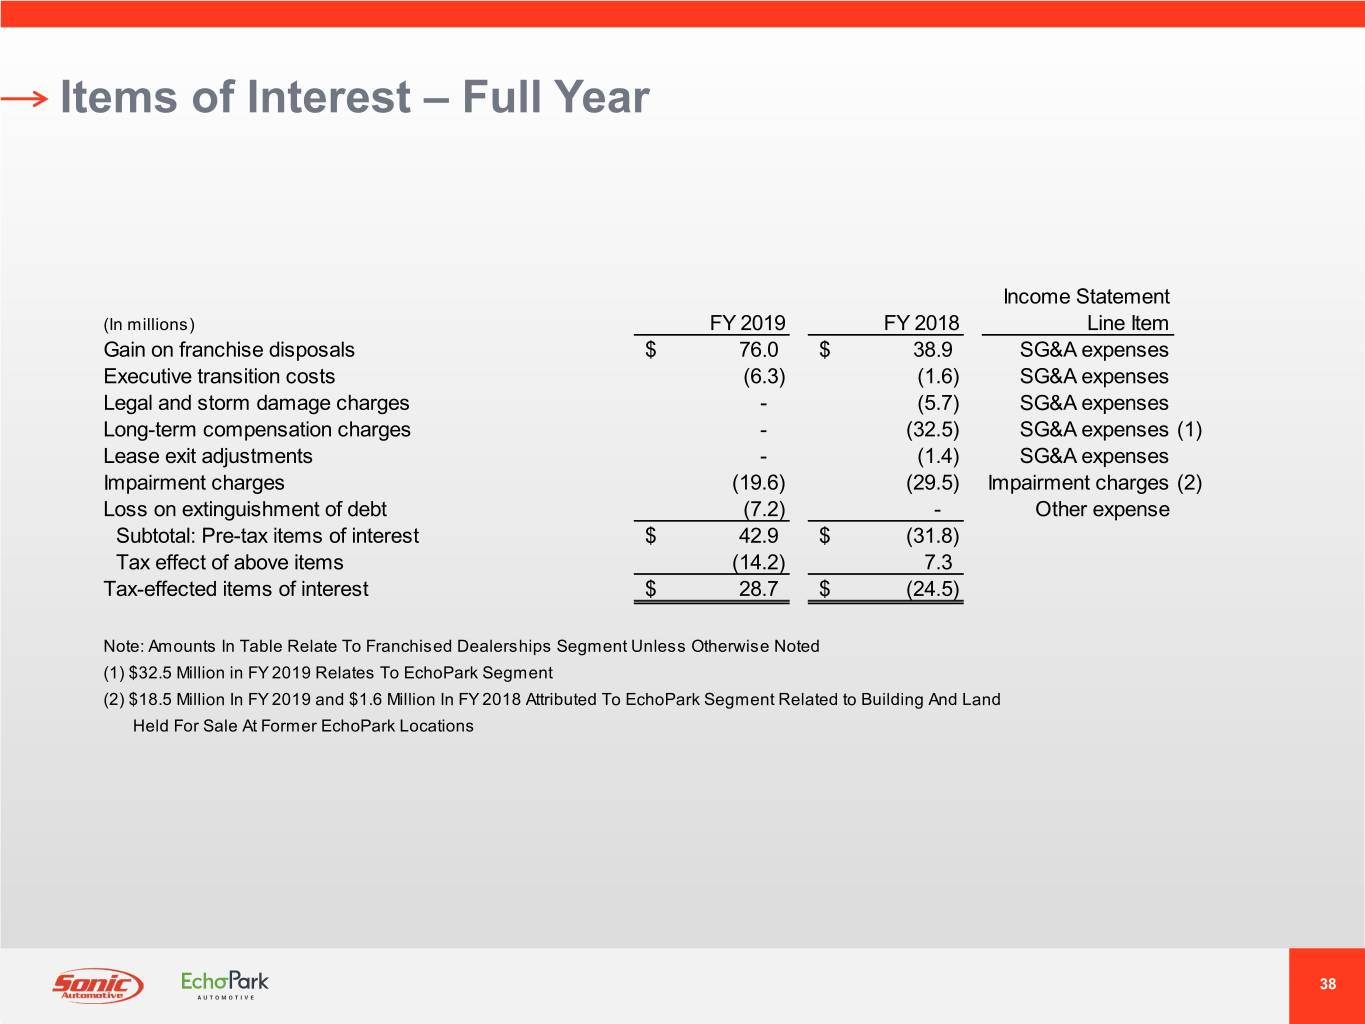
Items of Interest – Full Year Income Statement (In millions) FY 2019 FY 2018 Line Item Gain on franchise disposals $ 76.0 $ 38.9 SG&A expenses Executive transition costs (6.3) (1.6) SG&A expenses Legal and storm damage charges - (5.7) SG&A expenses Long-term compensation charges - (32.5) SG&A expenses (1) Lease exit adjustments - (1.4) SG&A expenses Impairment charges (19.6) (29.5) Impairment charges (2) Loss on extinguishment of debt (7.2) - Other expense Subtotal: Pre-tax items of interest $ 42.9 $ (31.8) Tax effect of above items (14.2) 7.3 Tax-effected items of interest $ 28.7 $ (24.5) Note: Amounts In Table Relate To Franchised Dealerships Segment Unless Otherwise Noted (1) $32.5 Million in FY 2019 Relates To EchoPark Segment (2) $18.5 Million In FY 2019 and $1.6 Million In FY 2018 Attributed To EchoPark Segment Related to Building And Land Held For Sale At Former EchoPark Locations 38
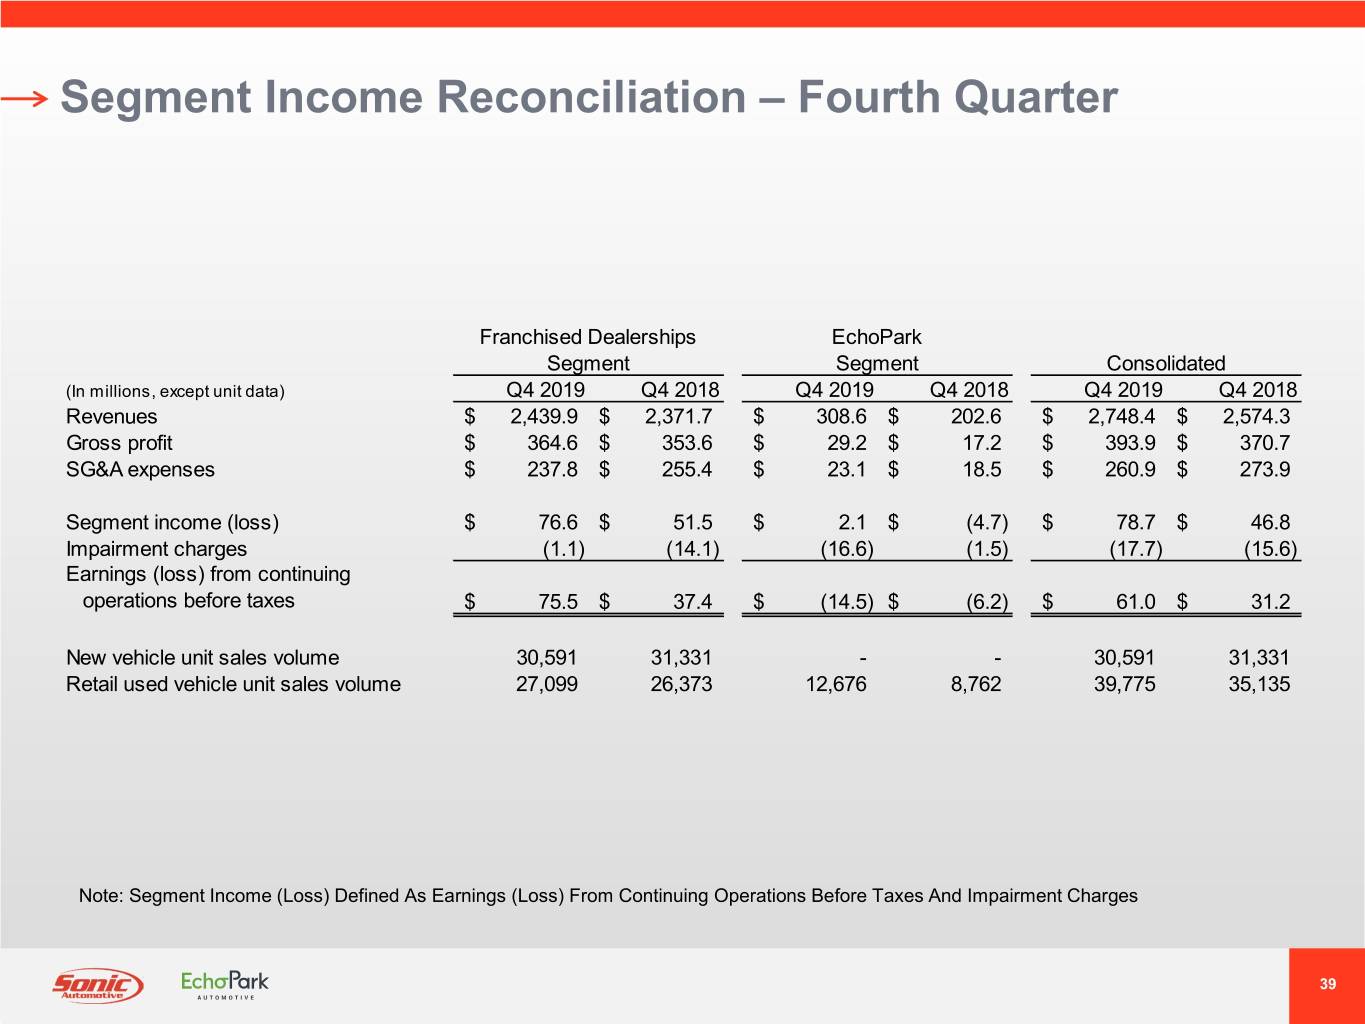
Segment Income Reconciliation – Fourth Quarter Franchised Dealerships EchoPark Segment Segment Consolidated (In millions, except unit data) Q4 2019 Q4 2018 Q4 2019 Q4 2018 Q4 2019 Q4 2018 Revenues $ 2,439.9 $ 2,371.7 $ 308.6 $ 202.6 $ 2,748.4 $ 2,574.3 Gross profit $ 364.6 $ 353.6 $ 29.2 $ 17.2 $ 393.9 $ 370.7 SG&A expenses $ 237.8 $ 255.4 $ 23.1 $ 18.5 $ 260.9 $ 273.9 Segment income (loss) $ 76.6 $ 51.5 $ 2.1 $ (4.7) $ 78.7 $ 46.8 Impairment charges (1.1) (14.1) (16.6) (1.5) (17.7) (15.6) Earnings (loss) from continuing operations before taxes $ 75.5 $ 37.4 $ (14.5) $ (6.2) $ 61.0 $ 31.2 New vehicle unit sales volume 30,591 31,331 - - 30,591 31,331 Retail used vehicle unit sales volume 27,099 26,373 12,676 8,762 39,775 35,135 Note: Segment Income (Loss) Defined As Earnings (Loss) From Continuing Operations Before Taxes And Impairment Charges 39
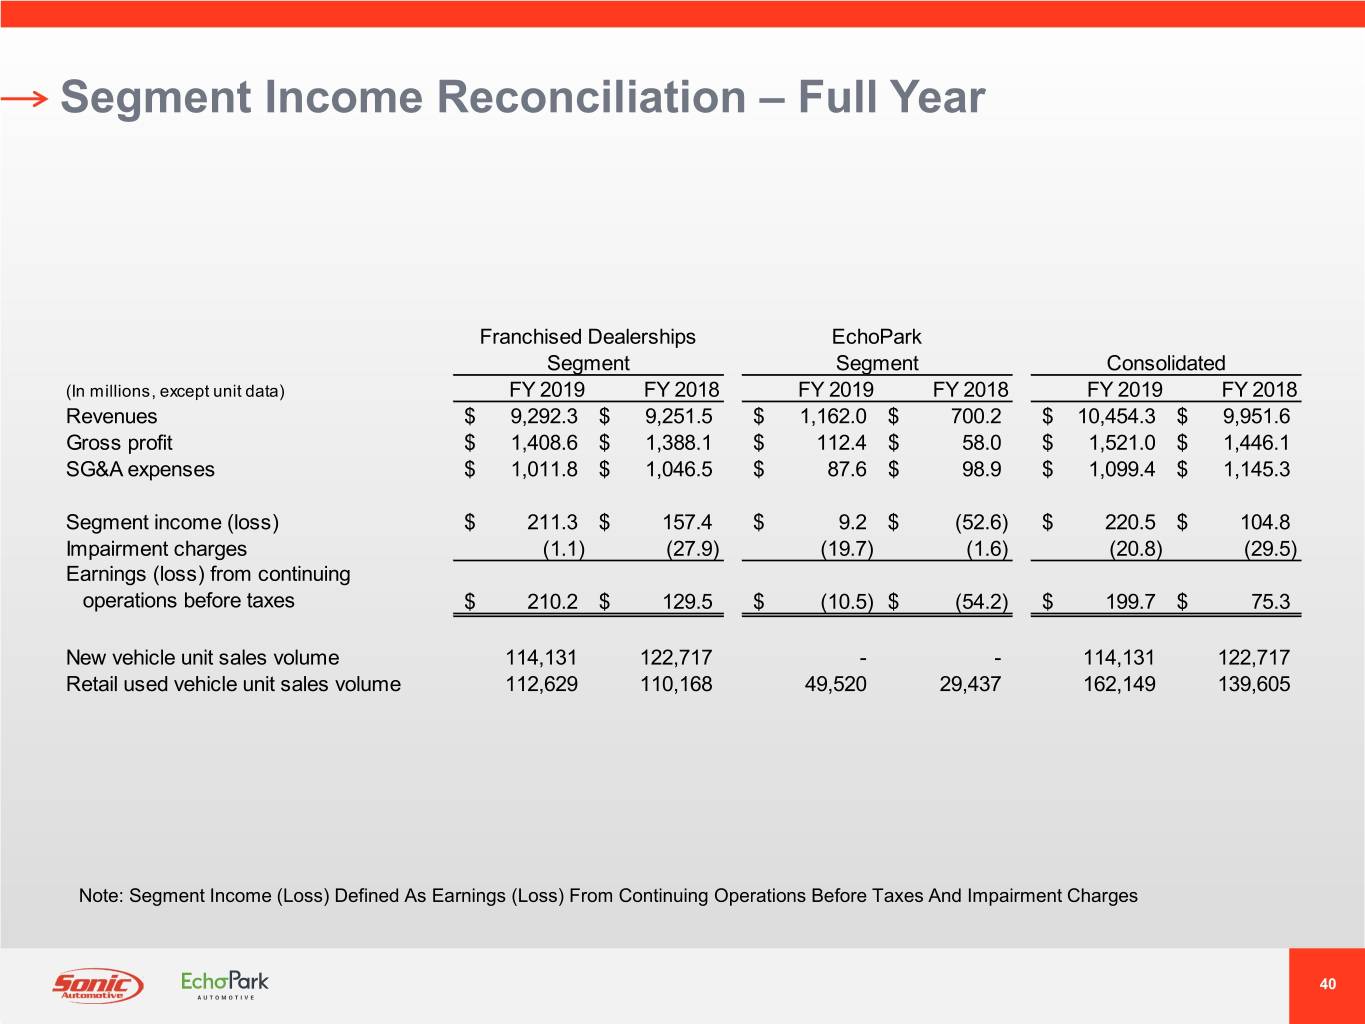
Segment Income Reconciliation – Full Year Franchised Dealerships EchoPark Segment Segment Consolidated (In millions, except unit data) FY 2019 FY 2018 FY 2019 FY 2018 FY 2019 FY 2018 Revenues $ 9,292.3 $ 9,251.5 $ 1,162.0 $ 700.2 $ 10,454.3 $ 9,951.6 Gross profit $ 1,408.6 $ 1,388.1 $ 112.4 $ 58.0 $ 1,521.0 $ 1,446.1 SG&A expenses $ 1,011.8 $ 1,046.5 $ 87.6 $ 98.9 $ 1,099.4 $ 1,145.3 Segment income (loss) $ 211.3 $ 157.4 $ 9.2 $ (52.6) $ 220.5 $ 104.8 Impairment charges (1.1) (27.9) (19.7) (1.6) (20.8) (29.5) Earnings (loss) from continuing operations before taxes $ 210.2 $ 129.5 $ (10.5) $ (54.2) $ 199.7 $ 75.3 New vehicle unit sales volume 114,131 122,717 - - 114,131 122,717 Retail used vehicle unit sales volume 112,629 110,168 49,520 29,437 162,149 139,605 Note: Segment Income (Loss) Defined As Earnings (Loss) From Continuing Operations Before Taxes And Impairment Charges 40
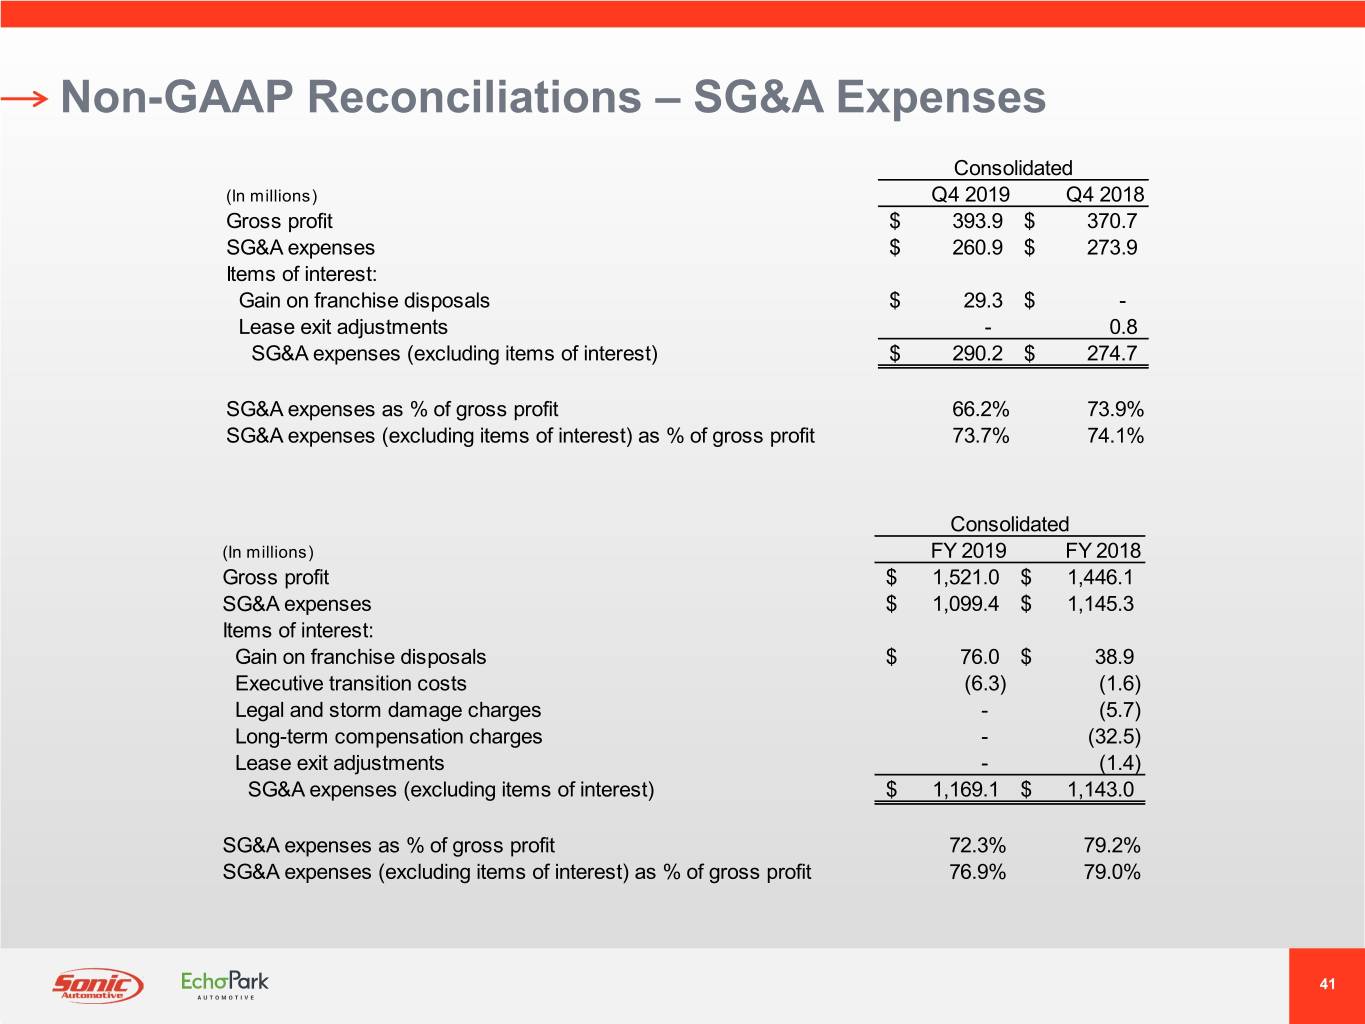
Non-GAAP Reconciliations – SG&A Expenses Consolidated (In millions) Q4 2019 Q4 2018 Gross profit $ 393.9 $ 370.7 SG&A expenses $ 260.9 $ 273.9 Items of interest: Gain on franchise disposals $ 29.3 $ - Lease exit adjustments - 0.8 SG&A expenses (excluding items of interest) $ 290.2 $ 274.7 SG&A expenses as % of gross profit 66.2% 73.9% SG&A expenses (excluding items of interest) as % of gross profit 73.7% 74.1% Consolidated (In millions) FY 2019 FY 2018 Gross profit $ 1,521.0 $ 1,446.1 SG&A expenses $ 1,099.4 $ 1,145.3 Items of interest: Gain on franchise disposals $ 76.0 $ 38.9 Executive transition costs (6.3) (1.6) Legal and storm damage charges - (5.7) Long-term compensation charges - (32.5) Lease exit adjustments - (1.4) SG&A expenses (excluding items of interest) $ 1,169.1 $ 1,143.0 SG&A expenses as % of gross profit 72.3% 79.2% SG&A expenses (excluding items of interest) as % of gross profit 76.9% 79.0% 41
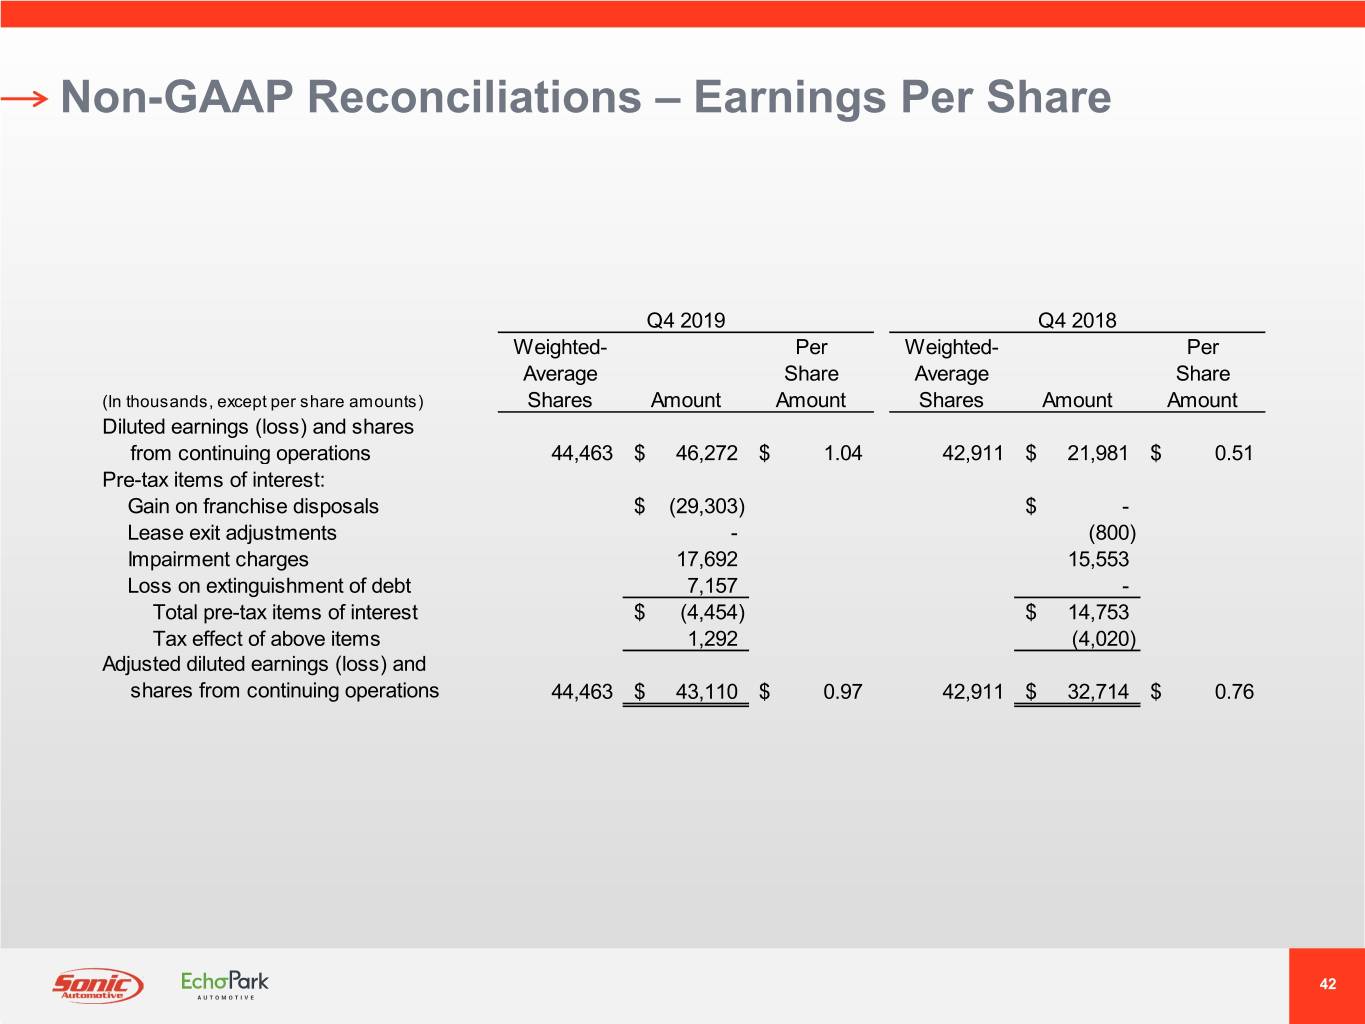
Non-GAAP Reconciliations – Earnings Per Share Q4 2019 Q4 2018 Weighted- Per Weighted- Per Average Share Average Share (In thousands, except per share amounts) Shares Amount Amount Shares Amount Amount Diluted earnings (loss) and shares from continuing operations 44,463 $ 46,272 $ 1.04 42,911 $ 21,981 $ 0.51 Pre-tax items of interest: Gain on franchise disposals $ (29,303) $ - Lease exit adjustments - (800) Impairment charges 17,692 15,553 Loss on extinguishment of debt 7,157 - Total pre-tax items of interest $ (4,454) $ 14,753 Tax effect of above items 1,292 (4,020) Adjusted diluted earnings (loss) and shares from continuing operations 44,463 $ 43,110 $ 0.97 42,911 $ 32,714 $ 0.76 42
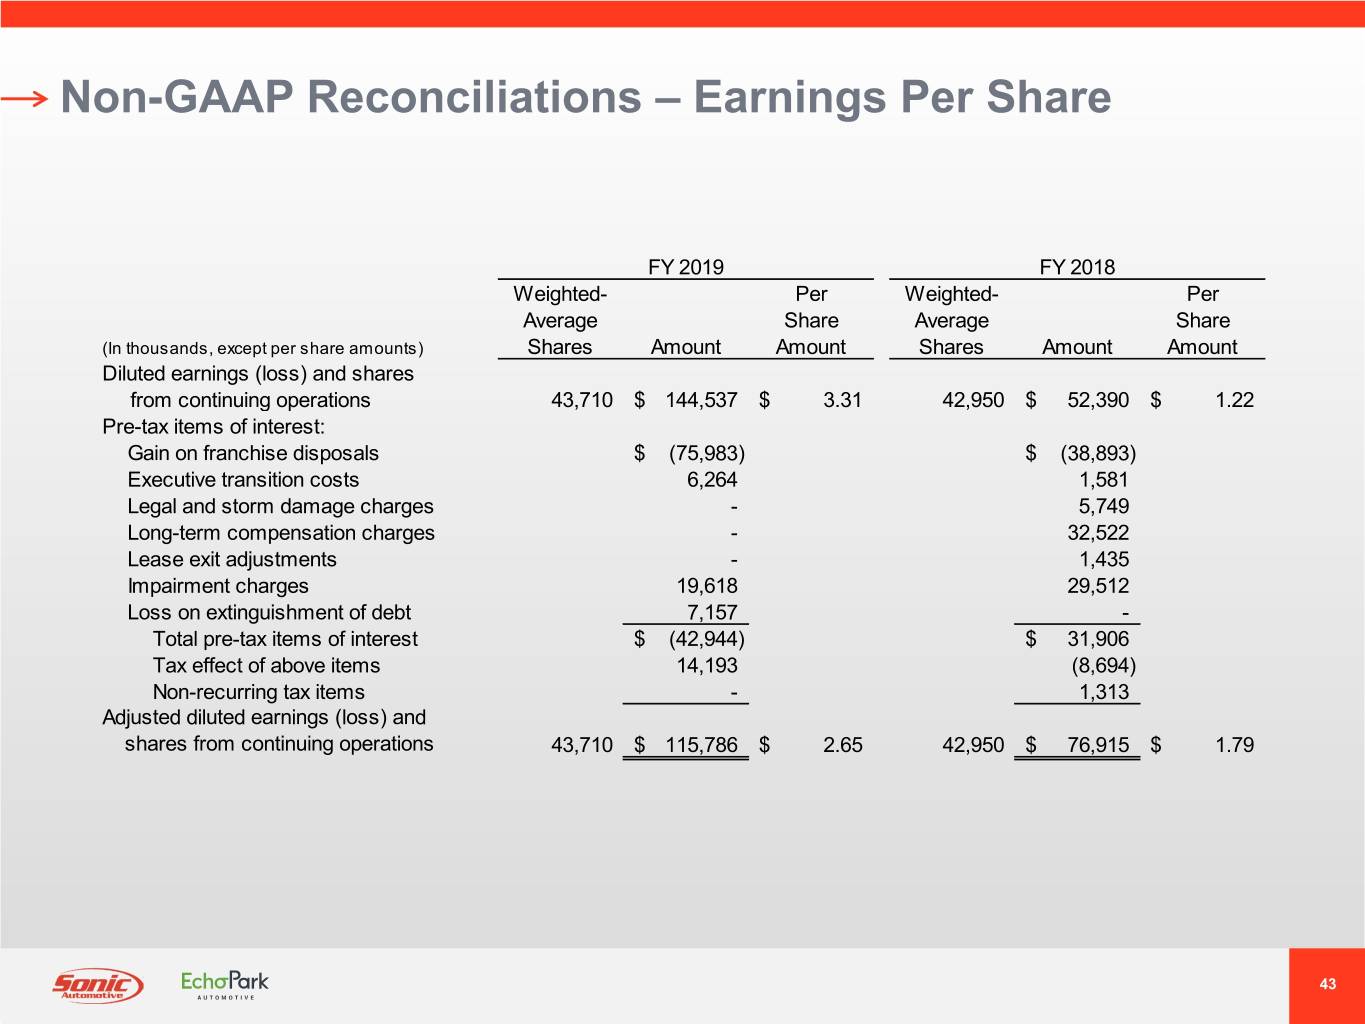
Non-GAAP Reconciliations – Earnings Per Share FY 2019 FY 2018 Weighted- Per Weighted- Per Average Share Average Share (In thousands, except per share amounts) Shares Amount Amount Shares Amount Amount Diluted earnings (loss) and shares from continuing operations 43,710 $ 144,537 $ 3.31 42,950 $ 52,390 $ 1.22 Pre-tax items of interest: Gain on franchise disposals $ (75,983) $ (38,893) Executive transition costs 6,264 1,581 Legal and storm damage charges - 5,749 Long-term compensation charges - 32,522 Lease exit adjustments - 1,435 Impairment charges 19,618 29,512 Loss on extinguishment of debt 7,157 - Total pre-tax items of interest $ (42,944) $ 31,906 Tax effect of above items 14,193 (8,694) Non-recurring tax items - 1,313 Adjusted diluted earnings (loss) and shares from continuing operations 43,710 $ 115,786 $ 2.65 42,950 $ 76,915 $ 1.79 43
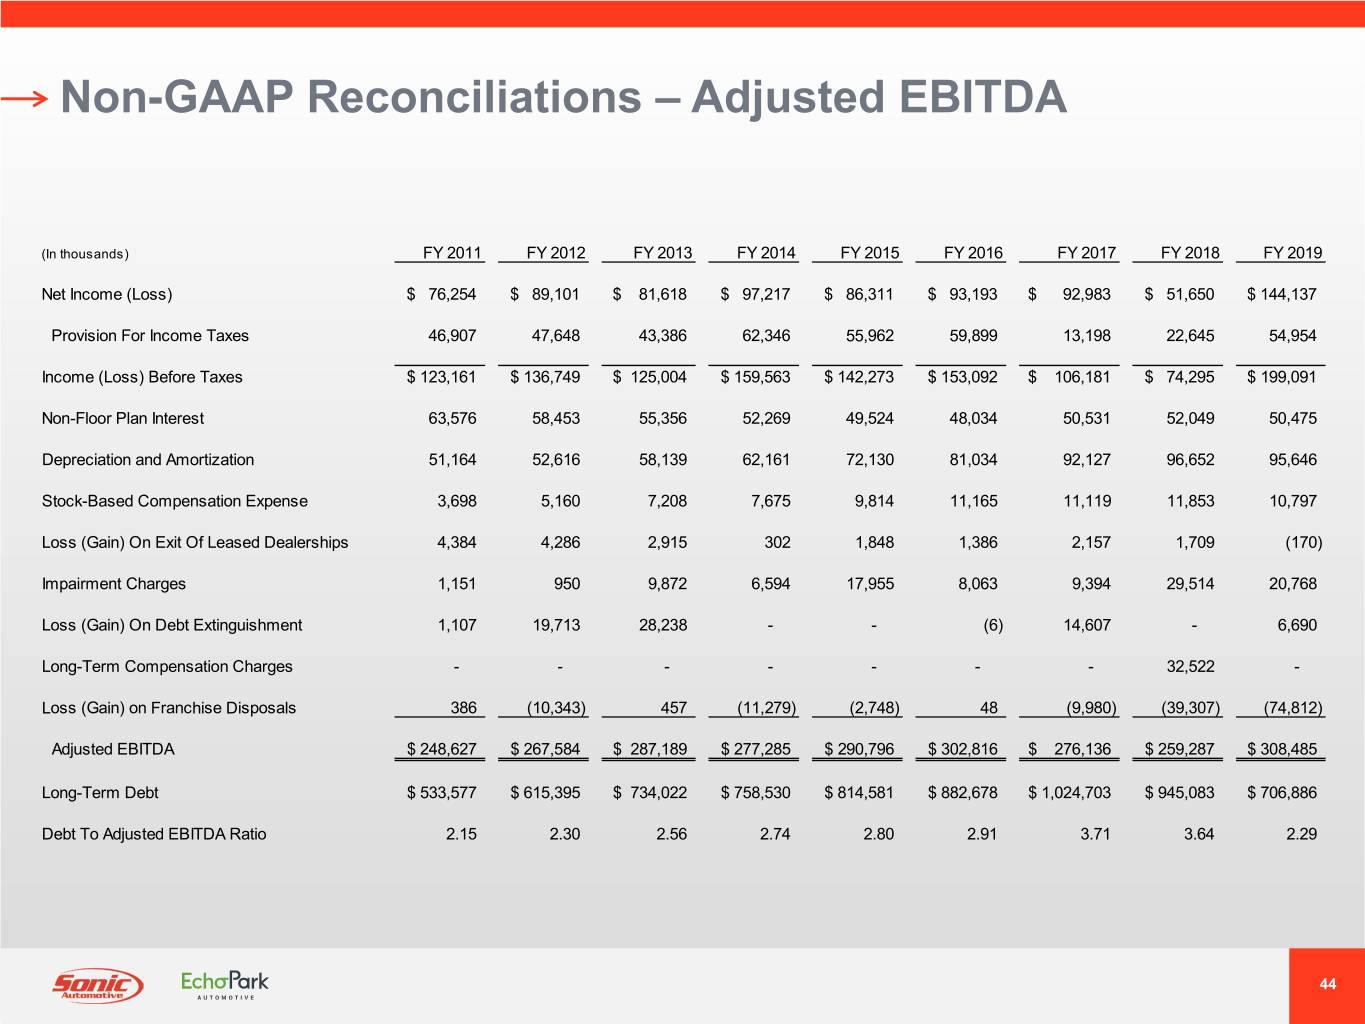
Non-GAAP Reconciliations – Adjusted EBITDA (In thousands) FY 2011 FY 2012 FY 2013 FY 2014 FY 2015 FY 2016 FY 2017 FY 2018 FY 2019 Net Income (Loss) $ 76,254 $ 89,101 $ 81,618 $ 97,217 $ 86,311 $ 93,193 $ 92,983 $ 51,650 $ 144,137 Provision For Income Taxes 46,907 47,648 43,386 62,346 55,962 59,899 13,198 22,645 54,954 Income (Loss) Before Taxes $ 123,161 $ 136,749 $ 125,004 $ 159,563 $ 142,273 $ 153,092 $ 106,181 $ 74,295 $ 199,091 Non-Floor Plan Interest 63,576 58,453 55,356 52,269 49,524 48,034 50,531 52,049 50,475 Depreciation and Amortization 51,164 52,616 58,139 62,161 72,130 81,034 92,127 96,652 95,646 Stock-Based Compensation Expense 3,698 5,160 7,208 7,675 9,814 11,165 11,119 11,853 10,797 Loss (Gain) On Exit Of Leased Dealerships 4,384 4,286 2,915 302 1,848 1,386 2,157 1,709 (170) Impairment Charges 1,151 950 9,872 6,594 17,955 8,063 9,394 29,514 20,768 Loss (Gain) On Debt Extinguishment 1,107 19,713 28,238 - - (6) 14,607 - 6,690 Long-Term Compensation Charges - - - - - - - 32,522 - Loss (Gain) on Franchise Disposals 386 (10,343) 457 (11,279) (2,748) 48 (9,980) (39,307) (74,812) Adjusted EBITDA $ 248,627 $ 267,584 $ 287,189 $ 277,285 $ 290,796 $ 302,816 $ 276,136 $ 259,287 $ 308,485 Long-Term Debt $ 533,577 $ 615,395 $ 734,022 $ 758,530 $ 814,581 $ 882,678 $ 1,024,703 $ 945,083 $ 706,886 Debt To Adjusted EBITDA Ratio 2.15 2.30 2.56 2.74 2.80 2.91 3.71 3.64 2.29 44
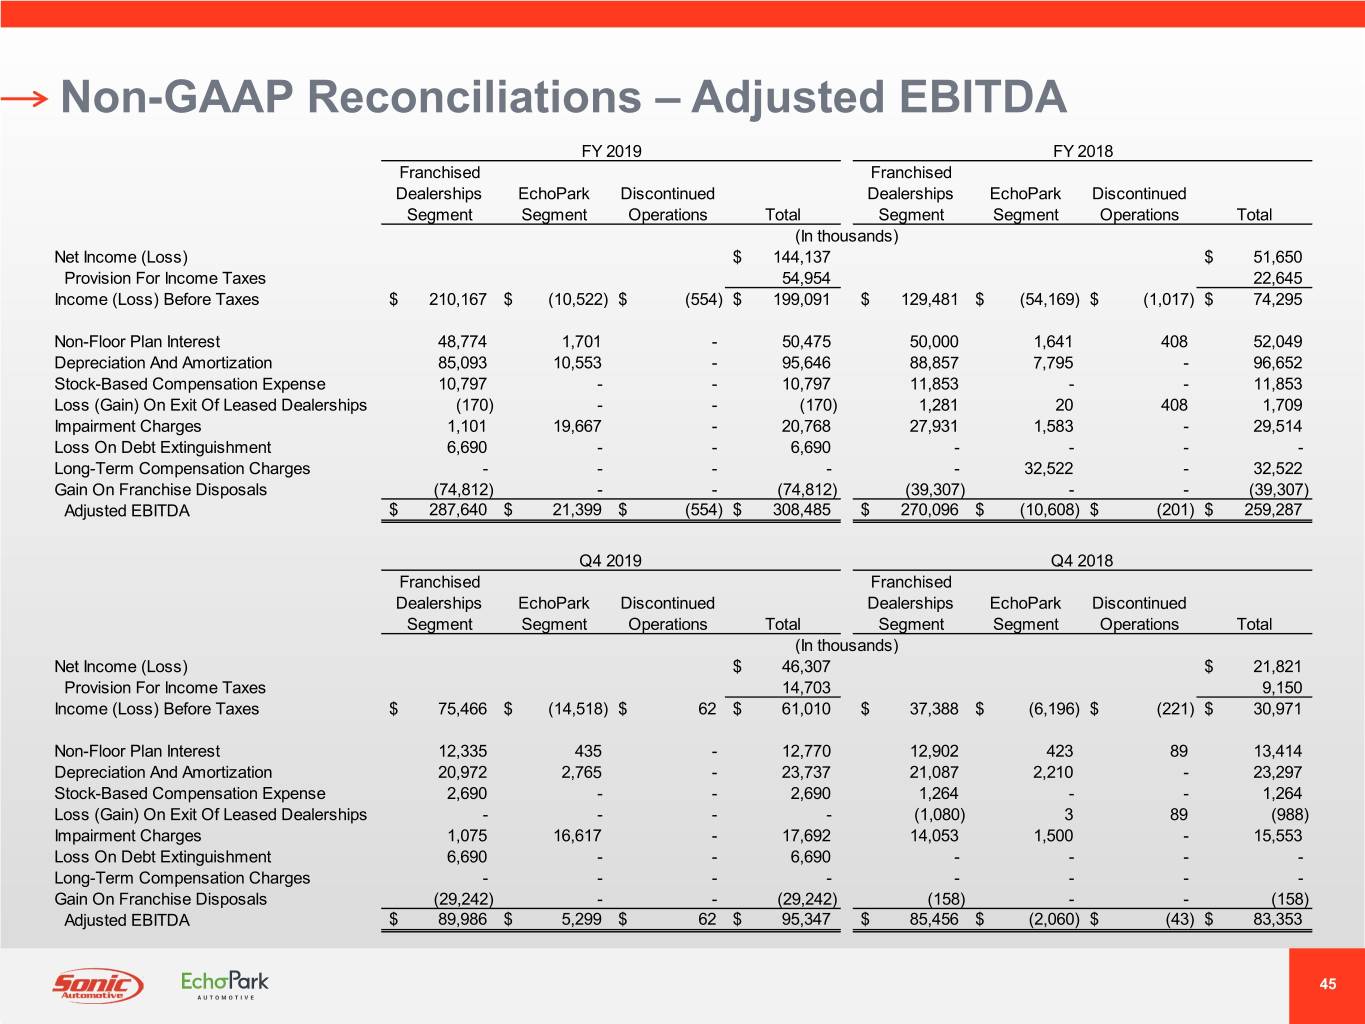
Non-GAAP Reconciliations – Adjusted EBITDA FY 2019 FY 2018 Franchised Franchised Dealerships EchoPark Discontinued Dealerships EchoPark Discontinued Segment Segment Operations Total Segment Segment Operations Total (In thousands) Net Income (Loss) $ 144,137 $ 51,650 Provision For Income Taxes 54,954 22,645 Income (Loss) Before Taxes $ 210,167 $ (10,522) $ (554) $ 199,091 $ 129,481 $ (54,169) $ (1,017) $ 74,295 Non-Floor Plan Interest 48,774 1,701 - 50,475 50,000 1,641 408 52,049 Depreciation And Amortization 85,093 10,553 - 95,646 88,857 7,795 - 96,652 Stock-Based Compensation Expense 10,797 - - 10,797 11,853 - - 11,853 Loss (Gain) On Exit Of Leased Dealerships (170) - - (170) 1,281 20 408 1,709 Impairment Charges 1,101 19,667 - 20,768 27,931 1,583 - 29,514 Loss On Debt Extinguishment 6,690 - - 6,690 - - - - Long-Term Compensation Charges - - - - - 32,522 - 32,522 Gain On Franchise Disposals (74,812) - - (74,812) (39,307) - - (39,307) Adjusted EBITDA $ 287,640 $ 21,399 $ (554) $ 308,485 $ 270,096 $ (10,608) $ (201) $ 259,287 Q4 2019 Q4 2018 Franchised Franchised Dealerships EchoPark Discontinued Dealerships EchoPark Discontinued Segment Segment Operations Total Segment Segment Operations Total (In thousands) Net Income (Loss) $ 46,307 $ 21,821 Provision For Income Taxes 14,703 9,150 Income (Loss) Before Taxes $ 75,466 $ (14,518) $ 62 $ 61,010 $ 37,388 $ (6,196) $ (221) $ 30,971 Non-Floor Plan Interest 12,335 435 - 12,770 12,902 423 89 13,414 Depreciation And Amortization 20,972 2,765 - 23,737 21,087 2,210 - 23,297 Stock-Based Compensation Expense 2,690 - - 2,690 1,264 - - 1,264 Loss (Gain) On Exit Of Leased Dealerships - - - - (1,080) 3 89 (988) Impairment Charges 1,075 16,617 - 17,692 14,053 1,500 - 15,553 Loss On Debt Extinguishment 6,690 - - 6,690 - - - - Long-Term Compensation Charges - - - - - - - - Gain On Franchise Disposals (29,242) - - (29,242) (158) - - (158) Adjusted EBITDA $ 89,986 $ 5,299 $ 62 $ 95,347 $ 85,456 $ (2,060) $ (43) $ 83,353 45
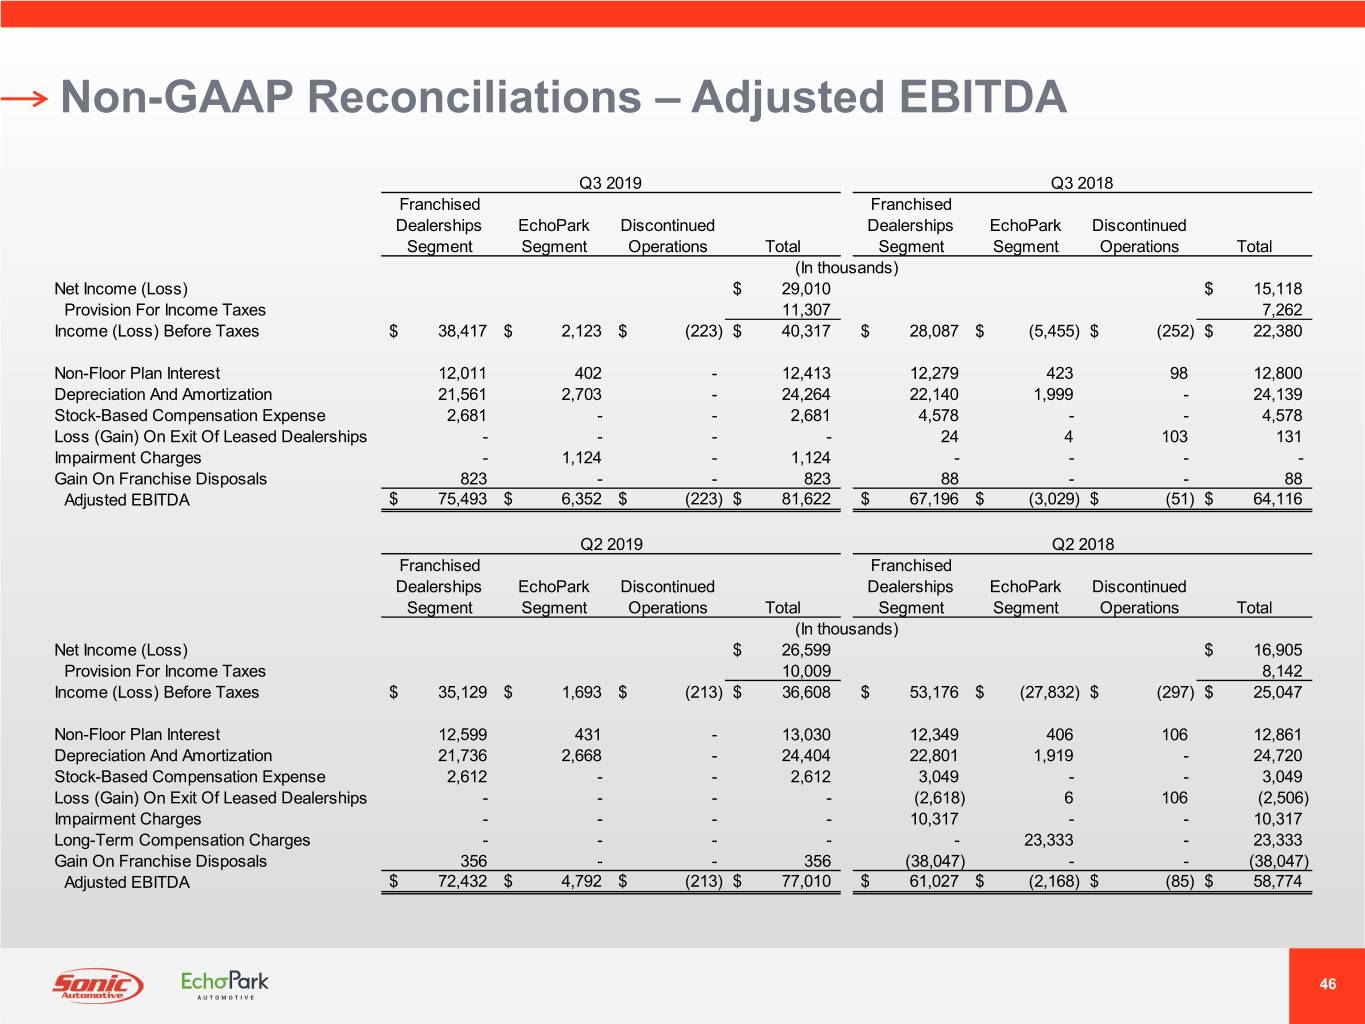
Non-GAAP Reconciliations – Adjusted EBITDA Q3 2019 Q3 2018 Franchised Franchised Dealerships EchoPark Discontinued Dealerships EchoPark Discontinued Segment Segment Operations Total Segment Segment Operations Total (In thousands) Net Income (Loss) $ 29,010 $ 15,118 Provision For Income Taxes 11,307 7,262 Income (Loss) Before Taxes $ 38,417 $ 2,123 $ (223) $ 40,317 $ 28,087 $ (5,455) $ (252) $ 22,380 Non-Floor Plan Interest 12,011 402 - 12,413 12,279 423 98 12,800 Depreciation And Amortization 21,561 2,703 - 24,264 22,140 1,999 - 24,139 Stock-Based Compensation Expense 2,681 - - 2,681 4,578 - - 4,578 Loss (Gain) On Exit Of Leased Dealerships - - - - 24 4 103 131 Impairment Charges - 1,124 - 1,124 - - - - Gain On Franchise Disposals 823 - - 823 88 - - 88 Adjusted EBITDA $ 75,493 $ 6,352 $ (223) $ 81,622 $ 67,196 $ (3,029) $ (51) $ 64,116 Q2 2019 Q2 2018 Franchised Franchised Dealerships EchoPark Discontinued Dealerships EchoPark Discontinued Segment Segment Operations Total Segment Segment Operations Total (In thousands) Net Income (Loss) $ 26,599 $ 16,905 Provision For Income Taxes 10,009 8,142 Income (Loss) Before Taxes $ 35,129 $ 1,693 $ (213) $ 36,608 $ 53,176 $ (27,832) $ (297) $ 25,047 Non-Floor Plan Interest 12,599 431 - 13,030 12,349 406 106 12,861 Depreciation And Amortization 21,736 2,668 - 24,404 22,801 1,919 - 24,720 Stock-Based Compensation Expense 2,612 - - 2,612 3,049 - - 3,049 Loss (Gain) On Exit Of Leased Dealerships - - - - (2,618) 6 106 (2,506) Impairment Charges - - - - 10,317 - - 10,317 Long-Term Compensation Charges - - - - - 23,333 - 23,333 Gain On Franchise Disposals 356 - - 356 (38,047) - - (38,047) Adjusted EBITDA $ 72,432 $ 4,792 $ (213) $ 77,010 $ 61,027 $ (2,168) $ (85) $ 58,774 46
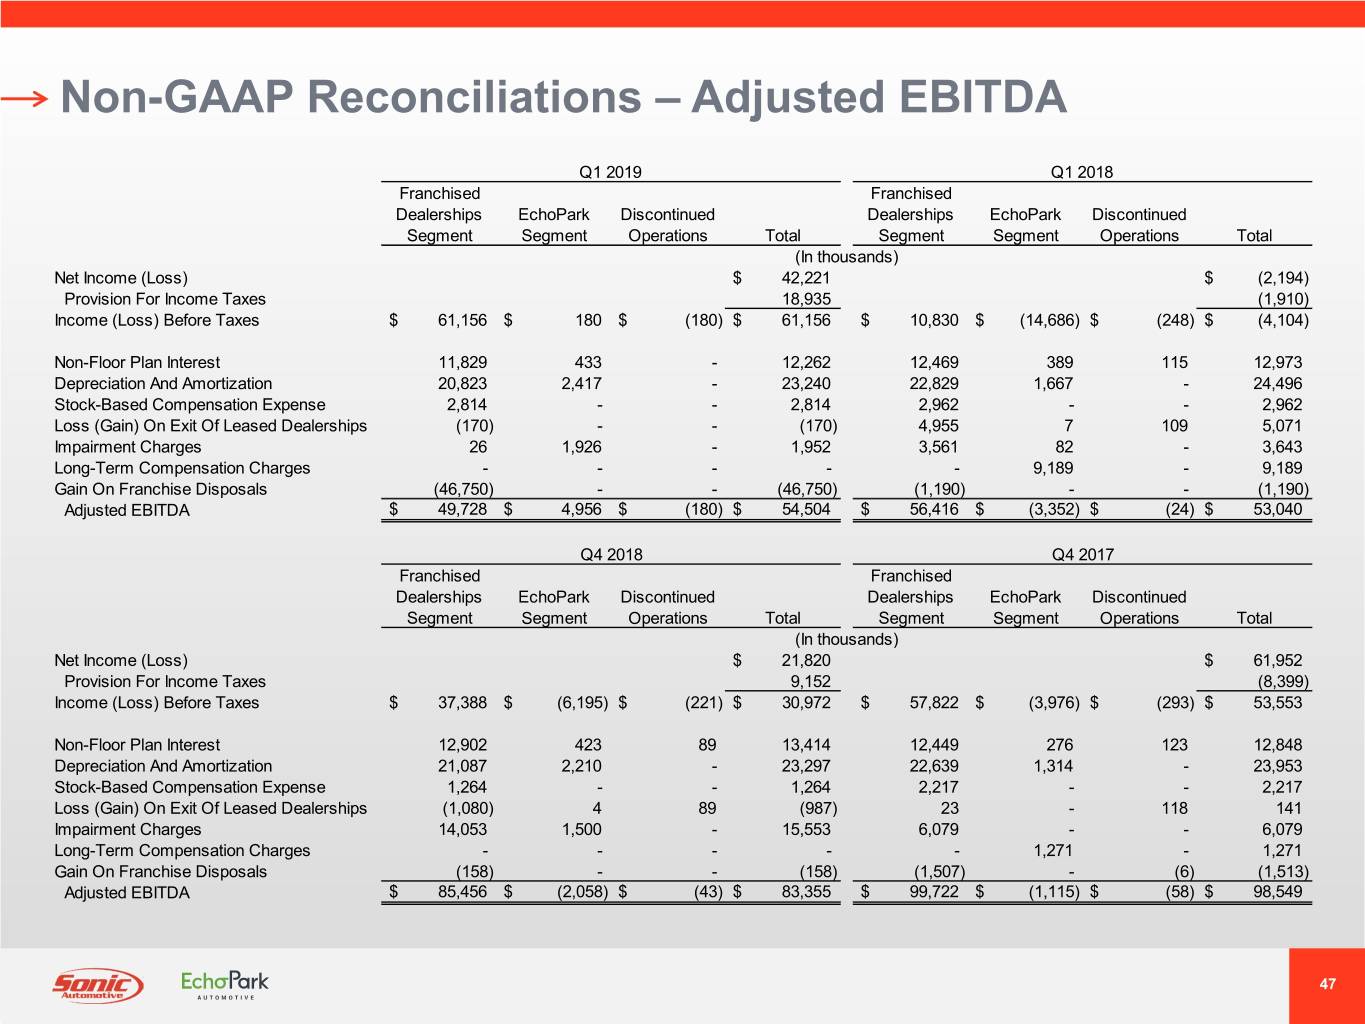
Non-GAAP Reconciliations – Adjusted EBITDA Q1 2019 Q1 2018 Franchised Franchised Dealerships EchoPark Discontinued Dealerships EchoPark Discontinued Segment Segment Operations Total Segment Segment Operations Total (In thousands) Net Income (Loss) $ 42,221 $ (2,194) Provision For Income Taxes 18,935 (1,910) Income (Loss) Before Taxes $ 61,156 $ 180 $ (180) $ 61,156 $ 10,830 $ (14,686) $ (248) $ (4,104) Non-Floor Plan Interest 11,829 433 - 12,262 12,469 389 115 12,973 Depreciation And Amortization 20,823 2,417 - 23,240 22,829 1,667 - 24,496 Stock-Based Compensation Expense 2,814 - - 2,814 2,962 - - 2,962 Loss (Gain) On Exit Of Leased Dealerships (170) - - (170) 4,955 7 109 5,071 Impairment Charges 26 1,926 - 1,952 3,561 82 - 3,643 Long-Term Compensation Charges - - - - - 9,189 - 9,189 Gain On Franchise Disposals (46,750) - - (46,750) (1,190) - - (1,190) Adjusted EBITDA $ 49,728 $ 4,956 $ (180) $ 54,504 $ 56,416 $ (3,352) $ (24) $ 53,040 Q4 2018 Q4 2017 Franchised Franchised Dealerships EchoPark Discontinued Dealerships EchoPark Discontinued Segment Segment Operations Total Segment Segment Operations Total (In thousands) Net Income (Loss) $ 21,820 $ 61,952 Provision For Income Taxes 9,152 (8,399) Income (Loss) Before Taxes $ 37,388 $ (6,195) $ (221) $ 30,972 $ 57,822 $ (3,976) $ (293) $ 53,553 Non-Floor Plan Interest 12,902 423 89 13,414 12,449 276 123 12,848 Depreciation And Amortization 21,087 2,210 - 23,297 22,639 1,314 - 23,953 Stock-Based Compensation Expense 1,264 - - 1,264 2,217 - - 2,217 Loss (Gain) On Exit Of Leased Dealerships (1,080) 4 89 (987) 23 - 118 141 Impairment Charges 14,053 1,500 - 15,553 6,079 - - 6,079 Long-Term Compensation Charges - - - - - 1,271 - 1,271 Gain On Franchise Disposals (158) - - (158) (1,507) - (6) (1,513) Adjusted EBITDA $ 85,456 $ (2,058) $ (43) $ 83,355 $ 99,722 $ (1,115) $ (58) $ 98,549 47
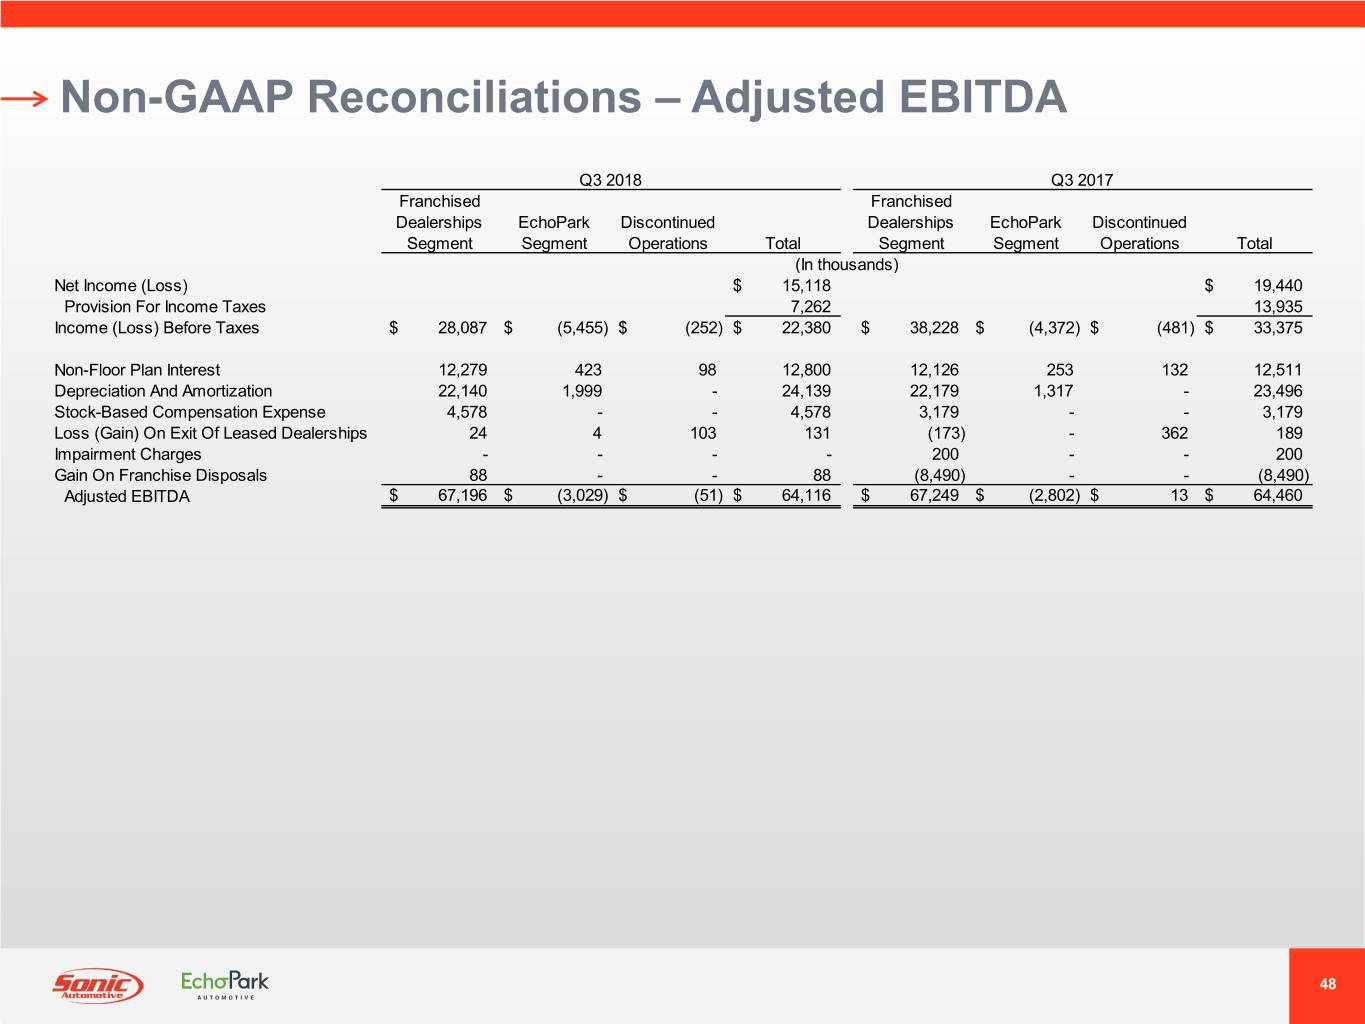
Non-GAAP Reconciliations – Adjusted EBITDA Q3 2018 Q3 2017 Franchised Franchised Dealerships EchoPark Discontinued Dealerships EchoPark Discontinued Segment Segment Operations Total Segment Segment Operations Total (In thousands) Net Income (Loss) $ 15,118 $ 19,440 Provision For Income Taxes 7,262 13,935 Income (Loss) Before Taxes $ 28,087 $ (5,455) $ (252) $ 22,380 $ 38,228 $ (4,372) $ (481) $ 33,375 Non-Floor Plan Interest 12,279 423 98 12,800 12,126 253 132 12,511 Depreciation And Amortization 22,140 1,999 - 24,139 22,179 1,317 - 23,496 Stock-Based Compensation Expense 4,578 - - 4,578 3,179 - - 3,179 Loss (Gain) On Exit Of Leased Dealerships 24 4 103 131 (173) - 362 189 Impairment Charges - - - - 200 - - 200 Gain On Franchise Disposals 88 - - 88 (8,490) - - (8,490) Adjusted EBITDA $ 67,196 $ (3,029) $ (51) $ 64,116 $ 67,249 $ (2,802) $ 13 $ 64,460 48

Investor Relations Contact: Sonic Automotive Inc. (NYSE: SAH) KCSA Strategic Communications Danny Wieland, Director of Financial Reporting David Hanover / Scott Eckstein ir@sonicautomotive.com sonic@kcsa.com (704) 927-3462 (212) 896-1220