
&YIJCJU Sonic Automotive 2020 Annual Meeting Of Stockholders April 29, 2020
Forward-Looking Statements This presentation contains “forward-looking statements” within the meaning of the Private Securities Litigation Reform Act of 1995. These statements relate to future events, are not historical facts and are based on our current expectations and assumptions regarding our business, the economy and other future conditions. These statements can generally be identified by lead-in words such as “may,” “will,” “should,” “could,” “believe,” “expect,” “estimate,” “anticipate,” “intend,” “plan,” “foresee” and other similar words or phrases. Statements that describe our Company’s objectives, plans or goals are also forward-looking statements. Examples of such forward-looking information we may be discussing in this presentation include, without limitation, the effects of COVID-19 on operations, anticipated future new vehicle unit sales volume, anticipated future used vehicle unit sales volume, anticipated future parts, service and collision repair (“Fixed Operations”) gross profit, anticipated expense reductions, long-term annual revenue targets, anticipated future growth and profitability in our EchoPark Segment, anticipated openings of new EchoPark stores, anticipated future performance and growth of our Franchised Dealerships Segment, anticipated liquidity positions, anticipated 2020 industry new vehicle sales volume, the implementation of growth and operating strategies, including acquisitions of dealerships and properties, the return of capital to stockholders, anticipated future success and impacts from the implementation of our strategic initiatives, and earnings per share expectations. You are cautioned that these forward-looking statements are not guarantees of future performance, involve risks and uncertainties and actual results may differ materially from those projected in the forward-looking statements as a result of various factors. These risks and uncertainties include, without limitation, economic conditions in the markets in which we operate, new and used vehicle industry sales volume, the success of our operational strategies, the rate and timing of overall economic expansion or contraction, and the risk factors described in the Company’s Annual Report on Form 10-K for the year ended December 31, 2019 and the Company’s other periodic reports and information filed with the Securities and Exchange Commission (the “SEC”). These forward-looking statements, risks, uncertainties and additional factors speak only as of the date of this presentation. We undertake no obligation to update any such statements, except as required under federal securities laws and the rules and regulations of the SEC. 2
Agenda 1. Welcome and Call to Order 2. Introduction of Meeting Chairperson David Smith - CEO 3. Report of a Quorum Mr. Peter Friz of CT Hagberg LLC - Inspector of Elections 4. Issues Before the Stockholders Stephen K. Coss - Secretary ‡ Election of Directors ‡ Ratification of the Appointment of KPMG LLP as Sonic’s Independent Public Accounting Firm ‡ Advisory Vote on Executive Compensation ‡ Approval of Amendment and Restatement of Sonic’s 2012 Formula Restricted Stock and Deferral Plan for Non-Employee Directors 5. Report On Operations/Financial Results for FY 2019 Heath R. Byrd – EVP/CFO 6. Report of the Inspector of Elections Mr. Peter Friz of CT Hagberg LLC - Inspector of Elections 7. Adjournment Stephen K. Coss - Secretary 8. Q&A Management Team 3
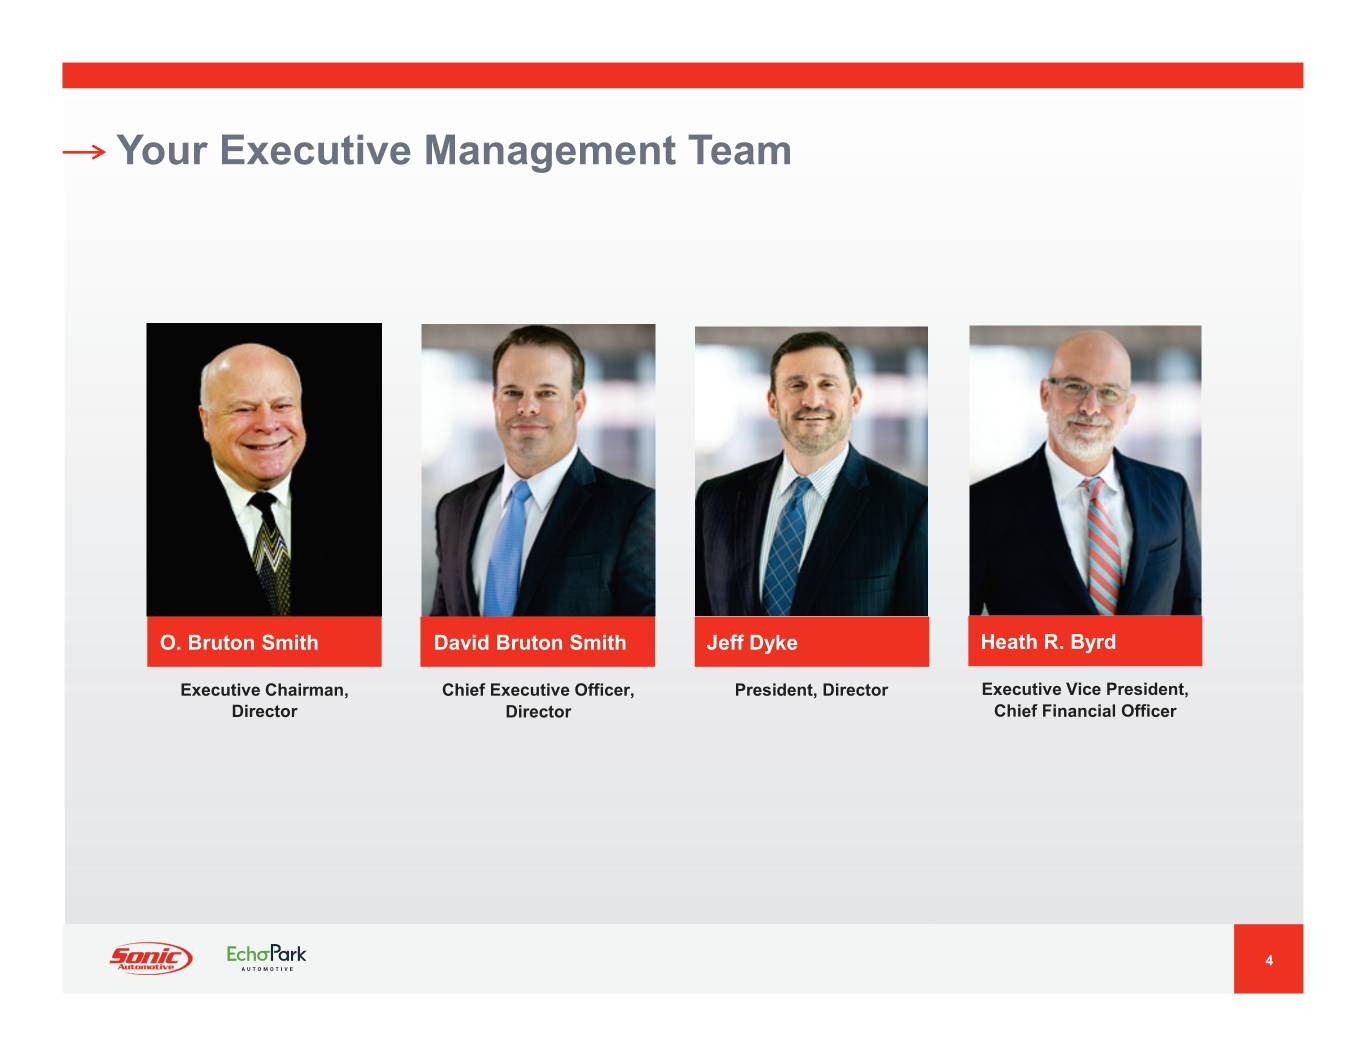
Your Executive Management Team O. Bruton Smith David Bruton Smith Jeff Dyke Heath R. Byrd Executive Chairman, Chief Executive Officer, President, Director Executive Vice President, Director Director Chief Financial Officer 4
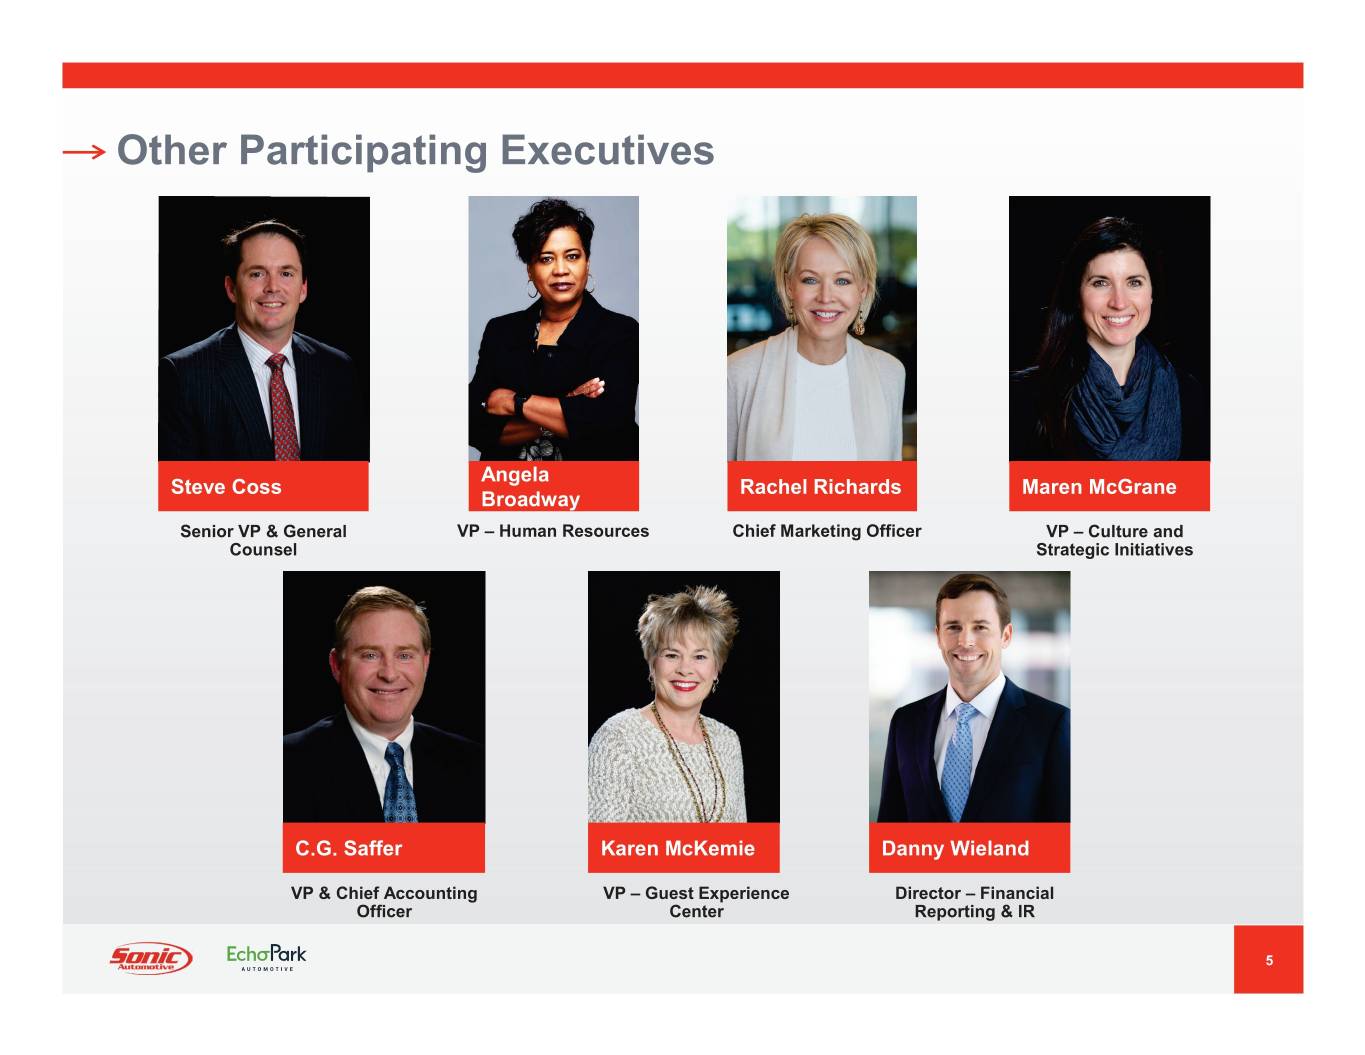
Other Participating Executives Angela Steve Coss Rachel Richards Maren McGrane Broadway Senior VP & General VP – Human Resources Chief Marketing Officer VP – Culture and Counsel Strategic Initiatives C.G. Saffer Karen McKemie Danny Wieland VP & Chief Accounting VP – Guest Experience Director – Financial Officer Center Reporting & IR 5

Report of A Quorum 6
Issues Before Stockholders ‡ Election of Directors ‡ Ratification of the Appointment of KPMG LLP as Sonic’s Independent Public Accounting Firm ‡ Advisory Vote on Executive Compensation ‡ Approval of Amendment and Restatement of Sonic’s 2012 Formula Restricted Stock and Deferral Plan for Non-Employee Directors 7
Report of Operations and Financial Results for 2019 Fiscal Year 8
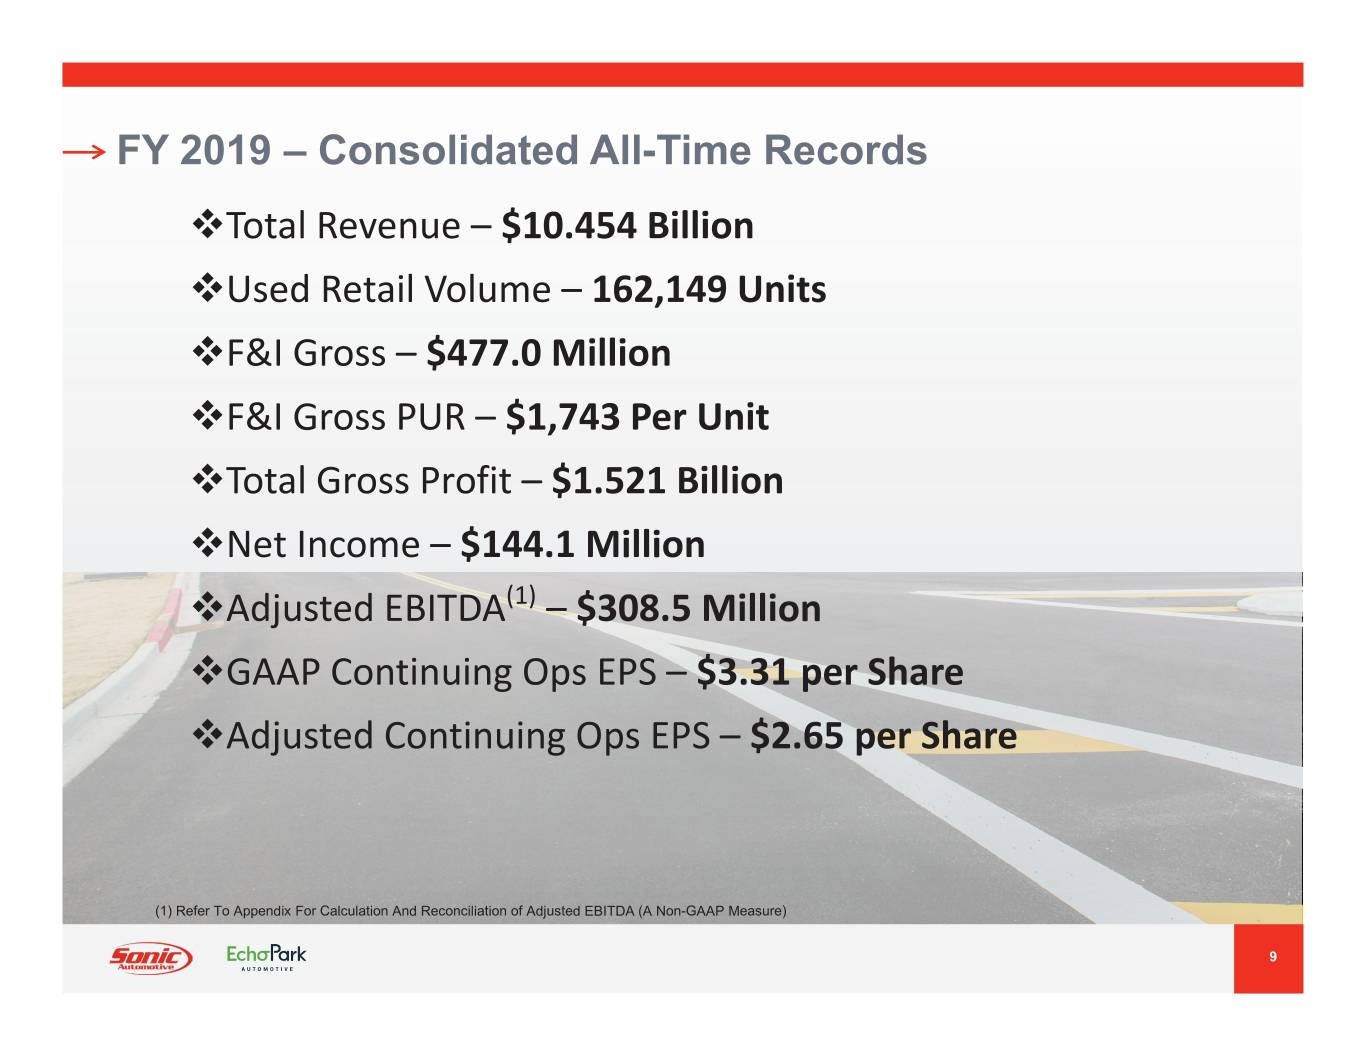
FY 2019 – Consolidated All-Time Records ™Total Revenue – $10.454 Billion ™Used Retail Volume – 162,149 Units ™F&I Gross – $477.0 Million ™F&I Gross PUR – $1,743 Per Unit ™Total Gross Profit – $1.521 Billion ™Net Income – $144.1 Million ™Adjusted EBITDA(1) – $308.5 Million ™GAAP Continuing Ops EPS – $3.31 per Share ™Adjusted Continuing Ops EPS – $2.65 per Share (1) Refer To Appendix For Calculation And Reconciliation of Adjusted EBITDA (A Non-GAAP Measure) 9
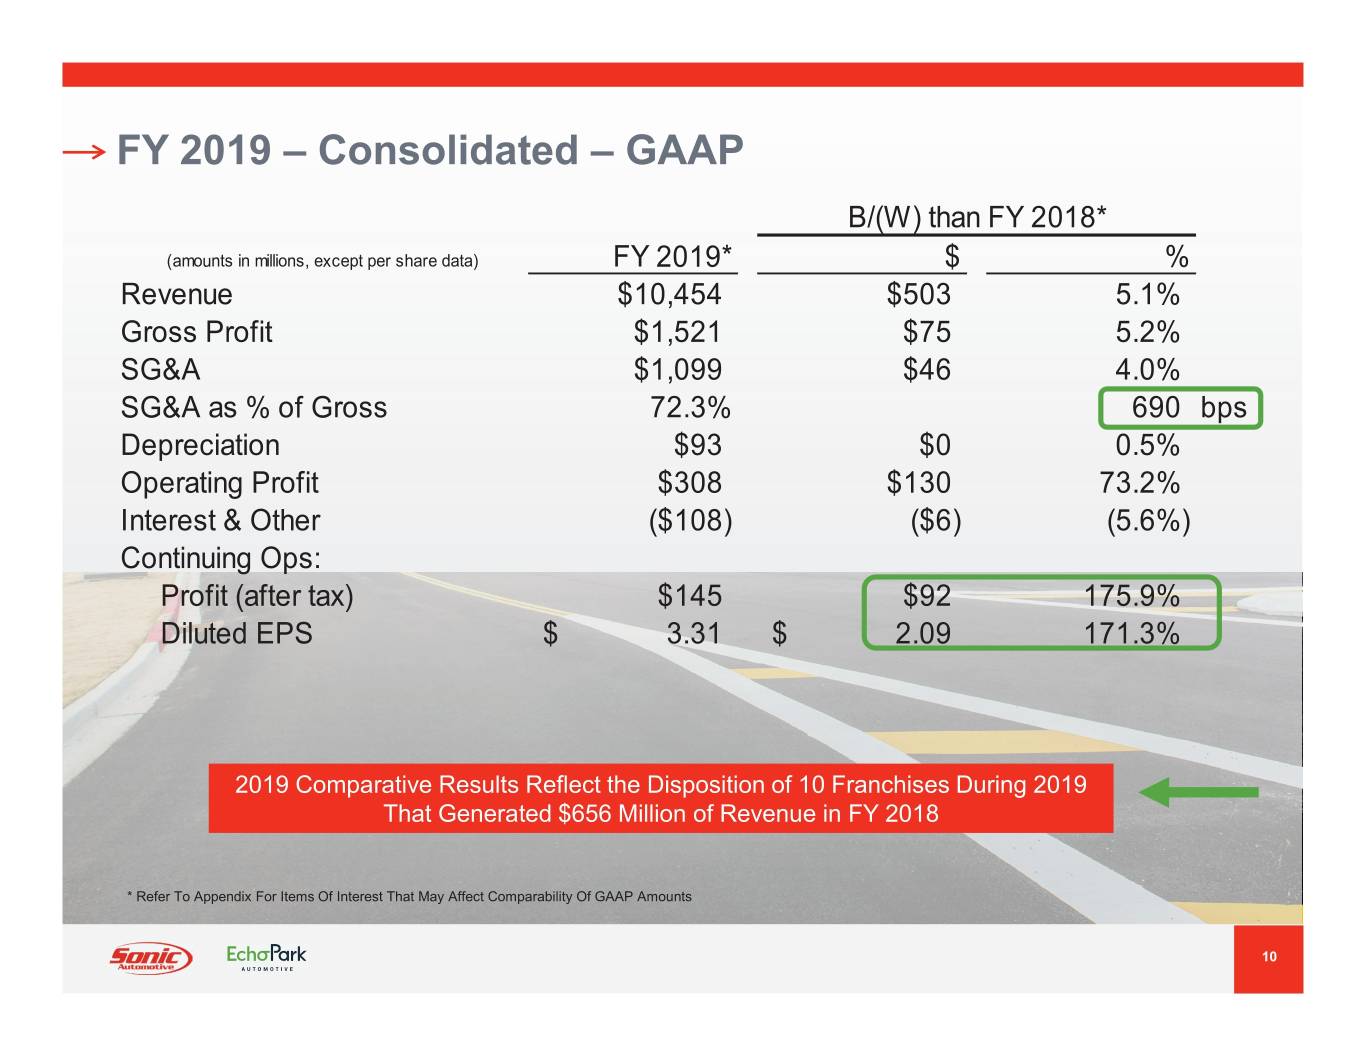
FY 2019 – Consolidated – GAAP B/(W) than FY 2018* (amounts in millions, except per share data) FY 2019* $ % Revenue $10,454 $503 5.1% Gross Profit $1,521 $75 5.2% SG&A $1,099 $46 4.0% SG&A as % of Gross 72.3% 690 bps Depreciation $93 $0 0.5% Operating Profit $308 $130 73.2% Interest & Other ($108) ($6) (5.6%) Continuing Ops: Profit (after tax) $145 $92 175.9% Diluted EPS $ 3.31 $ 2.09 171.3% 2019 Comparative Results Reflect the Disposition of 10 Franchises During 2019 That Generated $656 Million of Revenue in FY 2018 * Refer To Appendix For Items Of Interest That May Affect Comparability Of GAAP Amounts 10
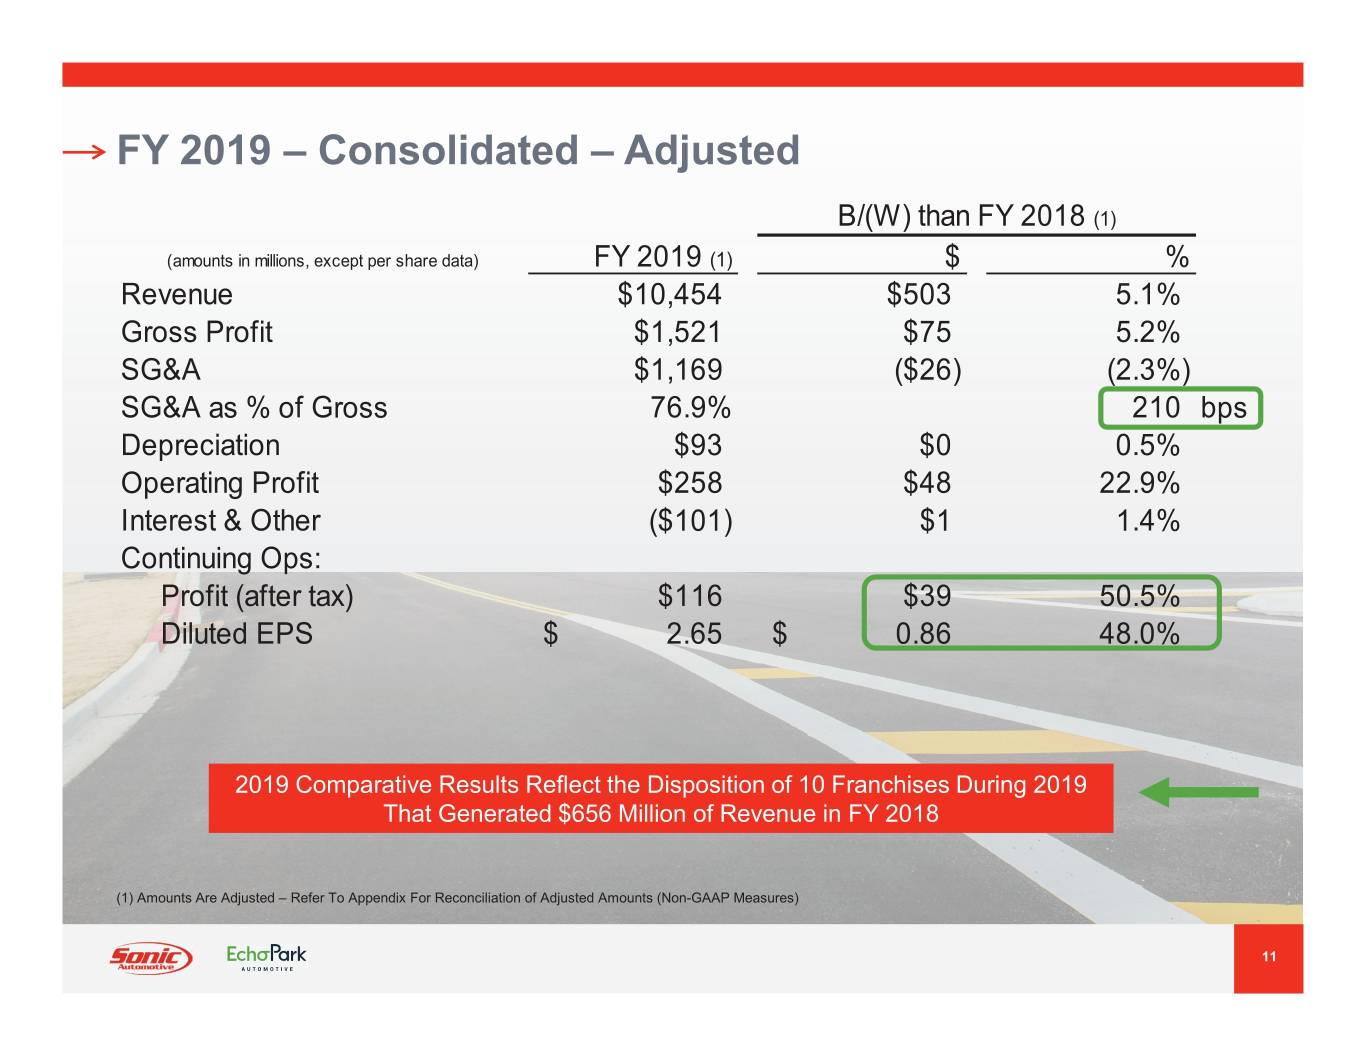
FY 2019 – Consolidated – Adjusted B/(W) than FY 2018(1) (amounts in millions, except per share data) FY 2019 (1) $% Revenue $10,454 $503 5.1% Gross Profit $1,521 $75 5.2% SG&A $1,169 ($26) (2.3%) SG&A as % of Gross 76.9% 210 bps Depreciation $93 $0 0.5% Operating Profit $258 $48 22.9% Interest & Other ($101) $1 1.4% Continuing Ops: Profit (after tax) $116 $39 50.5% Diluted EPS $ 2.65 $ 0.86 48.0% 2019 Comparative Results Reflect the Disposition of 10 Franchises During 2019 That Generated $656 Million of Revenue in FY 2018 (1) Amounts Are Adjusted – Refer To Appendix For Reconciliation of Adjusted Amounts (Non-GAAP Measures) 11
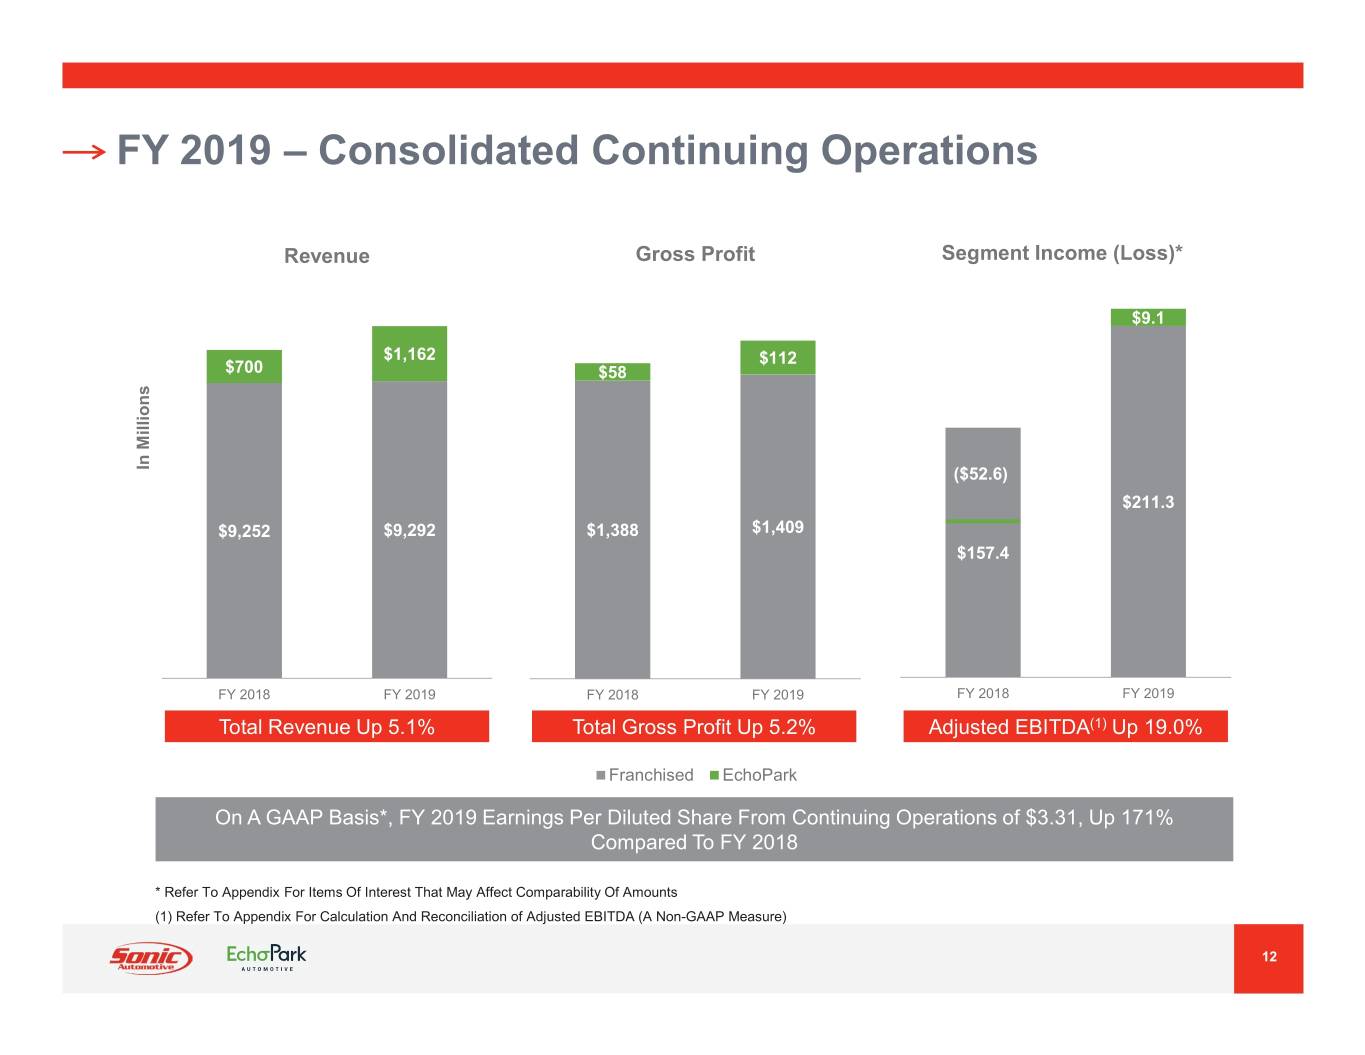
FY 2019 – Consolidated Continuing Operations Revenue Gross Profit Segment Income (Loss)* $9.1 $1,162 $112 $700 $58 In Millions ($52.6) $211.3 $9,252 $9,292 $1,388 $1,409 $157.4 FY 2018 FY 2019 FY 2018 FY 2019 FY 2018 FY 2019 Total Revenue Up 5.1% Total Gross Profit Up 5.2% Adjusted EBITDA(1) Up 19.0% Franchised EchoPark On A GAAP Basis*, FY 2019 Earnings Per Diluted Share From Continuing Operations of $3.31, Up 171% Compared To FY 2018 * Refer To Appendix For Items Of Interest That May Affect Comparability Of Amounts (1) Refer To Appendix For Calculation And Reconciliation of Adjusted EBITDA (A Non-GAAP Measure) 12
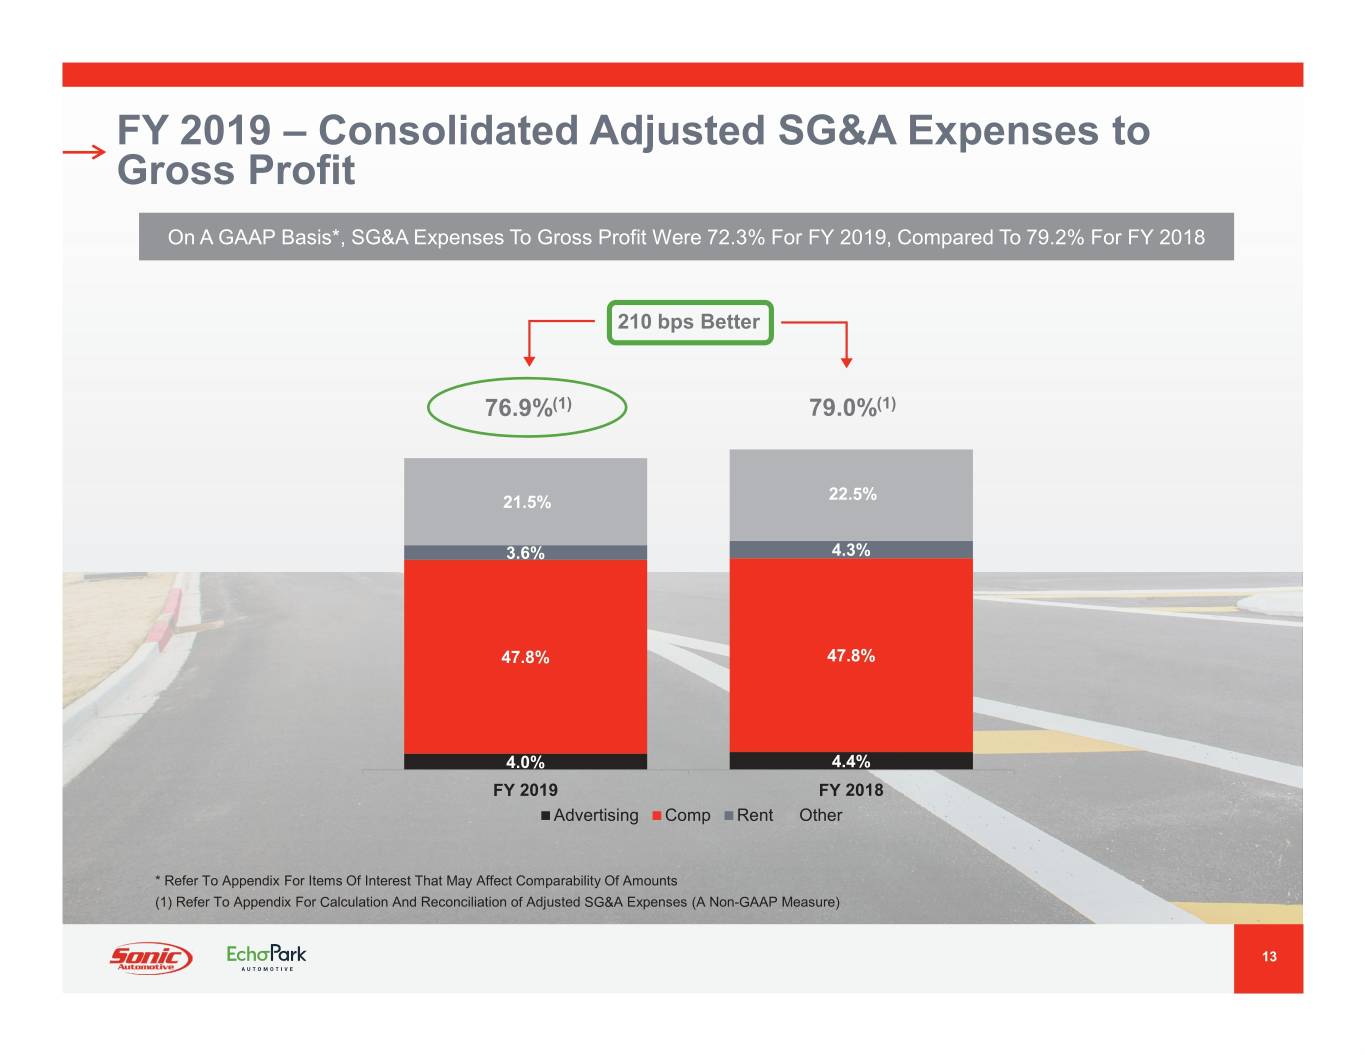
FY 2019 – Consolidated Adjusted SG&A Expenses to Gross Profit On A GAAP Basis*, SG&A Expenses To Gross Profit Were 72.3% For FY 2019, Compared To 79.2% For FY 2018 210 bps Better 76.9%(1) 79.0%(1) 21.5% 22.5% 3.6% 4.3% 47.8% 47.8% 4.0% 4.4% FY 2019 FY 2018 Advertising Comp Rent Other * Refer To Appendix For Items Of Interest That May Affect Comparability Of Amounts (1) Refer To Appendix For Calculation And Reconciliation of Adjusted SG&A Expenses (A Non-GAAP Measure) 13
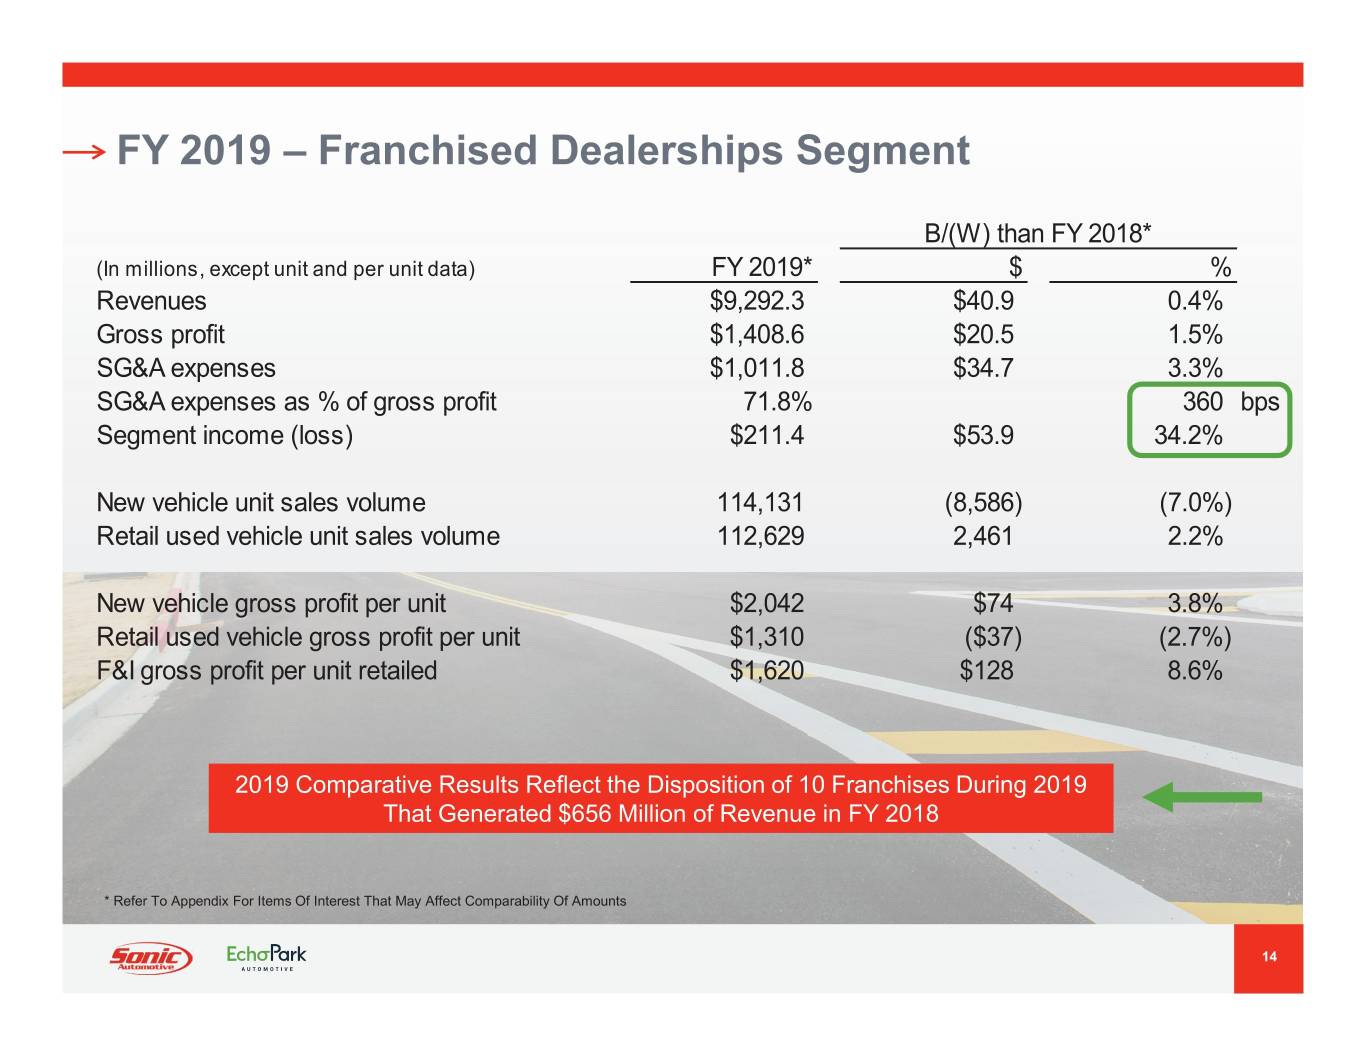
FY 2019 – Franchised Dealerships Segment B/(W) than FY 2018* (In millions, except unit and per unit data) FY 2019* $ % Revenues $9,292.3 $40.9 0.4% Gross profit $1,408.6 $20.5 1.5% SG&A expenses $1,011.8 $34.7 3.3% SG&A expenses as % of gross profit 71.8% 360 bps Segment income (loss) $211.4 $53.9 34.2% New vehicle unit sales volume 114,131 (8,586) (7.0%) Retail used vehicle unit sales volume 112,629 2,461 2.2% New vehicle gross profit per unit $2,042 $74 3.8% Retail used vehicle gross profit per unit $1,310 ($37) (2.7%) F&I gross profit per unit retailed $1,620 $128 8.6% 2019 Comparative Results Reflect the Disposition of 10 Franchises During 2019 That Generated $656 Million of Revenue in FY 2018 * Refer To Appendix For Items Of Interest That May Affect Comparability Of Amounts 14
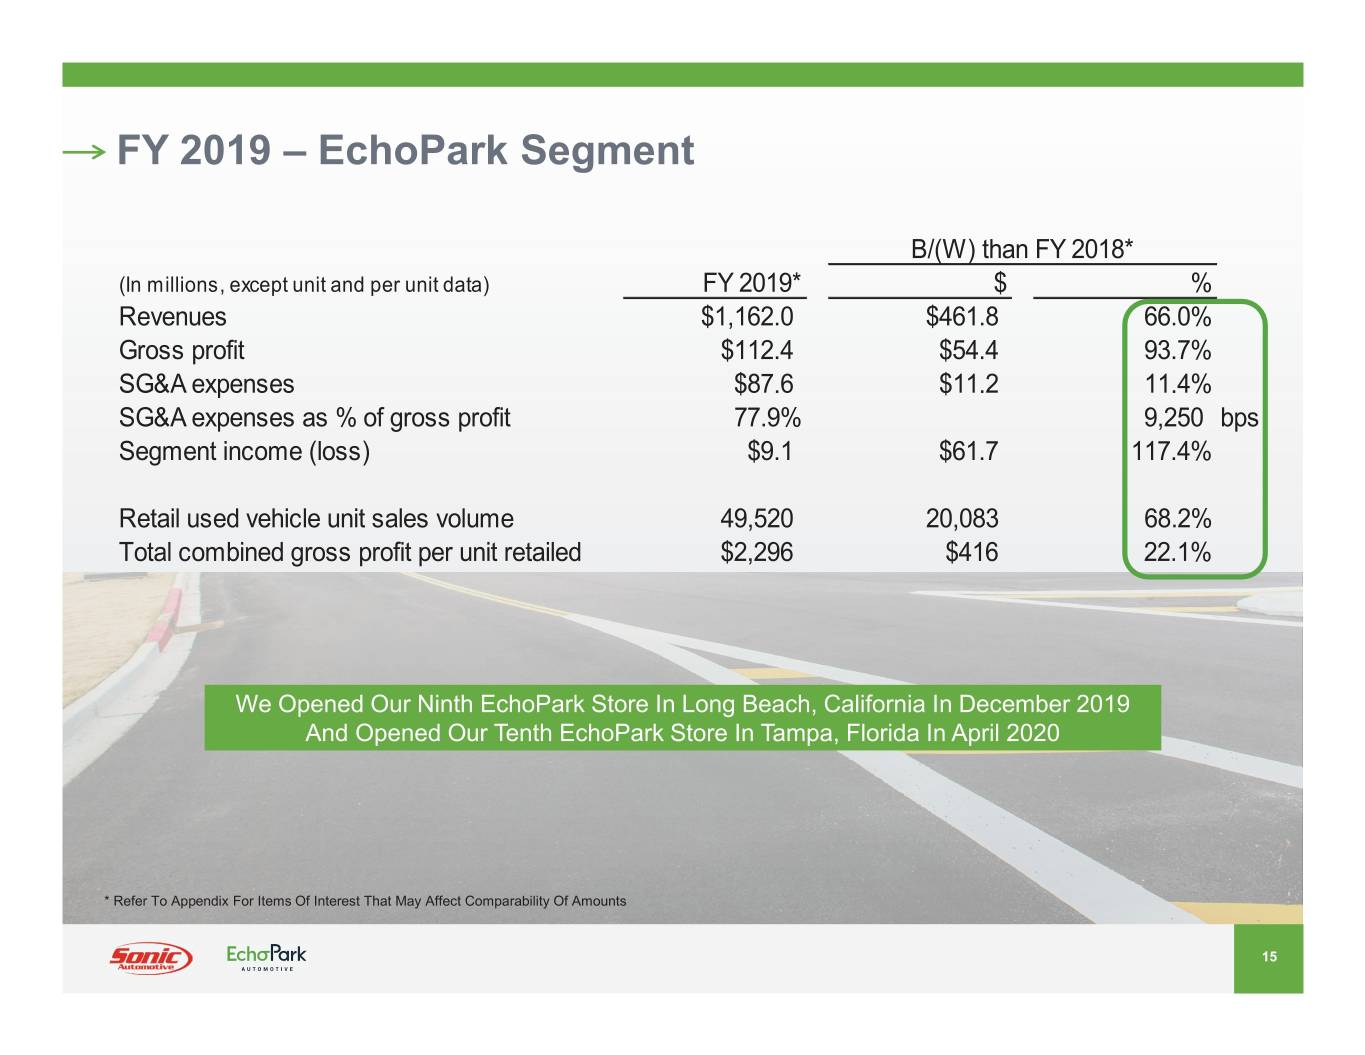
FY 2019 – EchoPark Segment B/(W) than FY 2018* (In millions, except unit and per unit data) FY 2019* $ % Revenues $1,162.0 $461.8 66.0% Gross profit $112.4 $54.4 93.7% SG&A expenses $87.6 $11.2 11.4% SG&A expenses as % of gross profit 77.9% 9,250 bps Segment income (loss) $9.1 $61.7 117.4% Retail used vehicle unit sales volume 49,520 20,083 68.2% Total combined gross profit per unit retailed $2,296 $416 22.1% We Opened Our Ninth EchoPark Store In Long Beach, California In December 2019 And Opened Our Tenth EchoPark Store In Tampa, Florida In April 2020 * Refer To Appendix For Items Of Interest That May Affect Comparability Of Amounts 15
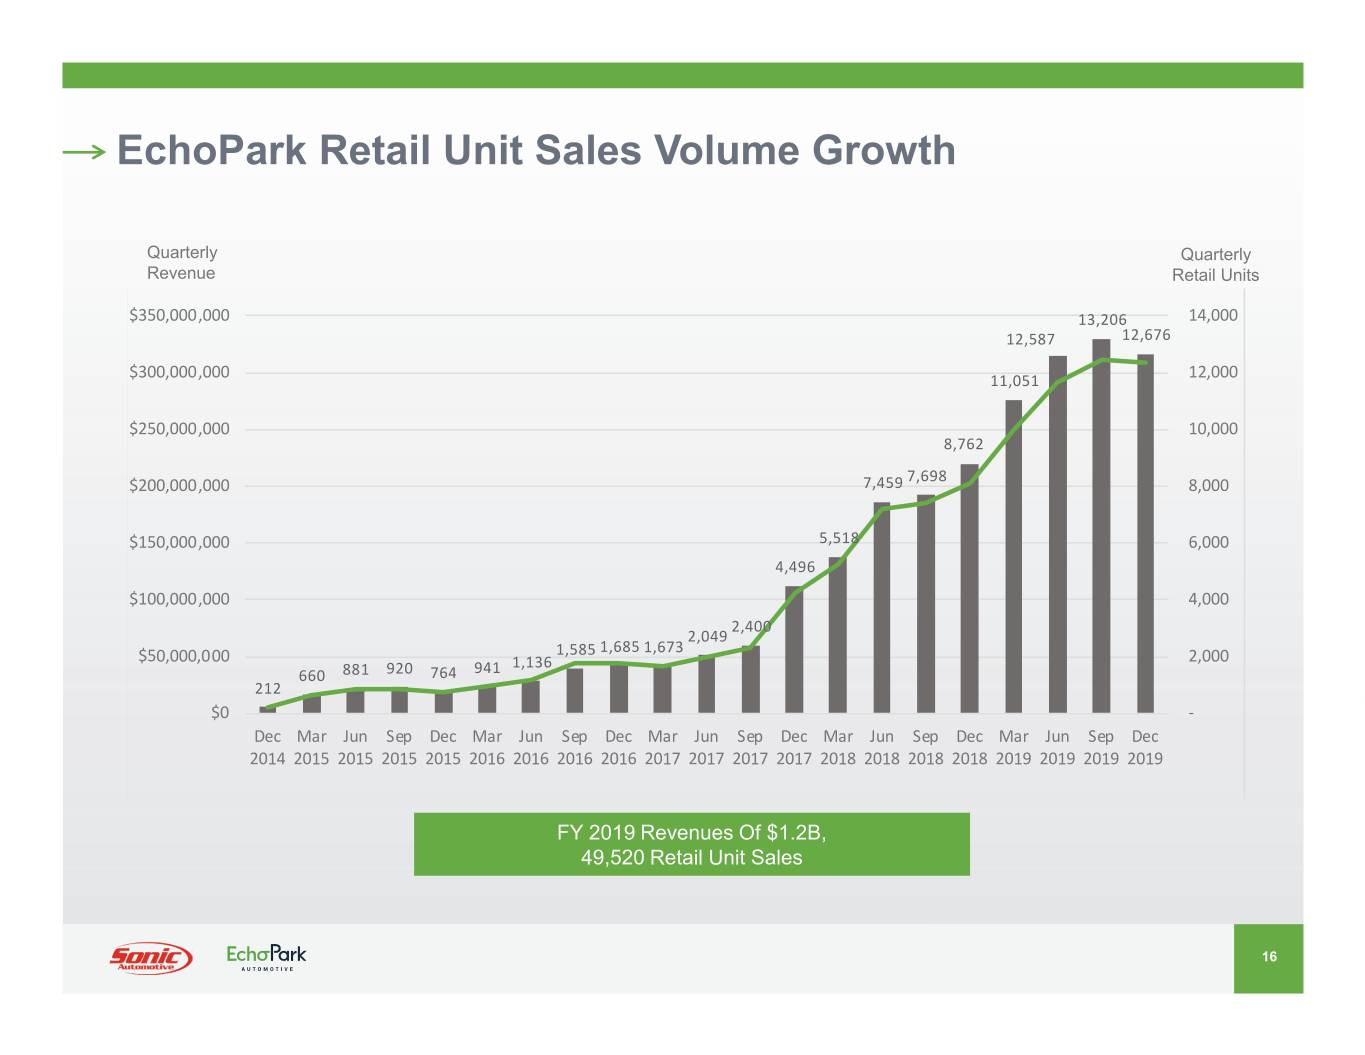
EchoPark Retail Unit Sales Volume Growth Quarterly Quarterly Revenue Retail Units $350,000,000 13,206 14,000 12,587 12,676 $300,000,000 11,051 12,000 $250,000,000 10,000 8,762 7,698 $200,000,000 7,459 8,000 $150,000,000 5,518 6,000 4,496 $100,000,000 4,000 2,400 2,049 1,585 1,685 1,673 $50,000,000 1,136 2,000 660 881 920 764 941 212 $0 - Dec Mar Jun Sep Dec Mar Jun Sep Dec Mar Jun Sep Dec Mar Jun Sep Dec Mar Jun Sep Dec 2014 2015 2015 2015 2015 2016 2016 2016 2016 2017 2017 2017 2017 2018 2018 2018 2018 2019 2019 2019 2019 FY 2019 Revenues Of $1.2B, 49,520 Retail Unit Sales 16
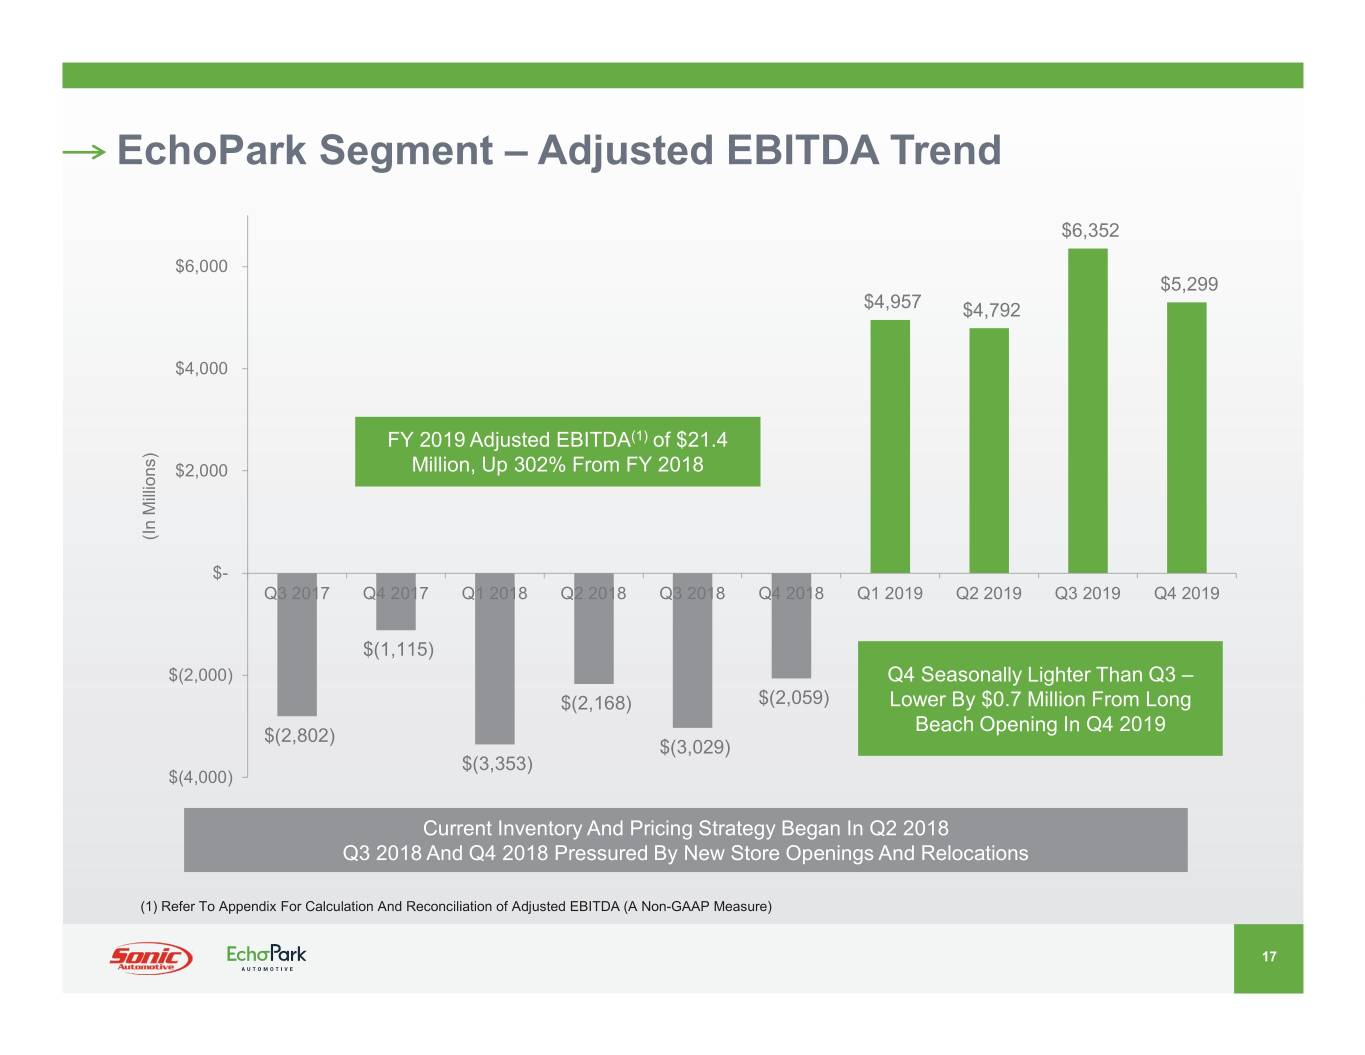
EchoPark Segment – Adjusted EBITDA Trend $6,352 $6,000 $5,299 $4,957 $4,792 $4,000 FY 2019 Adjusted EBITDA(1) of $21.4 $2,000 Million, Up 302% From FY 2018 (In Millions) $- Q3 2017 Q4 2017 Q1 2018 Q2 2018 Q3 2018 Q4 2018 Q1 2019 Q2 2019 Q3 2019 Q4 2019 $(1,115) $(2,000) Q4 Seasonally Lighter Than Q3 – $(2,168) $(2,059) Lower By $0.7 Million From Long Beach Opening In Q4 2019 $(2,802) $(3,029) $(3,353) $(4,000) Current Inventory And Pricing Strategy Began In Q2 2018 Q3 2018 And Q4 2018 Pressured By New Store Openings And Relocations (1) Refer To Appendix For Calculation And Reconciliation of Adjusted EBITDA (A Non-GAAP Measure) 17
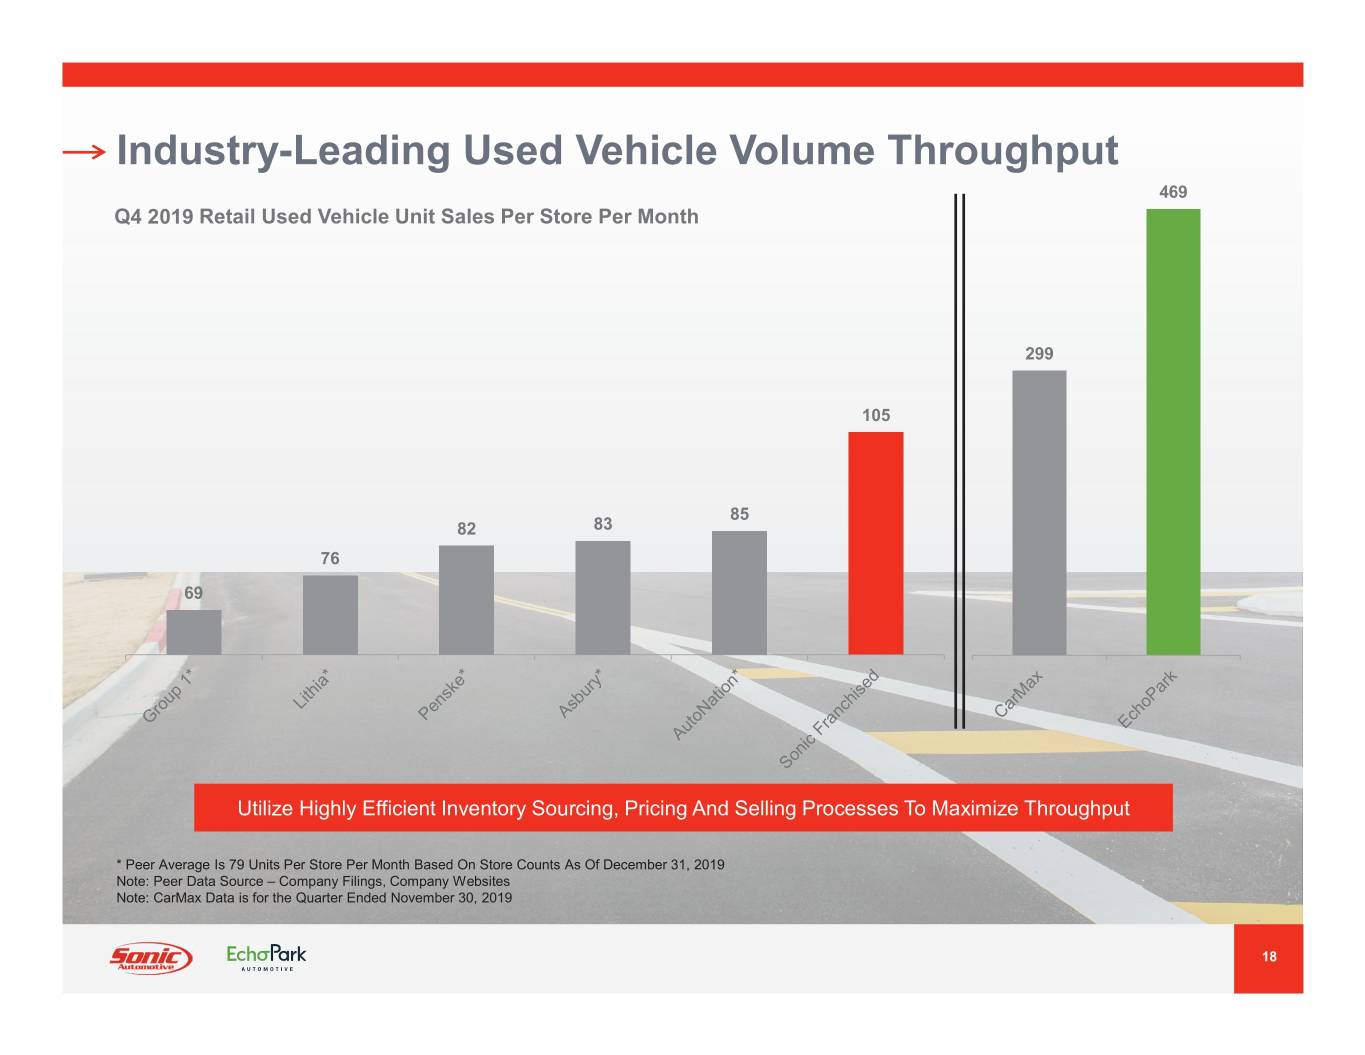
Industry-Leading Used Vehicle Volume Throughput 469 Q4 2019 Retail Used Vehicle Unit Sales Per Store Per Month 299 105 85 82 83 76 69 Utilize Highly Efficient Inventory Sourcing, Pricing And Selling Processes To Maximize Throughput * Peer Average Is 79 Units Per Store Per Month Based On Store Counts As Of December 31, 2019 Note: Peer Data Source – Company Filings, Company Websites Note: CarMax Data is for the Quarter Ended November 30, 2019 18
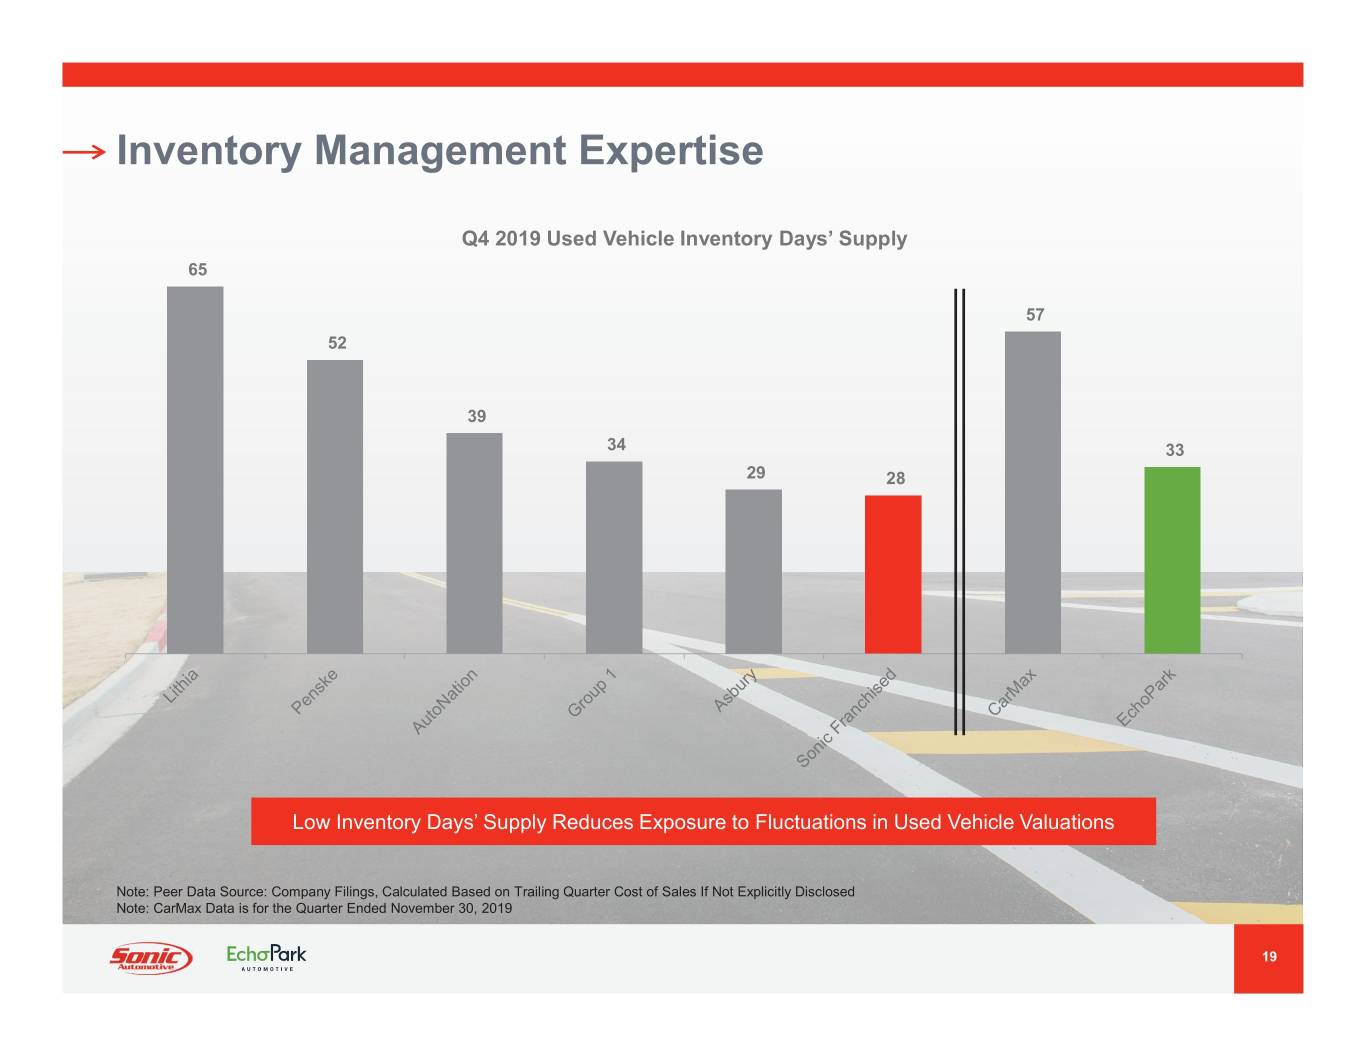
Inventory Management Expertise Q4 2019 Used Vehicle Inventory Days’ Supply 65 57 52 39 34 33 29 28 Low Inventory Days’ Supply Reduces Exposure to Fluctuations in Used Vehicle Valuations Note: Peer Data Source: Company Filings, Calculated Based on Trailing Quarter Cost of Sales If Not Explicitly Disclosed Note: CarMax Data is for the Quarter Ended November 30, 2019 19
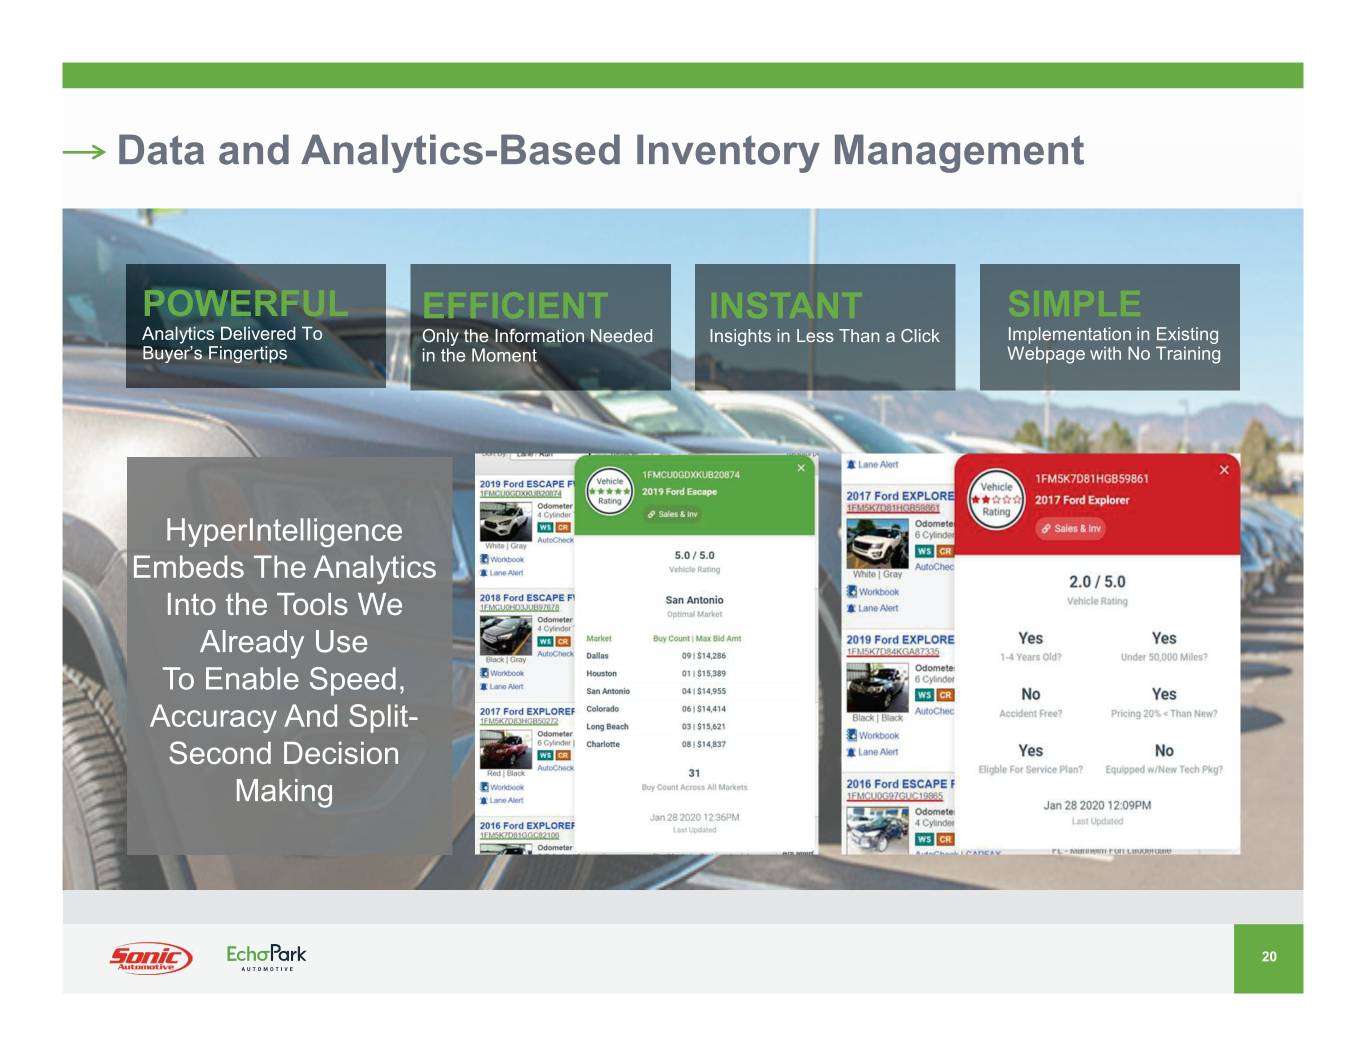
Data and Analytics-Based Inventory Management POWERFUL EFFICIENT INSTANT SIMPLE Analytics Delivered To Only the Information Needed Insights in Less Than a Click Implementation in Existing Buyer’s Fingertips in the Moment Webpage with No Training HyperIntelligence Embeds The Analytics Into the Tools We Already Use To Enable Speed, Accuracy And Split- Second Decision Making 20
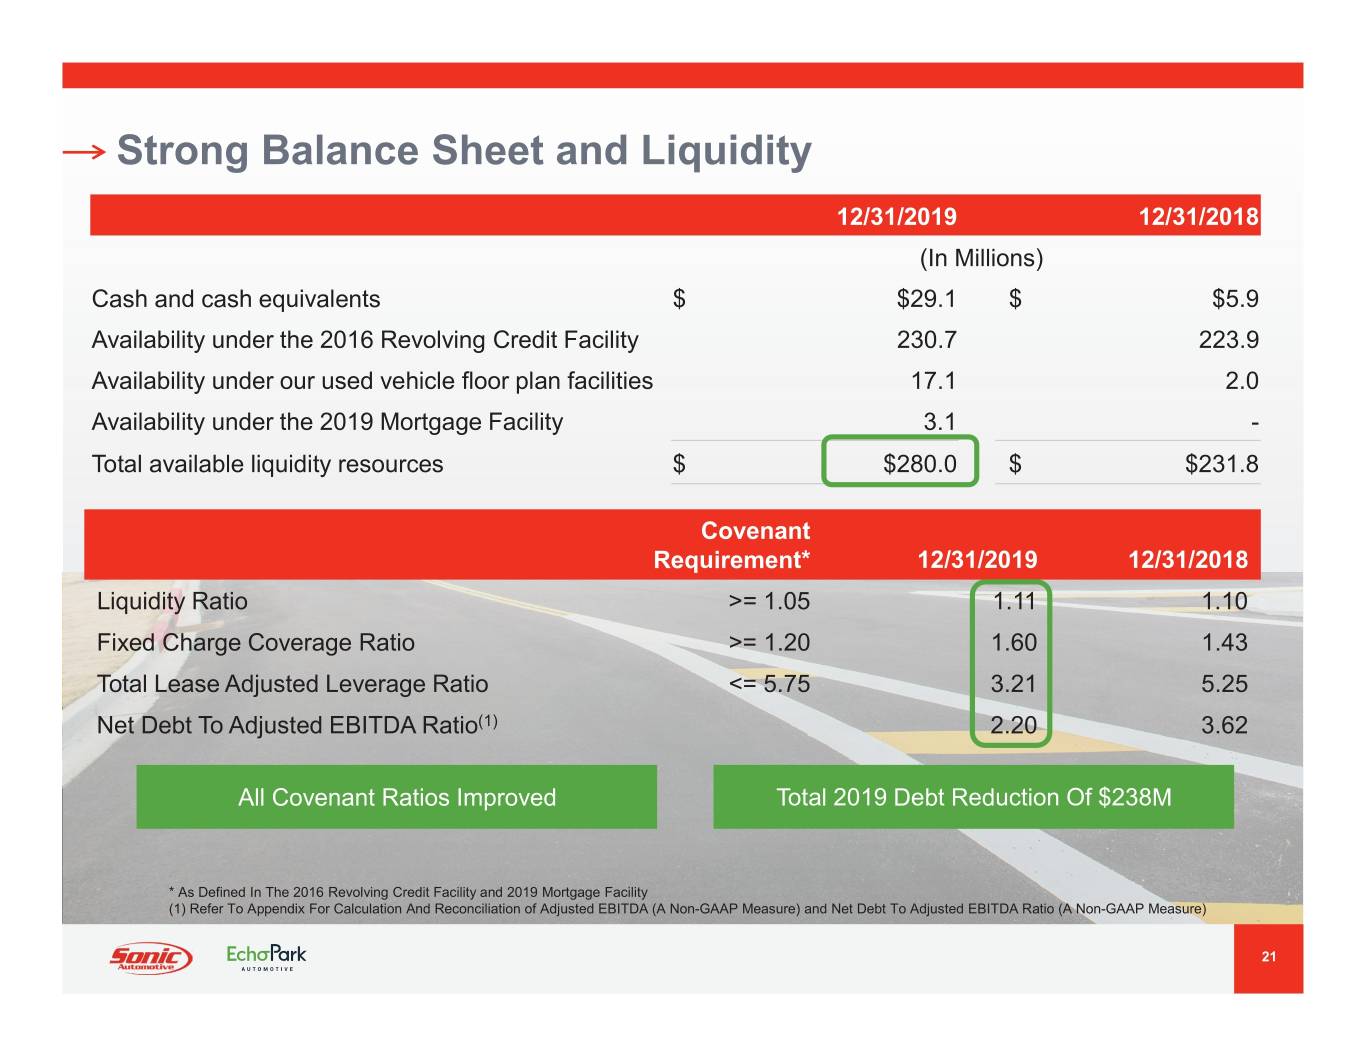
Strong Balance Sheet and Liquidity 12/31/2019 12/31/2018 (In Millions) Cash and cash equivalents $ $29.1 $ $5.9 Availability under the 2016 Revolving Credit Facility 230.7 223.9 Availability under our used vehicle floor plan facilities 17.1 2.0 Availability under the 2019 Mortgage Facility 3.1 - Total available liquidity resources $ $280.0 $ $231.8 Covenant Requirement* 12/31/2019 12/31/2018 Liquidity Ratio >= 1.05 1.11 1.10 Fixed Charge Coverage Ratio >= 1.20 1.60 1.43 Total Lease Adjusted Leverage Ratio <= 5.75 3.21 5.25 Net Debt To Adjusted EBITDA Ratio(1) 2.20 3.62 All Covenant Ratios Improved Total 2019 Debt Reduction Of $238M * As Defined In The 2016 Revolving Credit Facility and 2019 Mortgage Facility (1) Refer To Appendix For Calculation And Reconciliation of Adjusted EBITDA (A Non-GAAP Measure) and Net Debt To Adjusted EBITDA Ratio (A Non-GAAP Measure) 21
Financial Results for Q1 2020 22
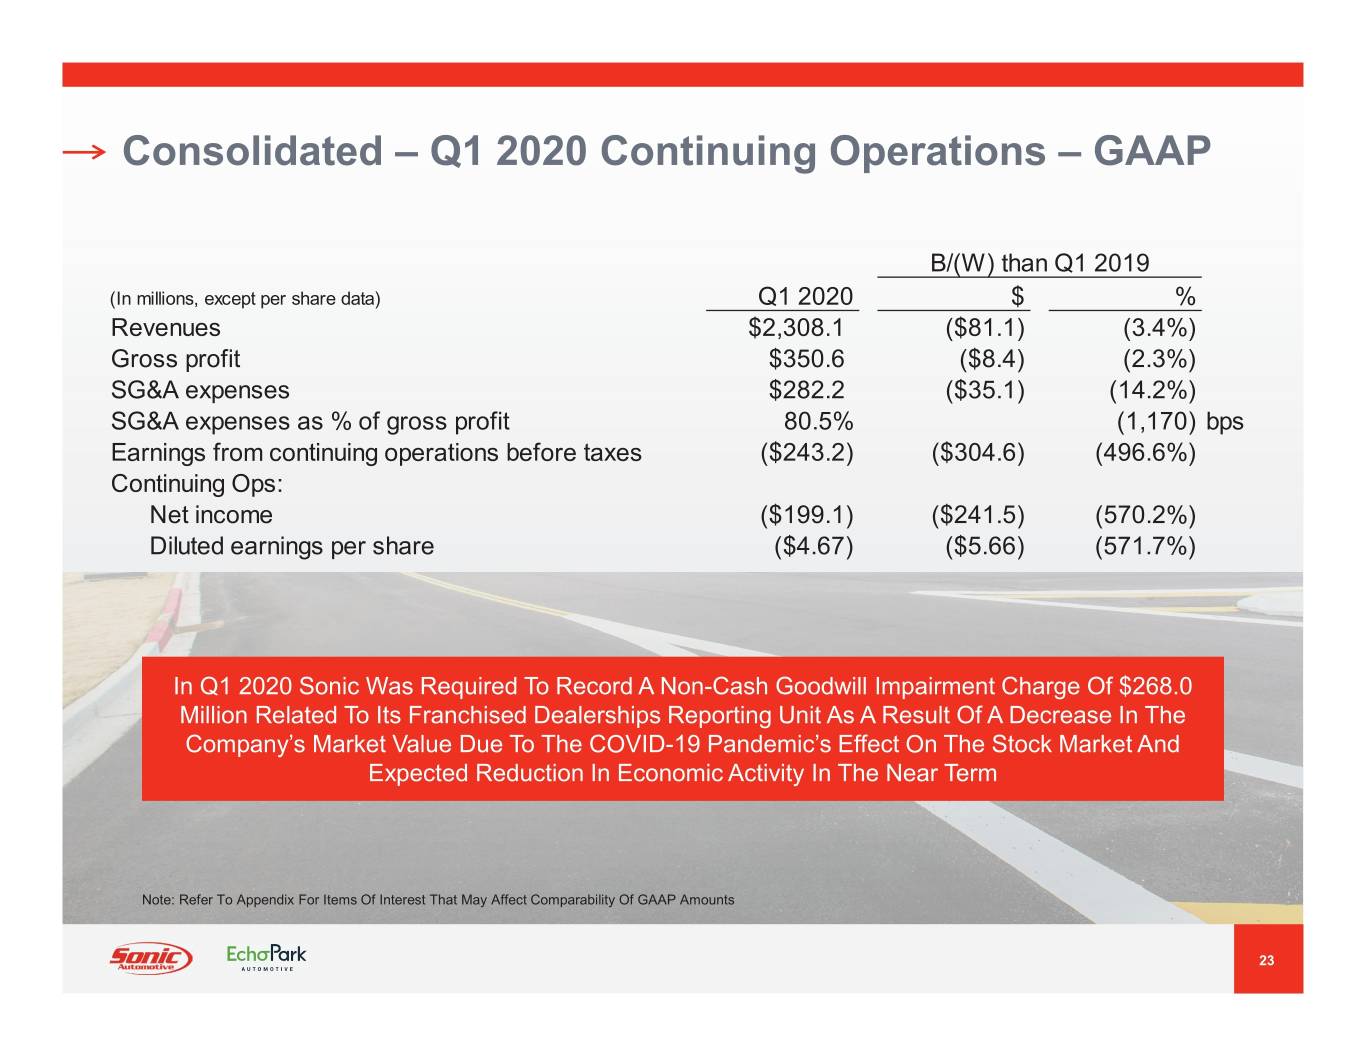
Consolidated – Q1 2020 Continuing Operations – GAAP B/(W) than Q1 2019 (In millions, except per share data) Q1 2020 $ % Revenues $2,308.1 ($81.1) (3.4%) Gross profit $350.6 ($8.4) (2.3%) SG&A expenses $282.2 ($35.1) (14.2%) SG&A expenses as % of gross profit 80.5% (1,170) bps Earnings from continuing operations before taxes ($243.2) ($304.6) (496.6%) Continuing Ops: Net income ($199.1) ($241.5) (570.2%) Diluted earnings per share ($4.67) ($5.66) (571.7%) In Q1 2020 Sonic Was Required To Record A Non-Cash Goodwill Impairment Charge Of $268.0 Million Related To Its Franchised Dealerships Reporting Unit As A Result Of A Decrease In The Company’s Market Value Due To The COVID-19 Pandemic’s Effect On The Stock Market And Expected Reduction In Economic Activity In The Near Term Note: Refer To Appendix For Items Of Interest That May Affect Comparability Of GAAP Amounts 23
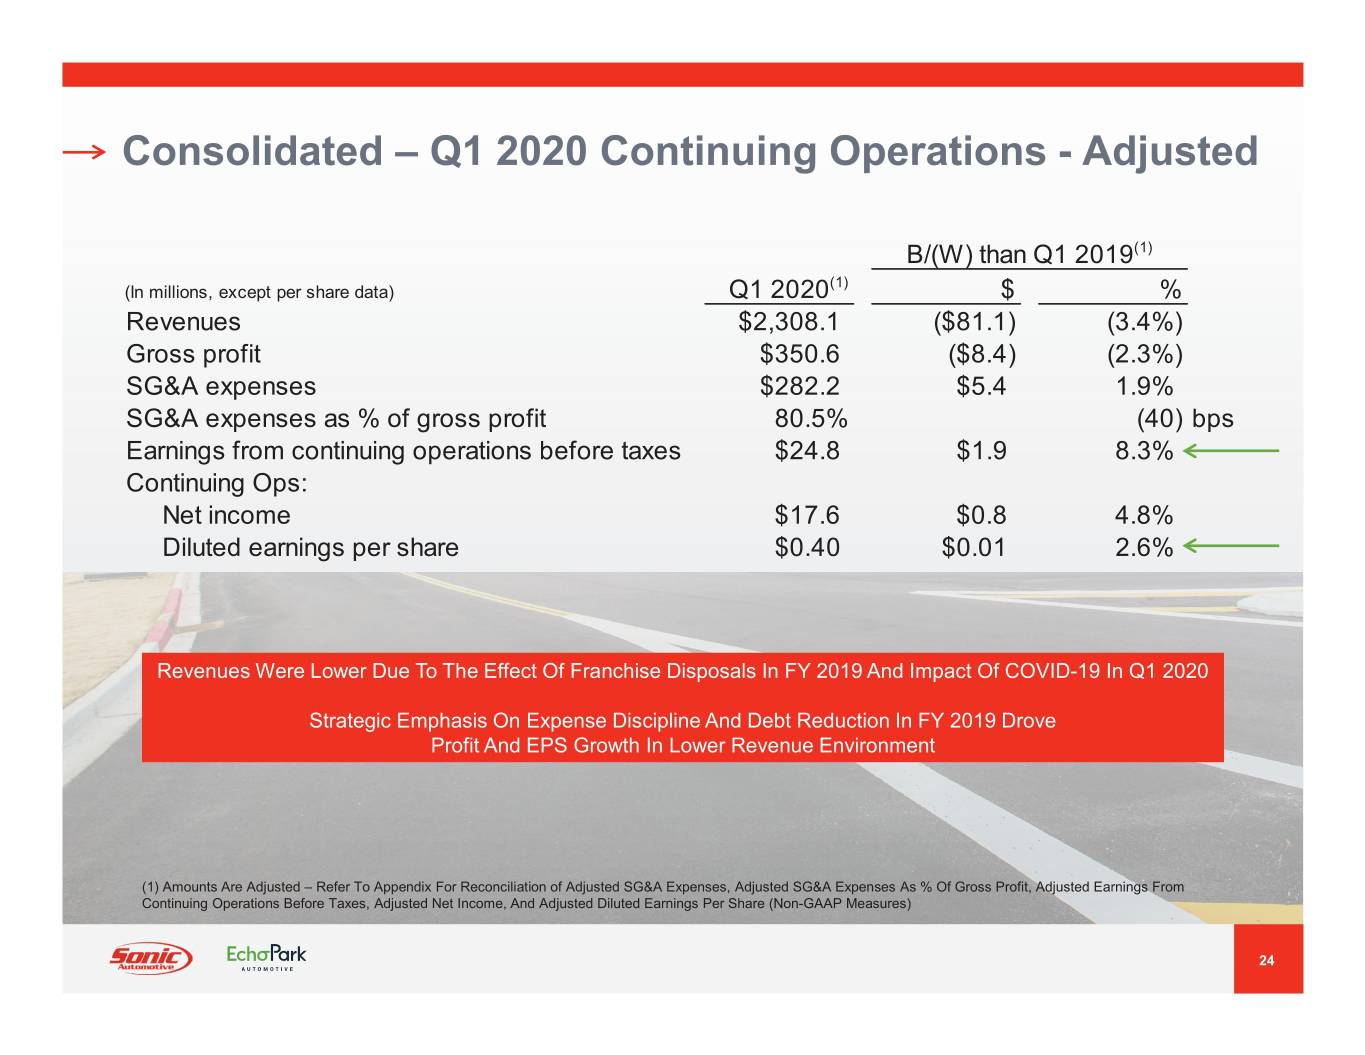
Consolidated – Q1 2020 Continuing Operations - Adjusted B/(W) than Q1 2019(1) (1) (In millions, except per share data) Q1 2020 $% Revenues $2,308.1 ($81.1) (3.4%) Gross profit $350.6 ($8.4) (2.3%) SG&A expenses $282.2 $5.4 1.9% SG&A expenses as % of gross profit 80.5% (40) bps Earnings from continuing operations before taxes $24.8 $1.9 8.3% Continuing Ops: Net income $17.6 $0.8 4.8% Diluted earnings per share $0.40 $0.01 2.6% Revenues Were Lower Due To The Effect Of Franchise Disposals In FY 2019 And Impact Of COVID-19 In Q1 2020 Strategic Emphasis On Expense Discipline And Debt Reduction In FY 2019 Drove Profit And EPS Growth In Lower Revenue Environment (1) Amounts Are Adjusted – Refer To Appendix For Reconciliation of Adjusted SG&A Expenses, Adjusted SG&A Expenses As % Of Gross Profit, Adjusted Earnings From Continuing Operations Before Taxes, Adjusted Net Income, And Adjusted Diluted Earnings Per Share (Non-GAAP Measures) 24
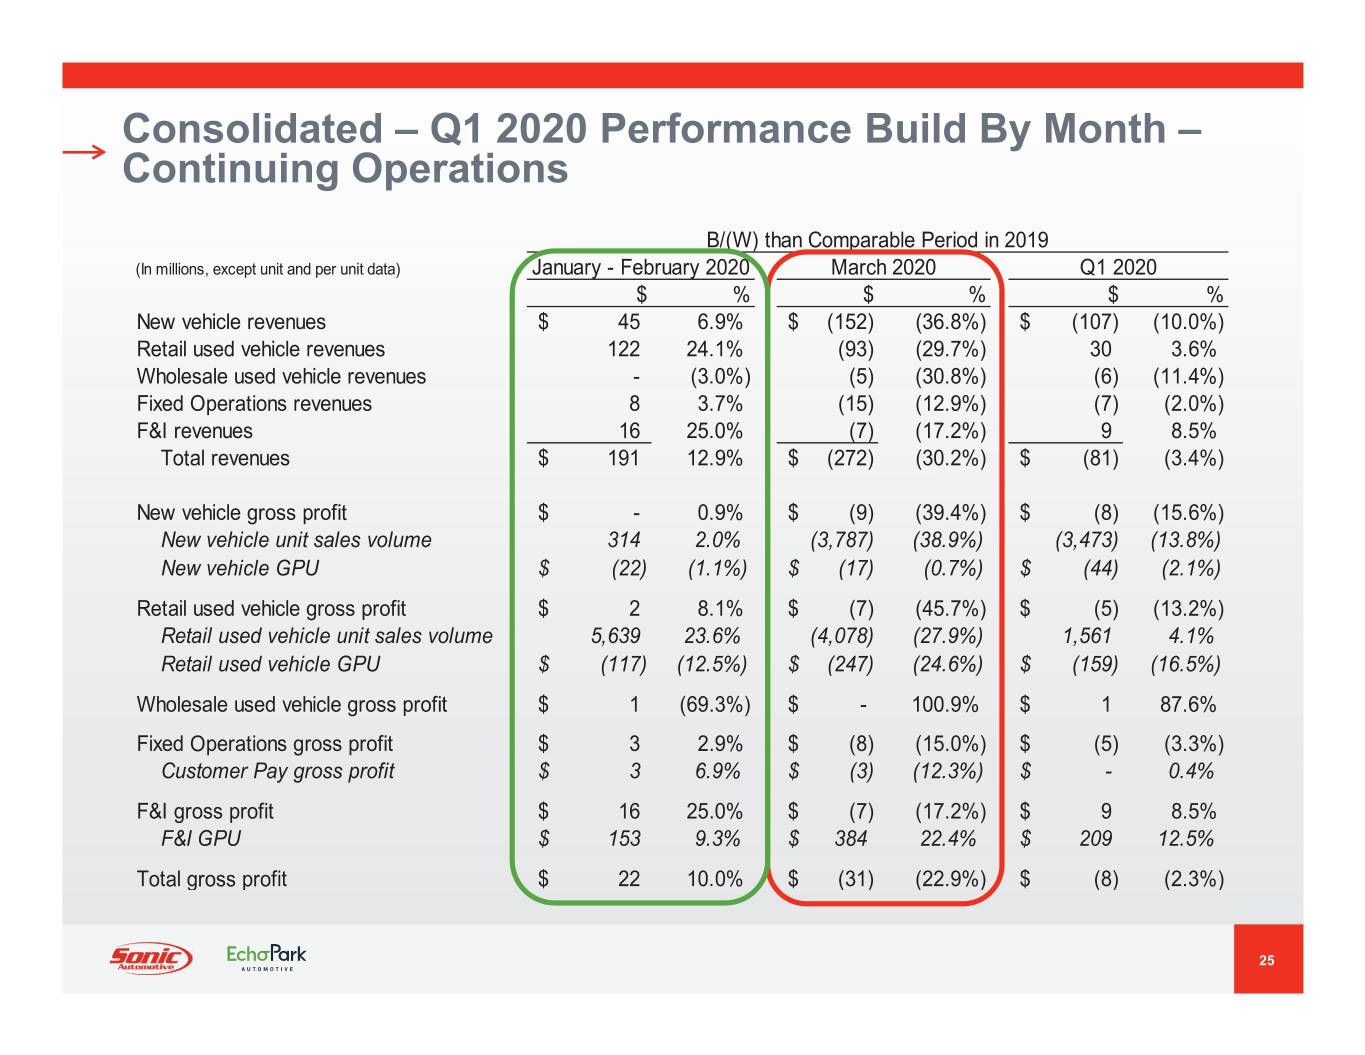
Consolidated – Q1 2020 Performance Build By Month – Continuing Operations B/(W) than Comparable Period in 2019 (In millions, except unit and per unit data) January - February 2020 March 2020 Q1 2020 $% $ % $% New vehicle revenues$ 45 6.9%$ (152) (36.8%)$ (107) (10.0%) Retail used vehicle revenues 122 24.1% (93) (29.7%) 30 3.6% Wholesale used vehicle revenues - (3.0%) (5) (30.8%) (6) (11.4%) Fixed Operations revenues 8 3.7% (15) (12.9%) (7) (2.0%) F&I revenues 16 25.0% (7) (17.2%) 9 8.5% Total revenues$ 191 12.9%$ (272) (30.2%)$ (81) (3.4%) New vehicle gross profit$ - 0.9%$ (9) (39.4%)$ (8) (15.6%) New vehicle unit sales volume 314 2.0% (3,787) (38.9%) (3,473) (13.8%) New vehicle GPU$ (22) (1.1%)$ (17) (0.7%)$ (44) (2.1%) Retail used vehicle gross profit$ 2 8.1%$ (7) (45.7%)$ (5) (13.2%) Retail used vehicle unit sales volume 5,639 23.6% (4,078) (27.9%) 1,561 4.1% Retail used vehicle GPU$ (117) (12.5%)$ (247) (24.6%)$ (159) (16.5%) Wholesale used vehicle gross profit$ 1 (69.3%)$ - 100.9%$ 1 87.6% Fixed Operations gross profit$ 3 2.9%$ (8) (15.0%)$ (5) (3.3%) Customer Pay gross profit$ 3 6.9%$ (3) (12.3%)$ - 0.4% F&I gross profit$ 16 25.0%$ (7) (17.2%)$ 9 8.5% F&I GPU$ 153 9.3%$ 384 22.4%$ 209 12.5% Total gross profit$ 22 10.0%$ ( 31) (22.9%)($ 8) (2.3%) 25
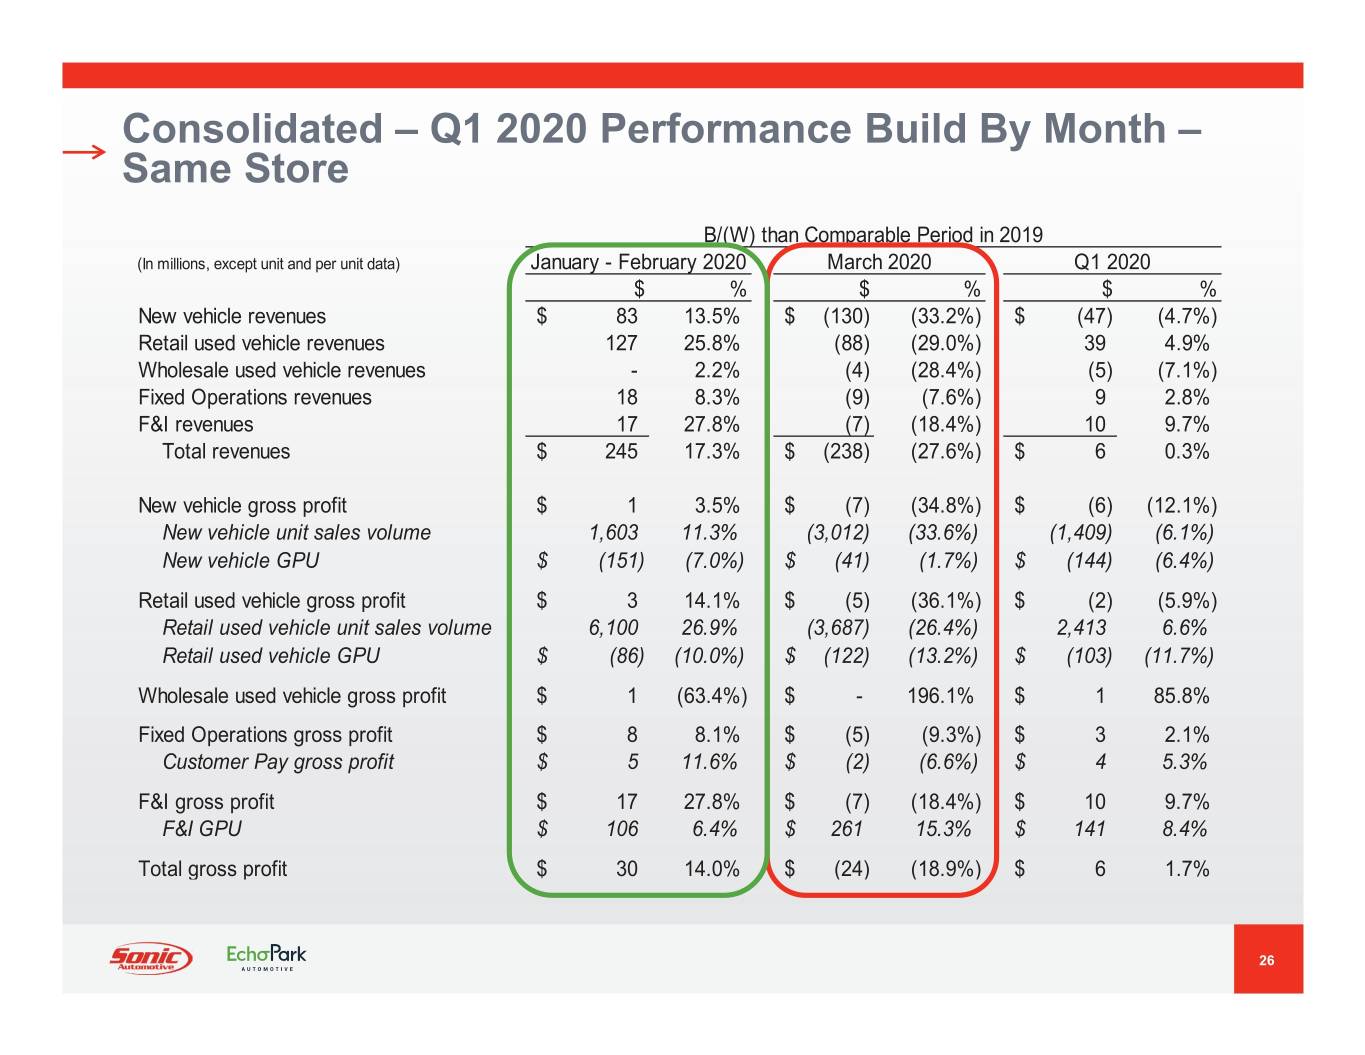
Consolidated – Q1 2020 Performance Build By Month – Same Store B/(W) than Comparable Period in 2019 (In millions, except unit and per unit data) y - February 2020 March 2020 Q1 2020 $% $ % $% New vehicle revenuesJanuar$ 83 13.5%$ (130) (33.2%)$ (47) (4.7%) Retail used vehicle revenues 127 25.8% (88) (29.0%) 39 4.9% Wholesale used vehicle revenues - 2.2% (4) (28.4%) (5) (7.1%) Fixed Operations revenues 18 8.3% (9) (7.6%) 9 2.8% F&I revenues 17 27.8% (7) (18.4%) 10 9.7% Total revenues$ 245 17.3%$ (238) (27.6%)$ 6 0.3% New vehicle gross profit$ 1 3.5%$ (7) (34.8%)$ (6) (12.1%) New vehicle unit sales volume 1,603 11.3% (3,012) (33.6%) (1,409) (6.1%) New vehicle GPU$ (151) (7.0%)$ (41) (1.7%)$ (144) (6.4%) Retail used vehicle gross profit$ 3 14.1%$ (5) (36.1%)$ (2) (5.9%) Retail used vehicle unit sales volume 6,100 26.9% (3,687) (26.4%) 2,413 6.6% Retail used vehicle GPU$ (86) (10.0%)$ (122) (13.2%)$ (103) (11.7%) Wholesale used vehicle gross profit$ 1 (63.4%)$ - 196.1%$ 1 85.8% Fixed Operations gross profit$ 8 8.1%$ (5) (9.3%)$ 3 2.1% Customer Pay gross profit$ 5 11.6%$ (2) (6.6%)$ 4 5.3% F&I gross profit$ 17 27.8%$ (7) (18.4%)$ 10 9.7% F&I GPU$ 106 6.4%$ 261 15.3%$ 141 8.4% Total gross profit$ 30 14.0%$ ( 24) (18.9%) $ 6 1.7% 26

COVID-19 Impact Actions Taken 2020 Outlook 27
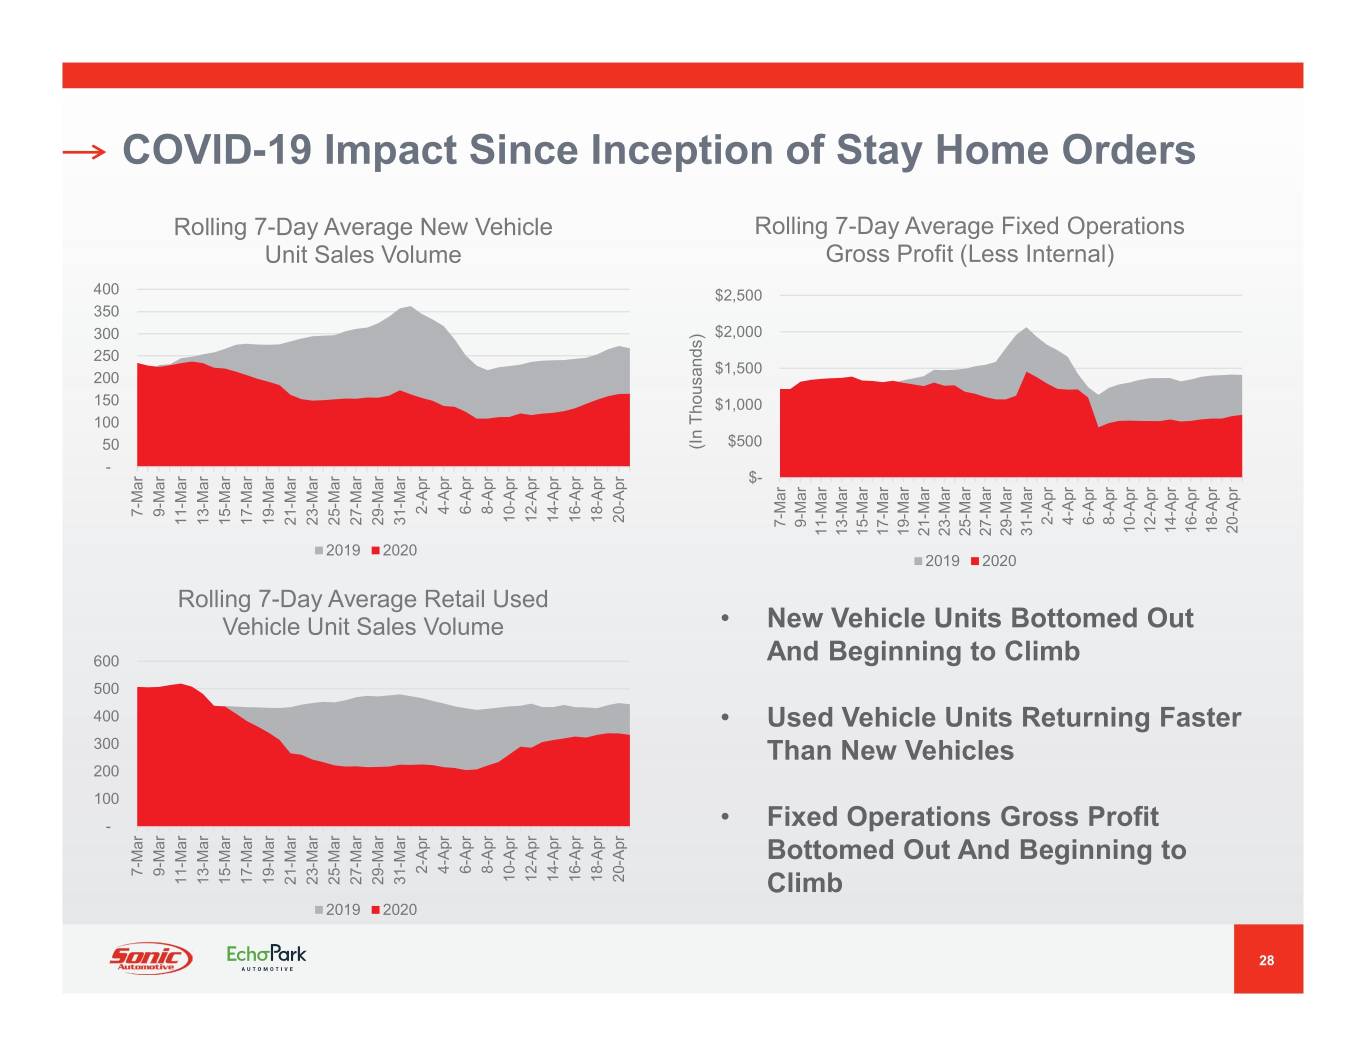
COVID-19 Impact Since Inception of Stay Home Orders Rolling 7-Day Average New Vehicle Rolling 7-Day Average Fixed Operations Unit Sales Volume Gross Profit (Less Internal) 400 $2,500 350 300 $2,000 250 $1,500 200 150 $1,000 100 $500 50 (In Thousands) - $- 2-Apr 4-Apr 6-Apr 8-Apr 7-Mar 9-Mar 10-Apr 12-Apr 14-Apr 16-Apr 18-Apr 20-Apr 2-Apr 4-Apr 6-Apr 8-Apr 11-Mar 13-Mar 15-Mar 17-Mar 19-Mar 21-Mar 23-Mar 25-Mar 27-Mar 29-Mar 31-Mar 7-Mar 9-Mar 10-Apr 12-Apr 14-Apr 16-Apr 18-Apr 20-Apr 11-Mar 13-Mar 15-Mar 17-Mar 19-Mar 21-Mar 23-Mar 25-Mar 27-Mar 29-Mar 31-Mar 2019 2020 2019 2020 Rolling 7-Day Average Retail Used Vehicle Unit Sales Volume ‡ New Vehicle Units Bottomed Out 600 And Beginning to Climb 500 400 ‡ Used Vehicle Units Returning Faster 300 Than New Vehicles 200 100 - ‡ Fixed Operations Gross Profit Bottomed Out And Beginning to 2-Apr 4-Apr 6-Apr 8-Apr 7-Mar 9-Mar 10-Apr 12-Apr 14-Apr 16-Apr 18-Apr 20-Apr 11-Mar 13-Mar 15-Mar 17-Mar 19-Mar 21-Mar 23-Mar 25-Mar 27-Mar 29-Mar 31-Mar Climb 2019 2020 28
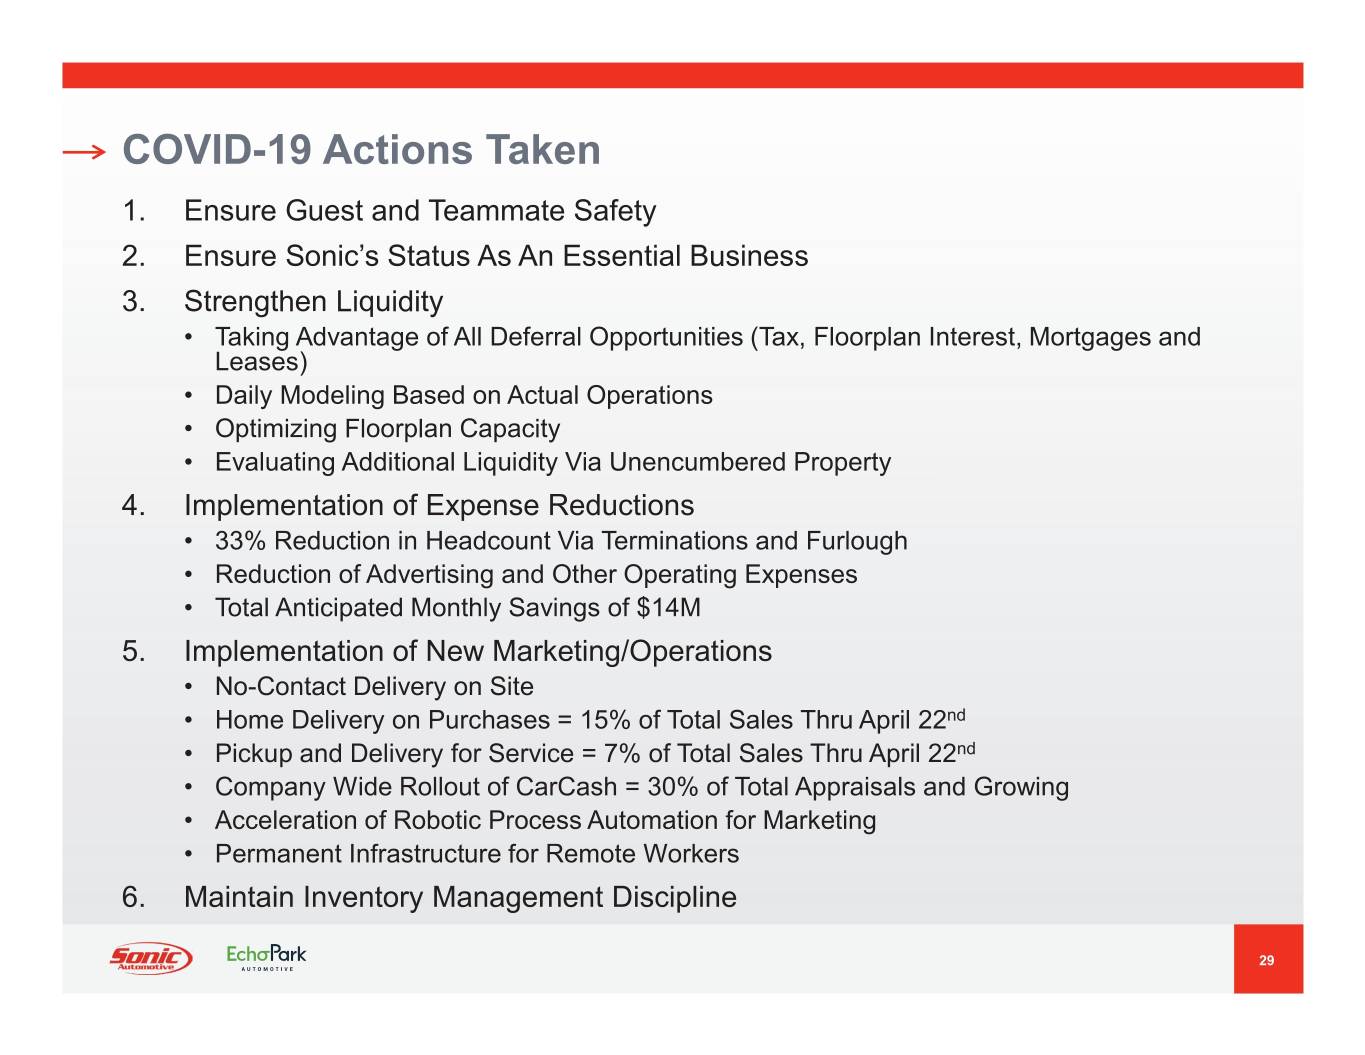
COVID-19 Actions Taken 1. Ensure Guest and Teammate Safety 2. Ensure Sonic’s Status As An Essential Business 3. Strengthen Liquidity ‡ Taking Advantage of All Deferral Opportunities (Tax, Floorplan Interest, Mortgages and Leases) ‡ Daily Modeling Based on Actual Operations ‡ Optimizing Floorplan Capacity ‡ Evaluating Additional Liquidity Via Unencumbered Property 4. Implementation of Expense Reductions ‡ 33% Reduction in Headcount Via Terminations and Furlough ‡ Reduction of Advertising and Other Operating Expenses ‡ Total Anticipated Monthly Savings of $14M 5. Implementation of New Marketing/Operations ‡ No-Contact Delivery on Site ‡ Home Delivery on Purchases = 15% of Total Sales Thru April 22nd ‡ Pickup and Delivery for Service = 7% of Total Sales Thru April 22nd ‡ Company Wide Rollout of CarCash = 30% of Total Appraisals and Growing ‡ Acceleration of Robotic Process Automation for Marketing ‡ Permanent Infrastructure for Remote Workers 6. Maintain Inventory Management Discipline 29
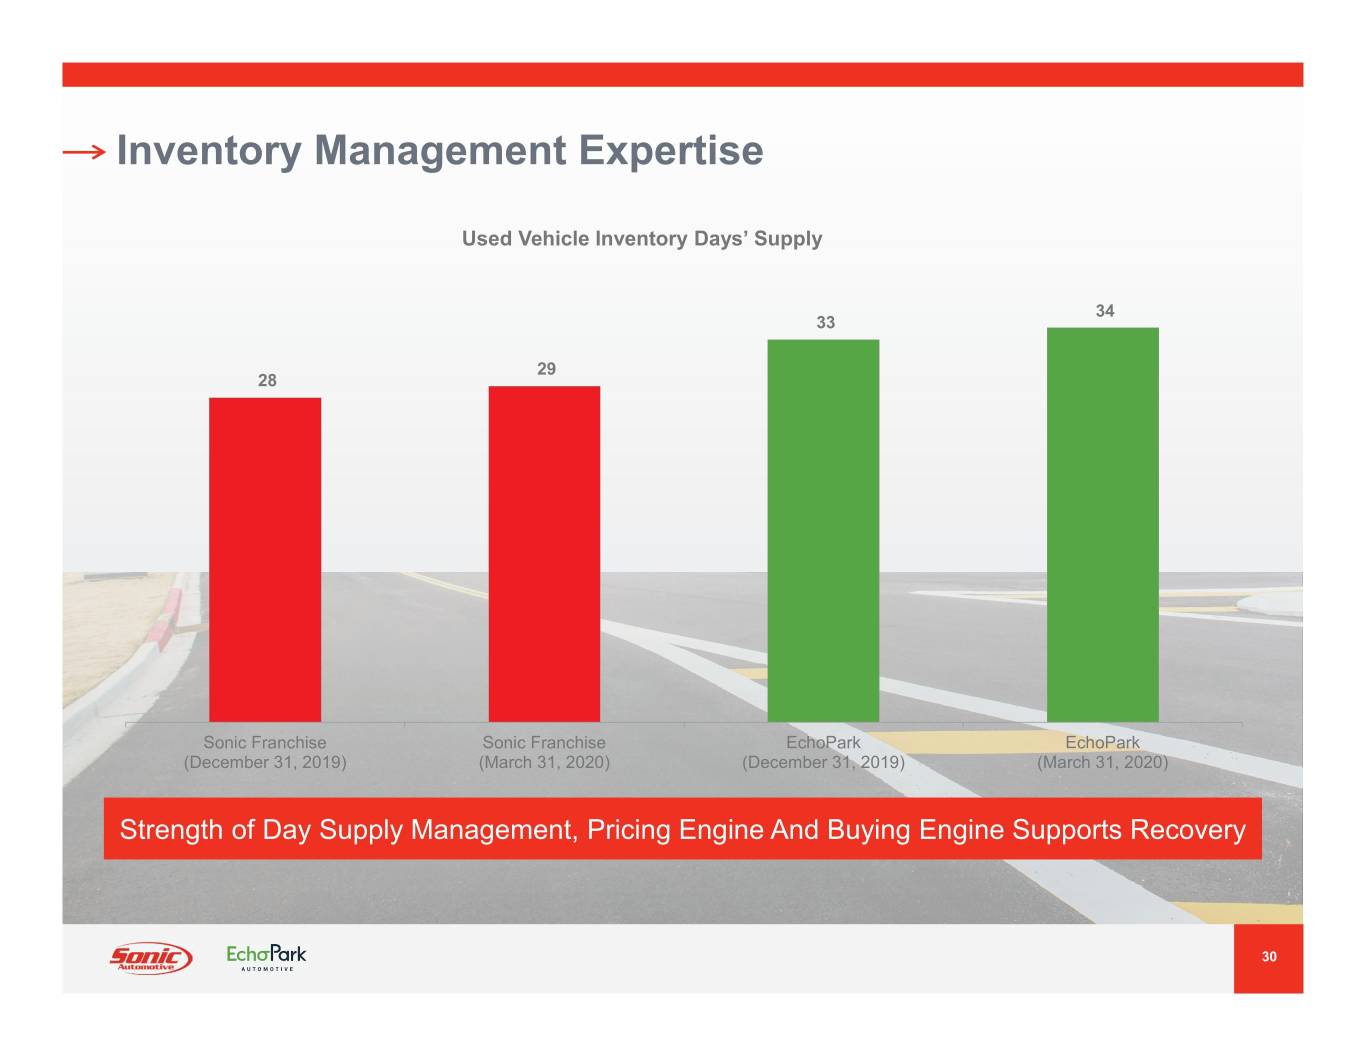
Inventory Management Expertise Used Vehicle Inventory Days’ Supply 34 33 29 28 Sonic Franchise Sonic Franchise EchoPark EchoPark (December 31, 2019) (March 31, 2020) (December 31, 2019) (March 31, 2020) Strength of Day Supply Management, Pricing Engine And Buying Engine Supports Recovery 30
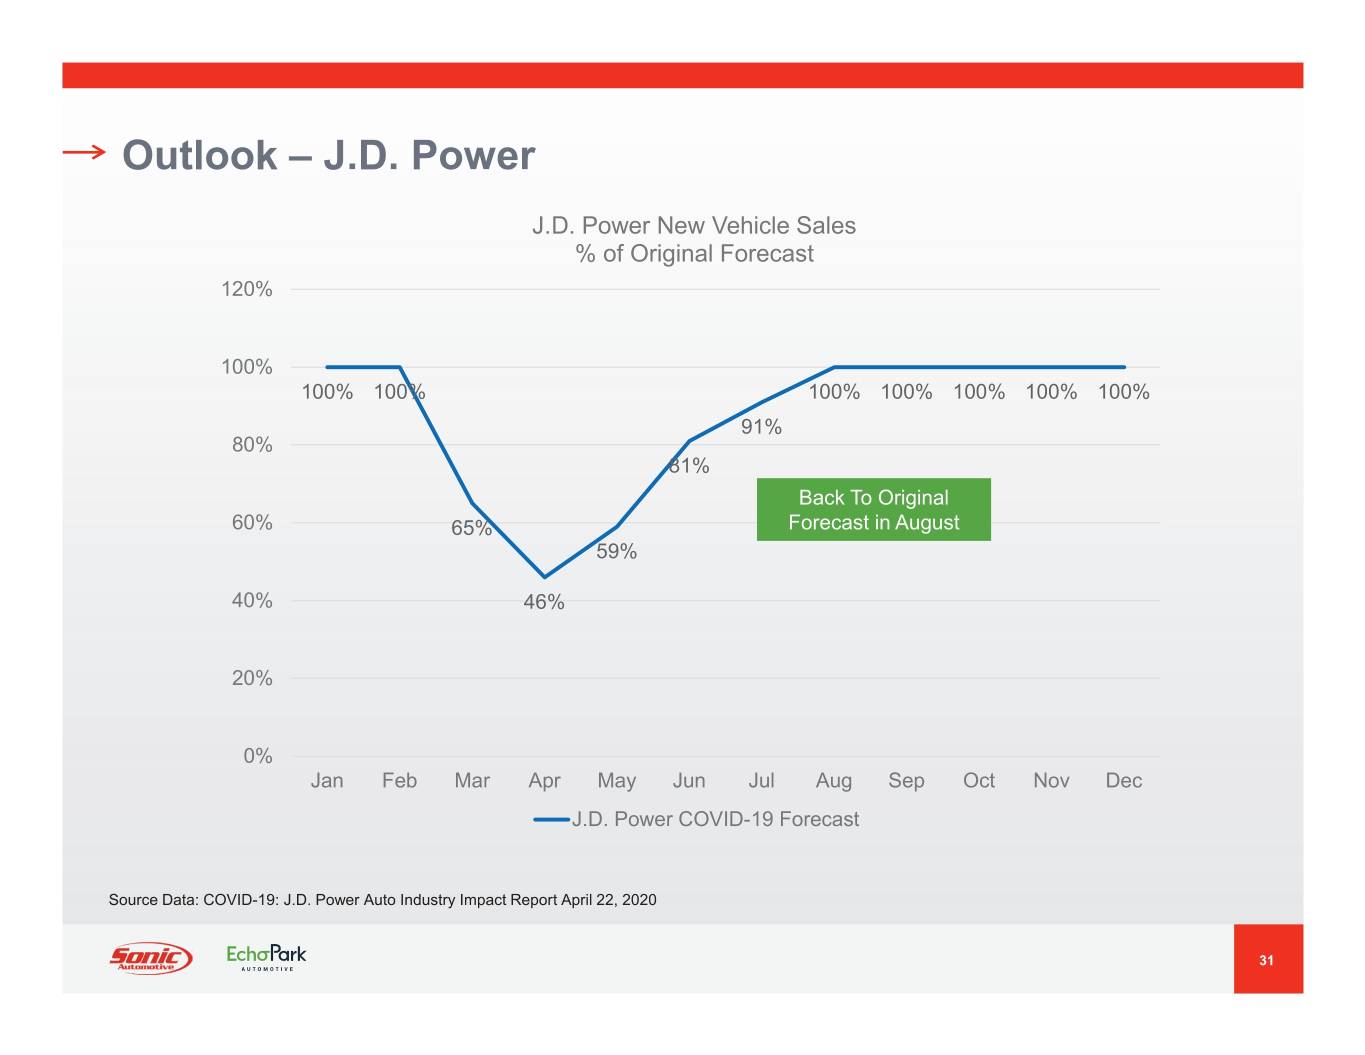
Outlook – J.D. Power J.D. Power New Vehicle Sales % of Original Forecast 120% 100% 100% 100% 100% 100% 100% 100% 100% 91% 80% 81% Back To Original 60% 65% Forecast in August 59% 40% 46% 20% 0% Jan Feb Mar Apr May Jun Jul Aug Sep Oct Nov Dec J.D. Power COVID-19 Forecast Source Data: COVID-19: J.D. Power Auto Industry Impact Report April 22, 2020 31
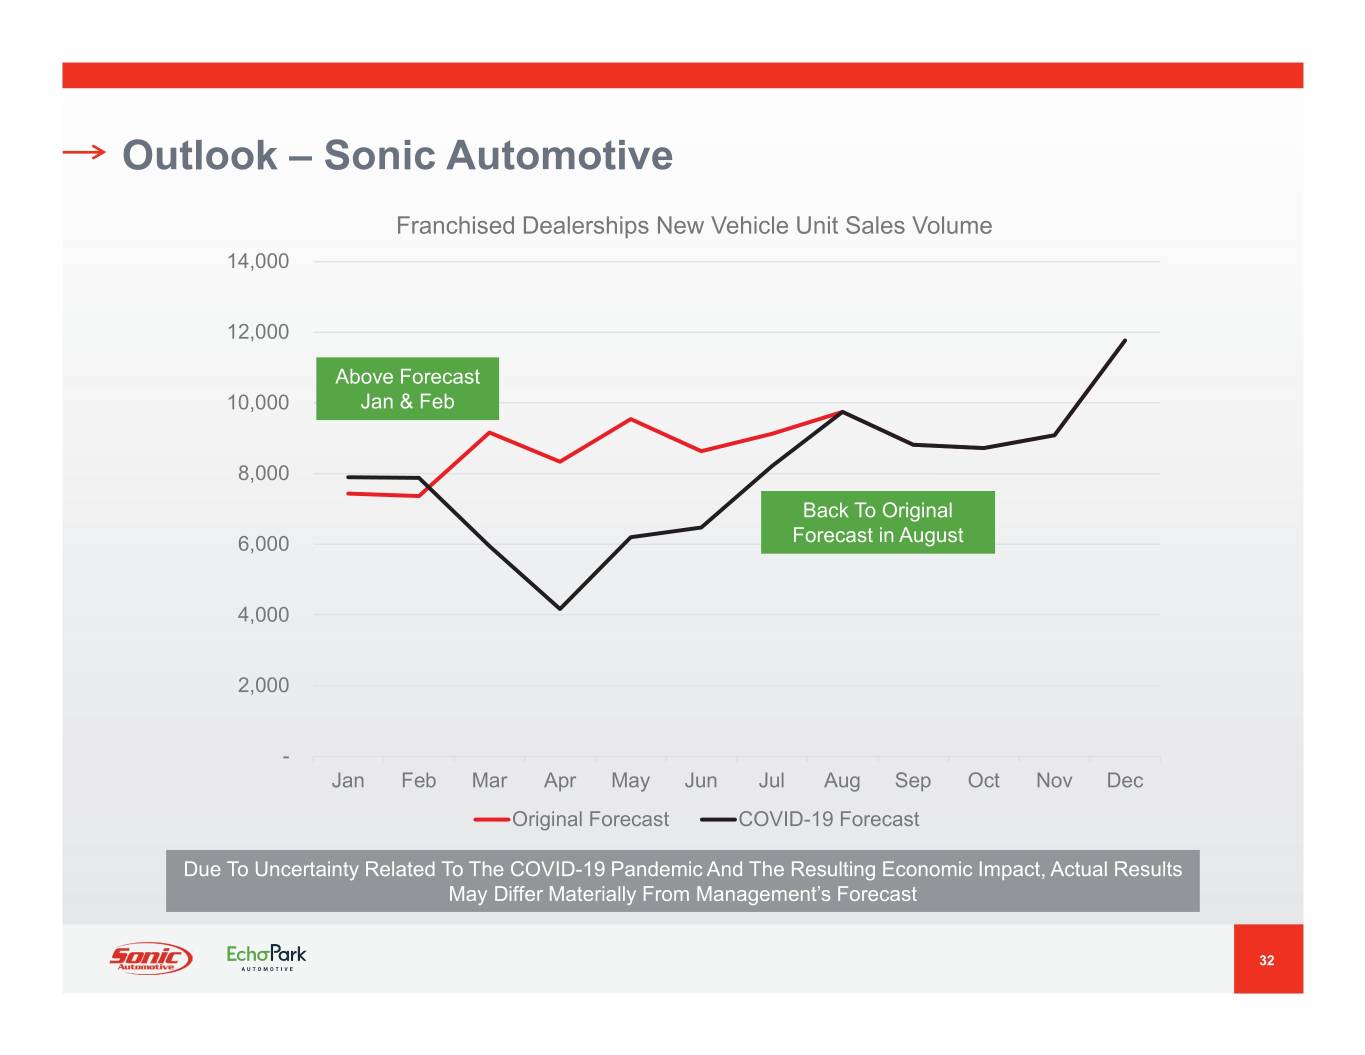
Outlook – Sonic Automotive Franchised Dealerships New Vehicle Unit Sales Volume 14,000 12,000 Above Forecast 10,000 Jan & Feb 8,000 Back To Original 6,000 Forecast in August 4,000 2,000 - Jan Feb Mar Apr May Jun Jul Aug Sep Oct Nov Dec Original Forecast COVID-19 Forecast Due To Uncertainty Related To The COVID-19 Pandemic And The Resulting Economic Impact, Actual Results May Differ Materially From Management’s Forecast 32
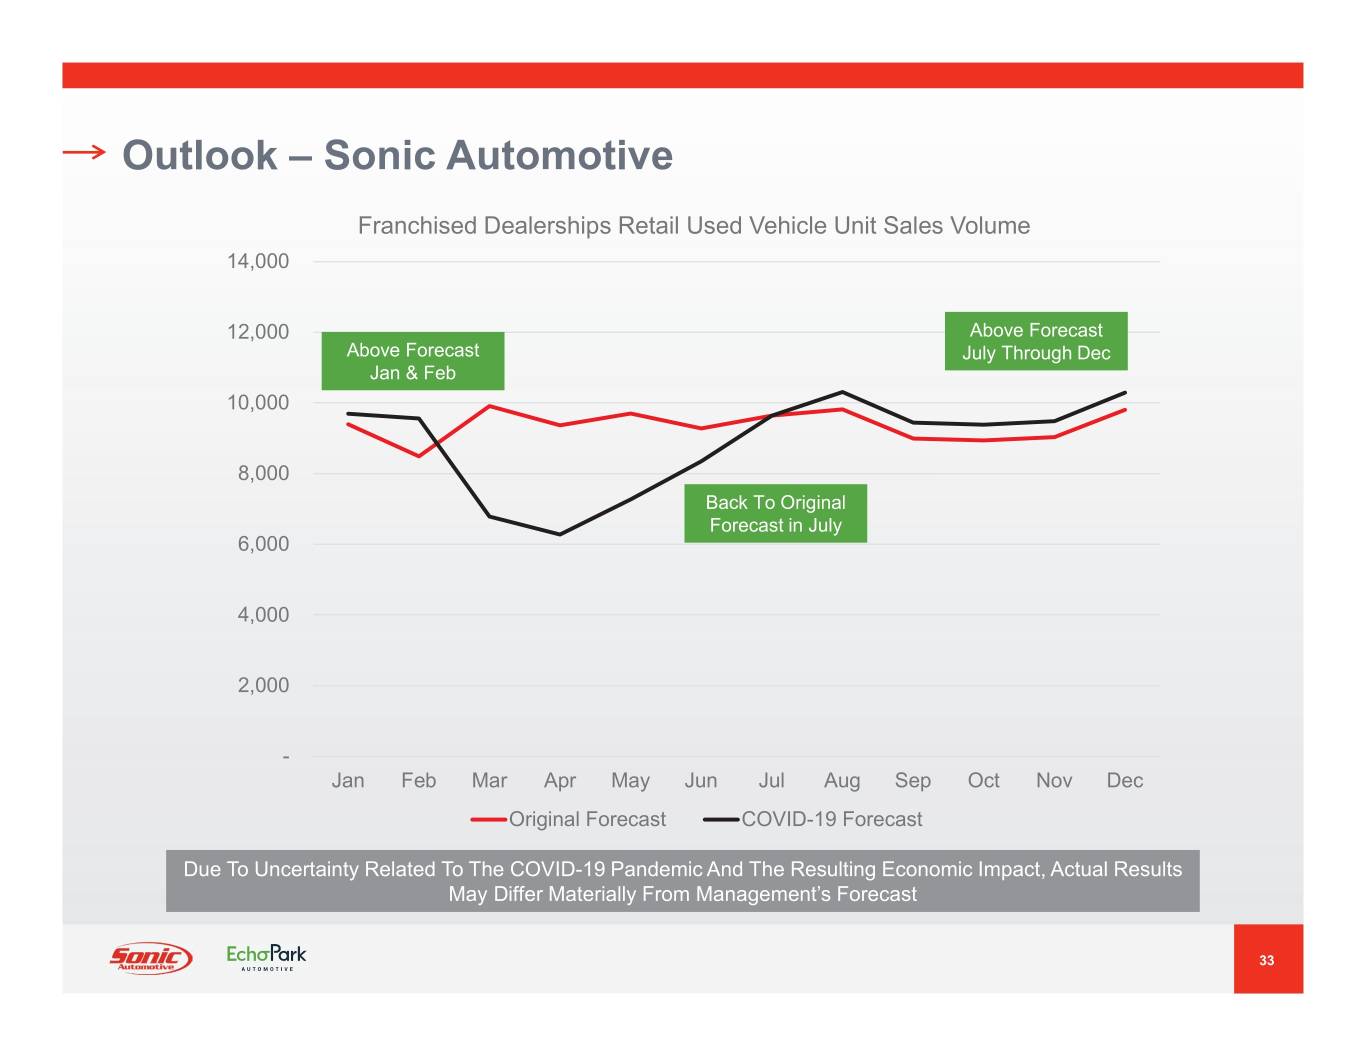
Outlook – Sonic Automotive Franchised Dealerships Retail Used Vehicle Unit Sales Volume 14,000 12,000 Above Forecast Above Forecast July Through Dec Jan & Feb 10,000 8,000 Back To Original Forecast in July 6,000 4,000 2,000 - Jan Feb Mar Apr May Jun Jul Aug Sep Oct Nov Dec Original Forecast COVID-19 Forecast Due To Uncertainty Related To The COVID-19 Pandemic And The Resulting Economic Impact, Actual Results May Differ Materially From Management’s Forecast 33
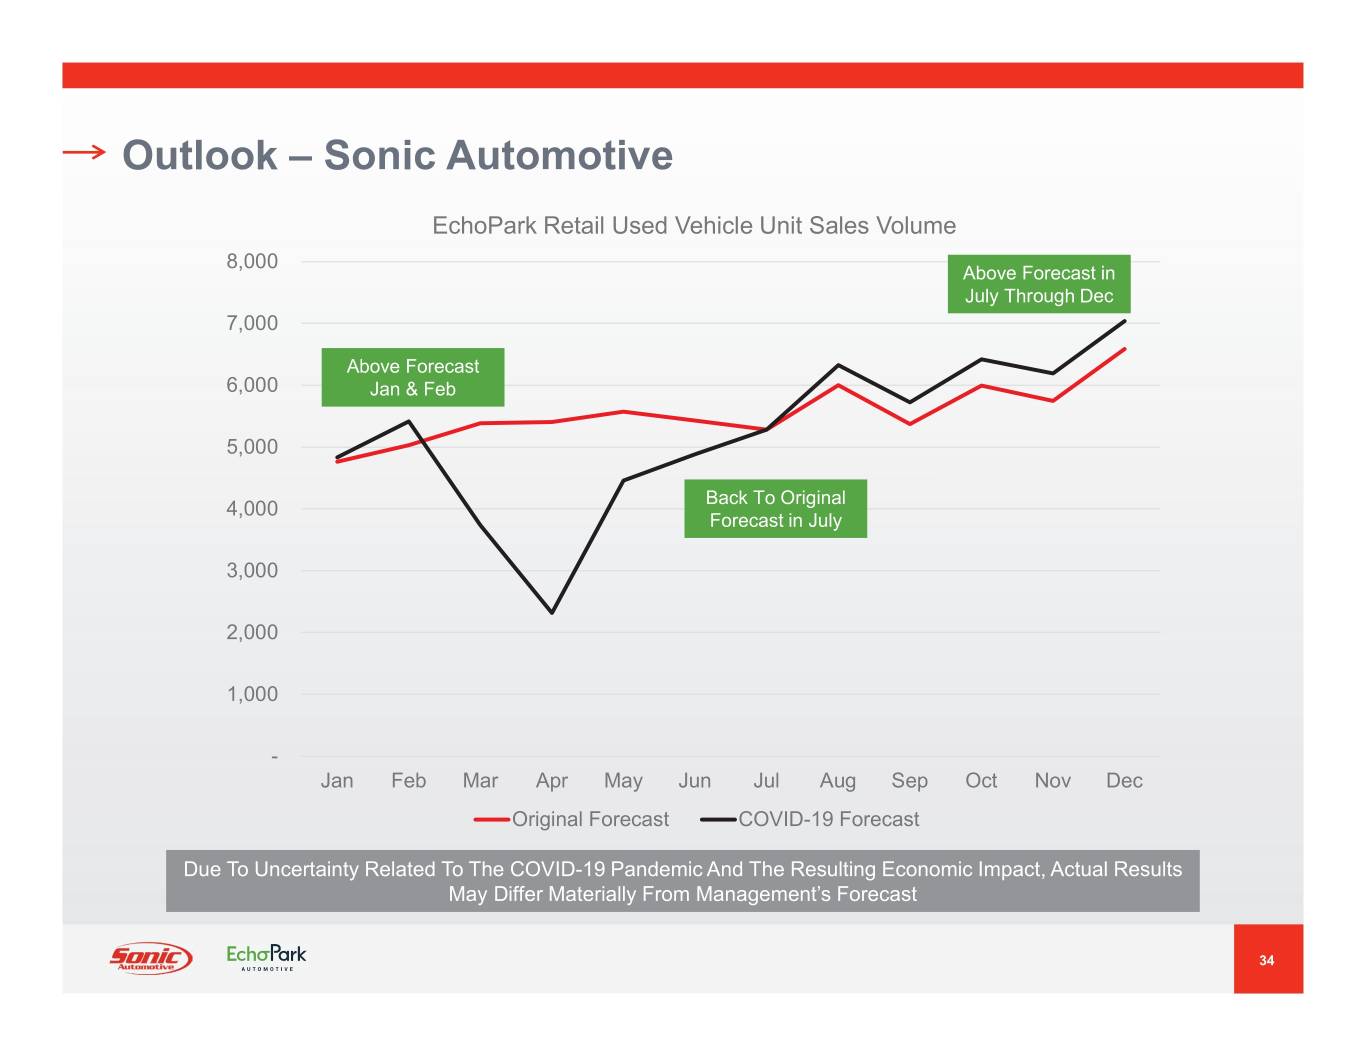
Outlook – Sonic Automotive EchoPark Retail Used Vehicle Unit Sales Volume 8,000 Above Forecast in July Through Dec 7,000 Above Forecast 6,000 Jan & Feb 5,000 Back To Original 4,000 Forecast in July 3,000 2,000 1,000 - Jan Feb Mar Apr May Jun Jul Aug Sep Oct Nov Dec Original Forecast COVID-19 Forecast Due To Uncertainty Related To The COVID-19 Pandemic And The Resulting Economic Impact, Actual Results May Differ Materially From Management’s Forecast 34
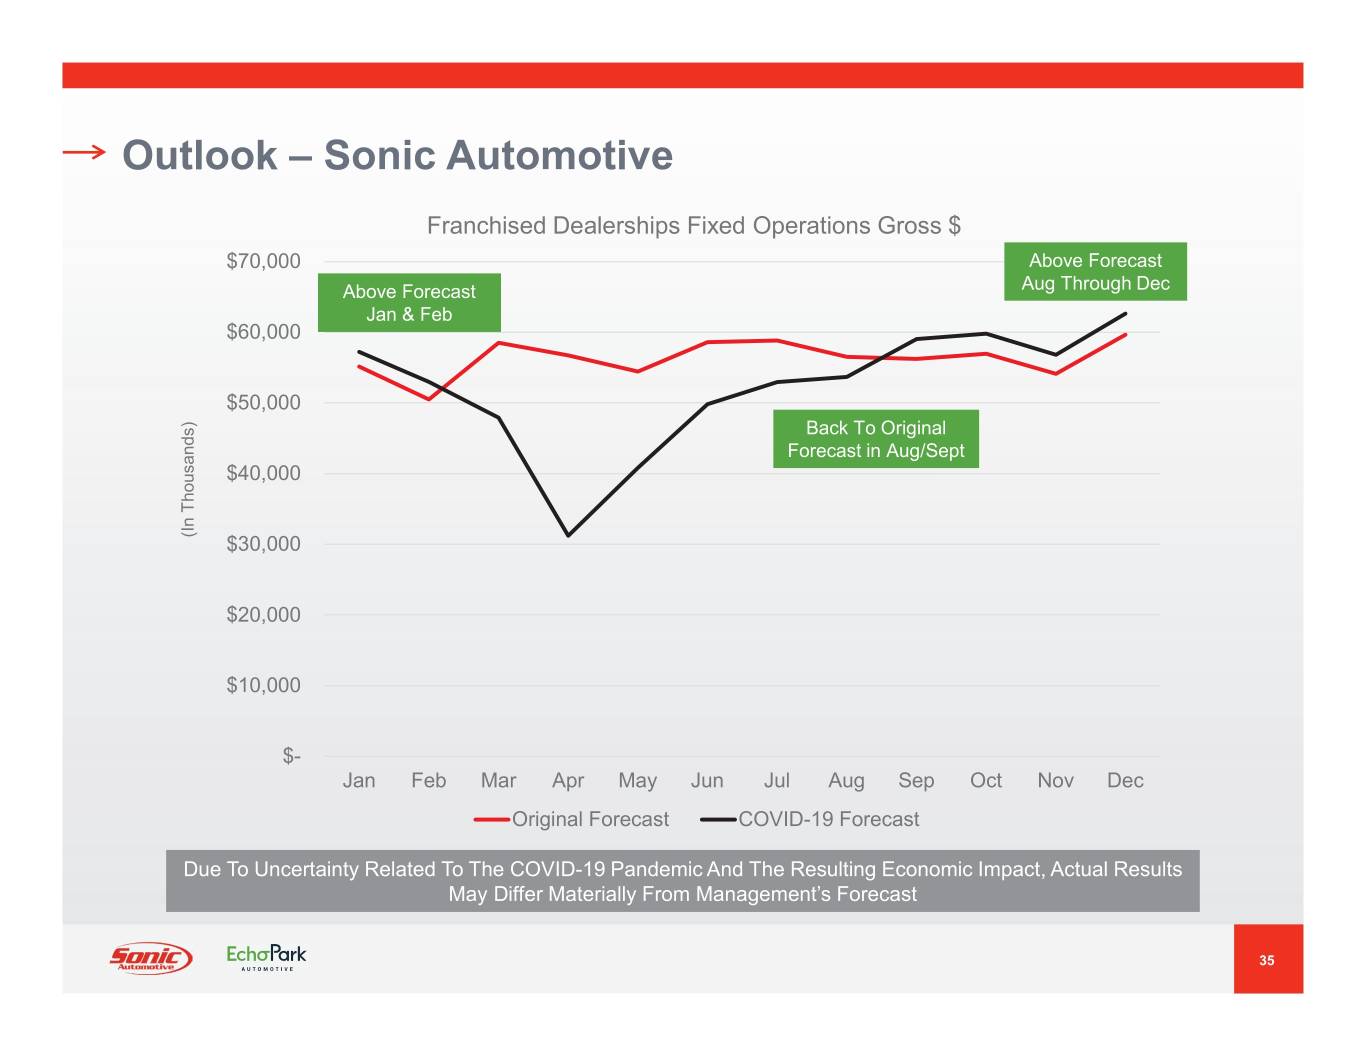
Outlook – Sonic Automotive Franchised Dealerships Fixed Operations Gross $ $70,000 Above Forecast Above Forecast Aug Through Dec Jan & Feb $60,000 $50,000 Back To Original Forecast in Aug/Sept $40,000 (In Thousands) $30,000 $20,000 $10,000 $- Jan Feb Mar Apr May Jun Jul Aug Sep Oct Nov Dec Original Forecast COVID-19 Forecast Due To Uncertainty Related To The COVID-19 Pandemic And The Resulting Economic Impact, Actual Results May Differ Materially From Management’s Forecast 35

Report of the Inspector of Elections 36
Adjournment 37

Q&A 38

Appendices 39

Appendix – Company Overview April 29, 2020
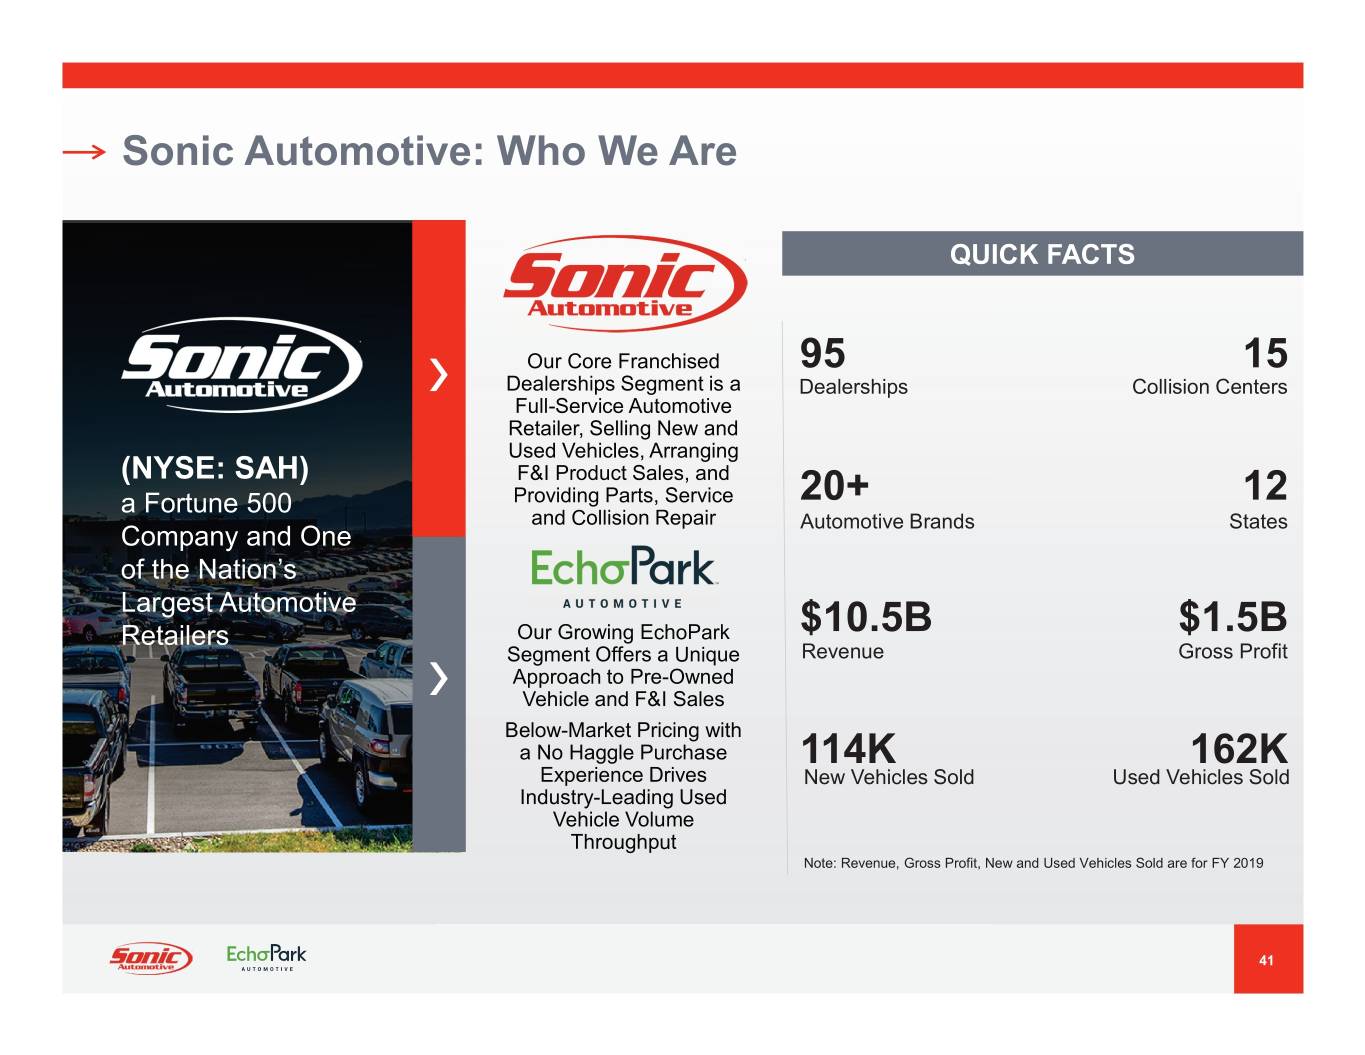
Sonic Automotive: Who We Are QUICK FACTS Our Core Franchised 95 15 Dealerships Segment is a Dealerships Collision Centers Full-Service Automotive Retailer, Selling New and Used Vehicles, Arranging (NYSE: SAH) F&I Product Sales, and a Fortune 500 Providing Parts, Service 20+ 12 and Collision Repair Automotive Brands States Company and One of the Nation’s Largest Automotive Retailers Our Growing EchoPark $10.5B $1.5B Segment Offers a Unique Revenue Gross Profit Approach to Pre-Owned Vehicle and F&I Sales Below-Market Pricing with a No Haggle Purchase 114K 162K Experience Drives New Vehicles Sold Used Vehicles Sold Industry-Leading Used Vehicle Volume Throughput Note: Revenue, Gross Profit, New and Used Vehicles Sold are for FY 2019 41
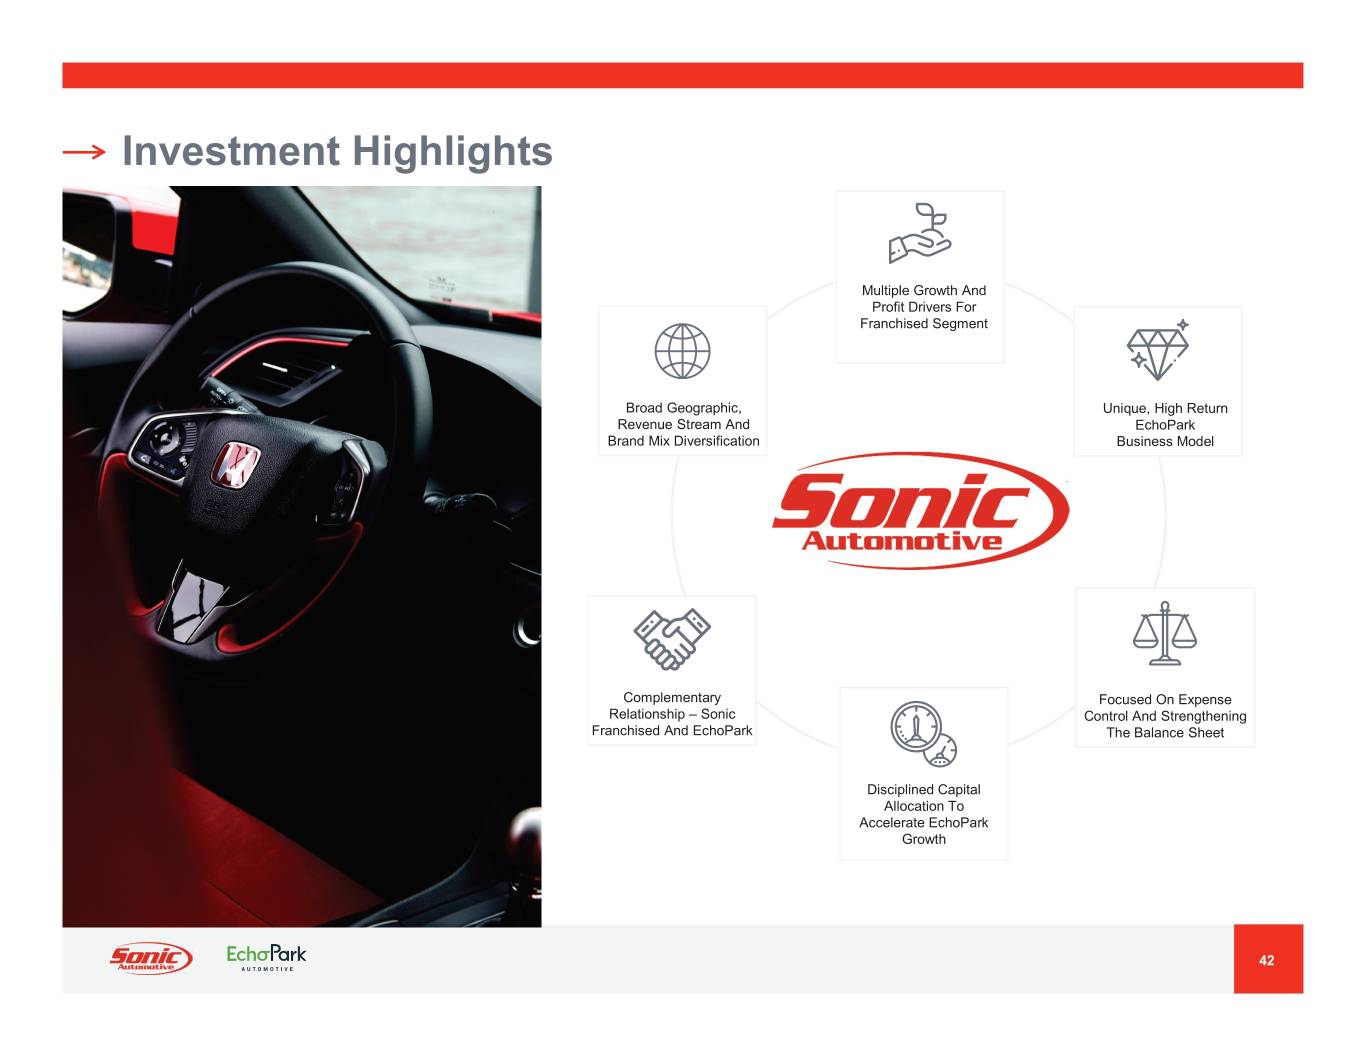
Investment Highlights Multiple Growth And Profit Drivers For Franchised Segment Broad Geographic, Unique, High Return Revenue Stream And EchoPark Brand Mix Diversification Business Model Complementary Focused On Expense Relationship – Sonic Control And Strengthening Franchised And EchoPark The Balance Sheet Disciplined Capital Allocation To Accelerate EchoPark Growth 42
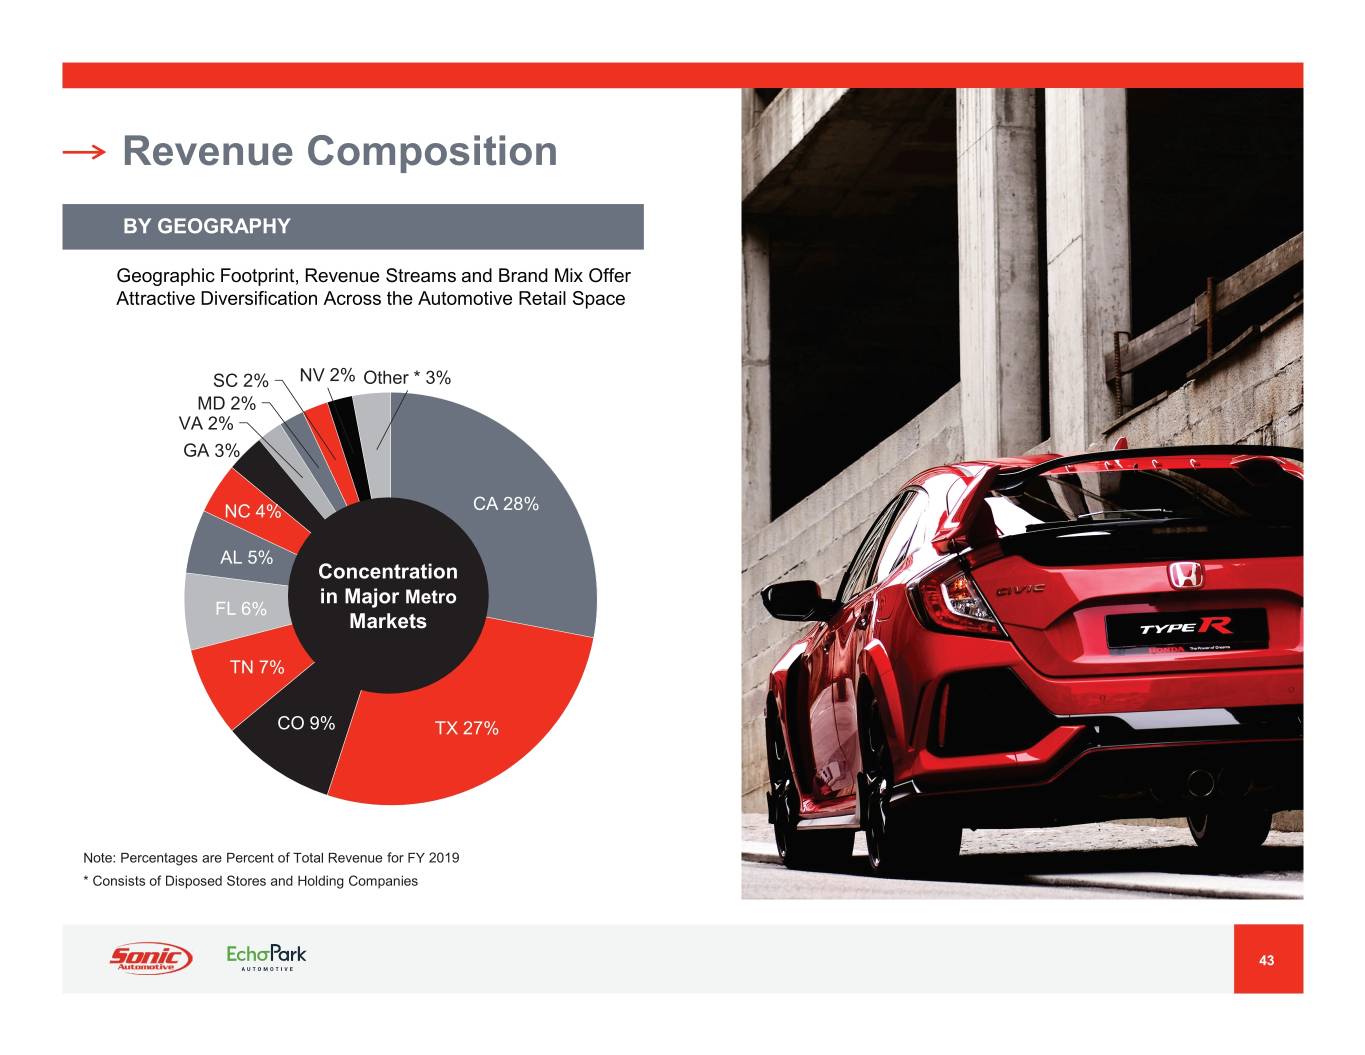
Revenue Composition BY GEOGRAPHY Geographic Footprint, Revenue Streams and Brand Mix Offer Attractive Diversification Across the Automotive Retail Space SC 2% NV 2% Other * 3% MD 2% VA 2% GA 3% NC 4% CA 28% AL 5% Concentration in Major Metro FL 6% Markets TN 7% CO 9% TX 27% Note: Percentages are Percent of Total Revenue for FY 2019 * Consists of Disposed Stores and Holding Companies 43
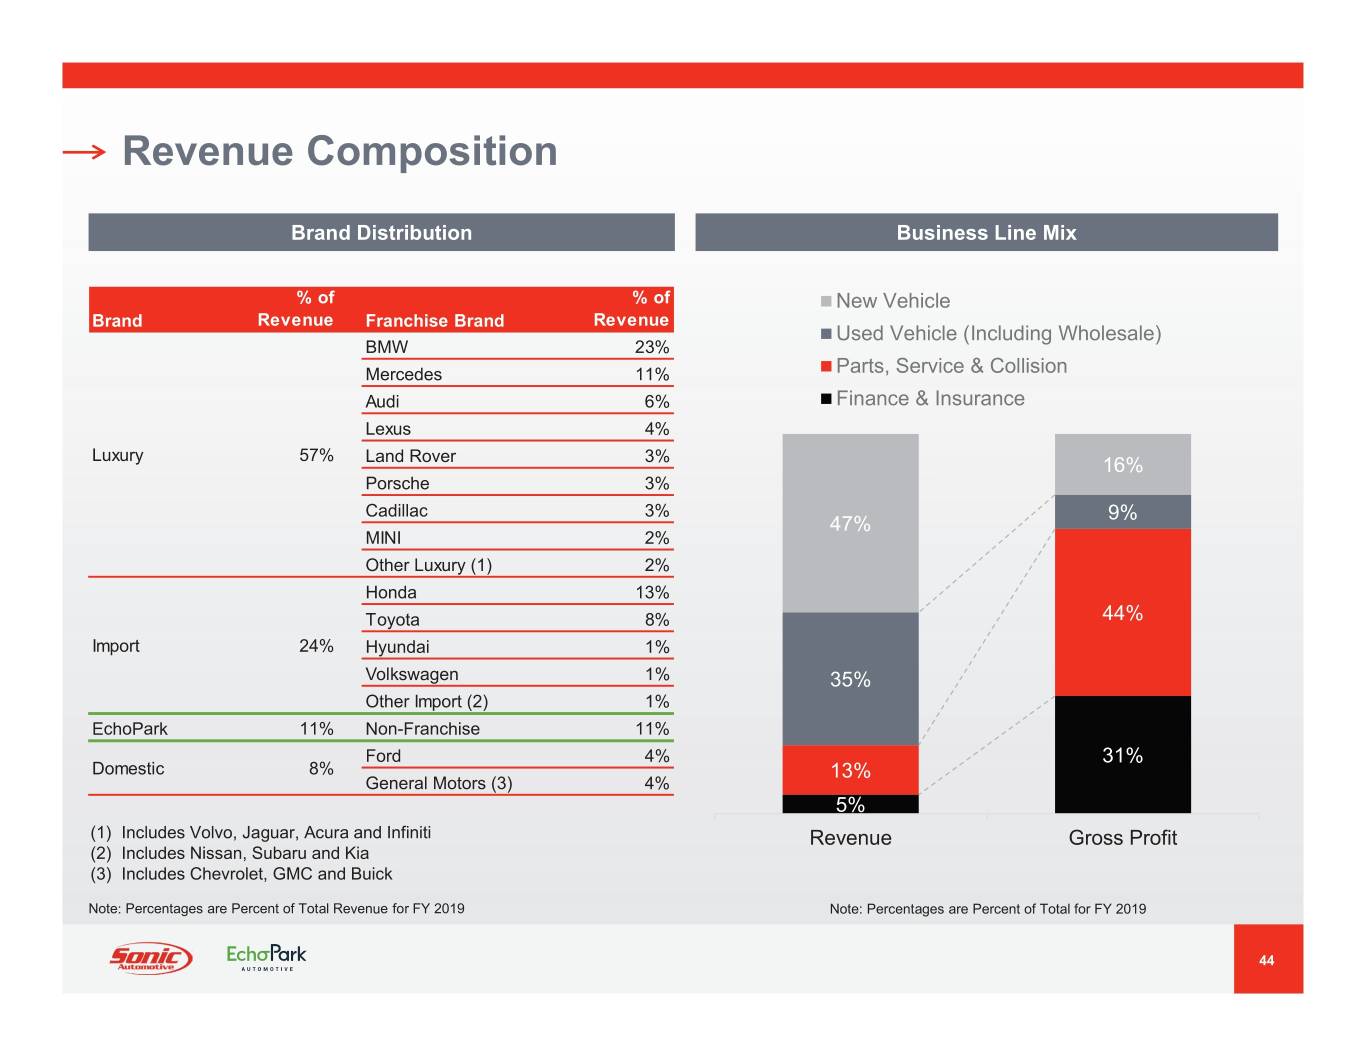
Revenue Composition Brand Distribution Business Line Mix % of % of New Vehicle Brand Revenue Franchise Brand Revenue Used Vehicle (Including Wholesale) BMW 23% Mercedes 11% Parts, Service & Collision Audi 6% Finance & Insurance Lexus 4% Luxury 57% Land Rover 3% 16% Porsche 3% Cadillac 3% 9% 47% MINI 2% Other Luxury (1) 2% Honda 13% Toyota 8% 44% Import 24% Hyundai 1% Volkswagen 1% 35% Other Import (2) 1% EchoPark 11% Non-Franchise 11% Ford 4% 31% Domestic 8% 13% General Motors (3) 4% 5% (1) Includes Volvo, Jaguar, Acura and Infiniti Revenue Gross Profit (2) Includes Nissan, Subaru and Kia (3) Includes Chevrolet, GMC and Buick Note: Percentages are Percent of Total Revenue for FY 2019 Note: Percentages are Percent of Total for FY 2019 44
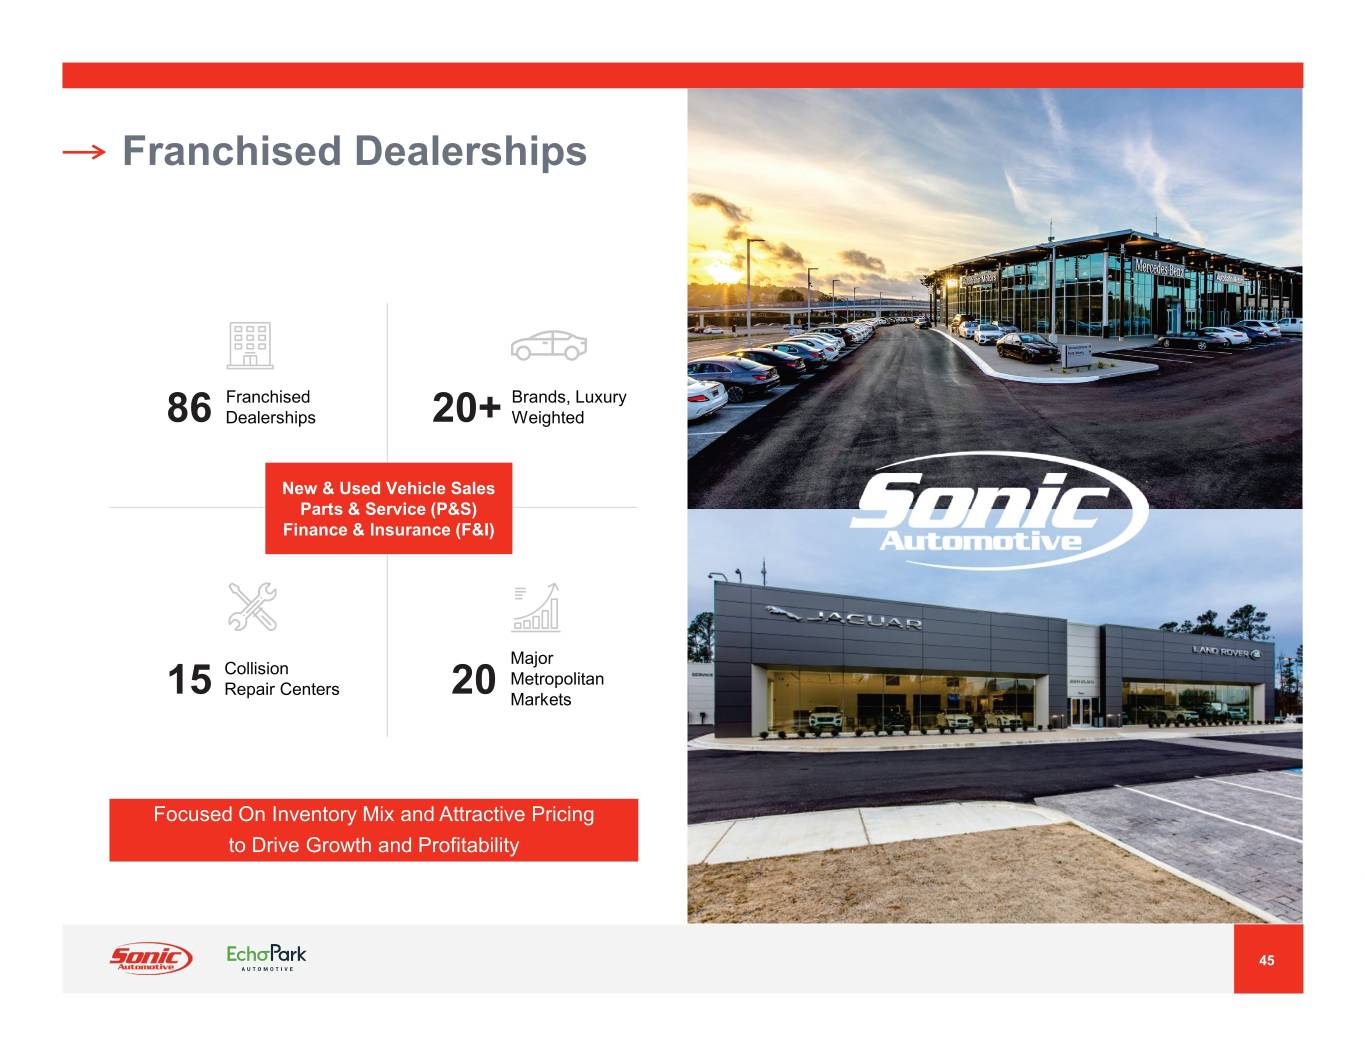
Franchised Dealerships Franchised Brands, Luxury 86 Dealerships 20+ Weighted New & Used Vehicle Sales Parts & Service (P&S) Finance & Insurance (F&I) Major Collision Metropolitan Repair Centers 15 20 Markets Focused On Inventory Mix and Attractive Pricing to Drive Growth and Profitability 45
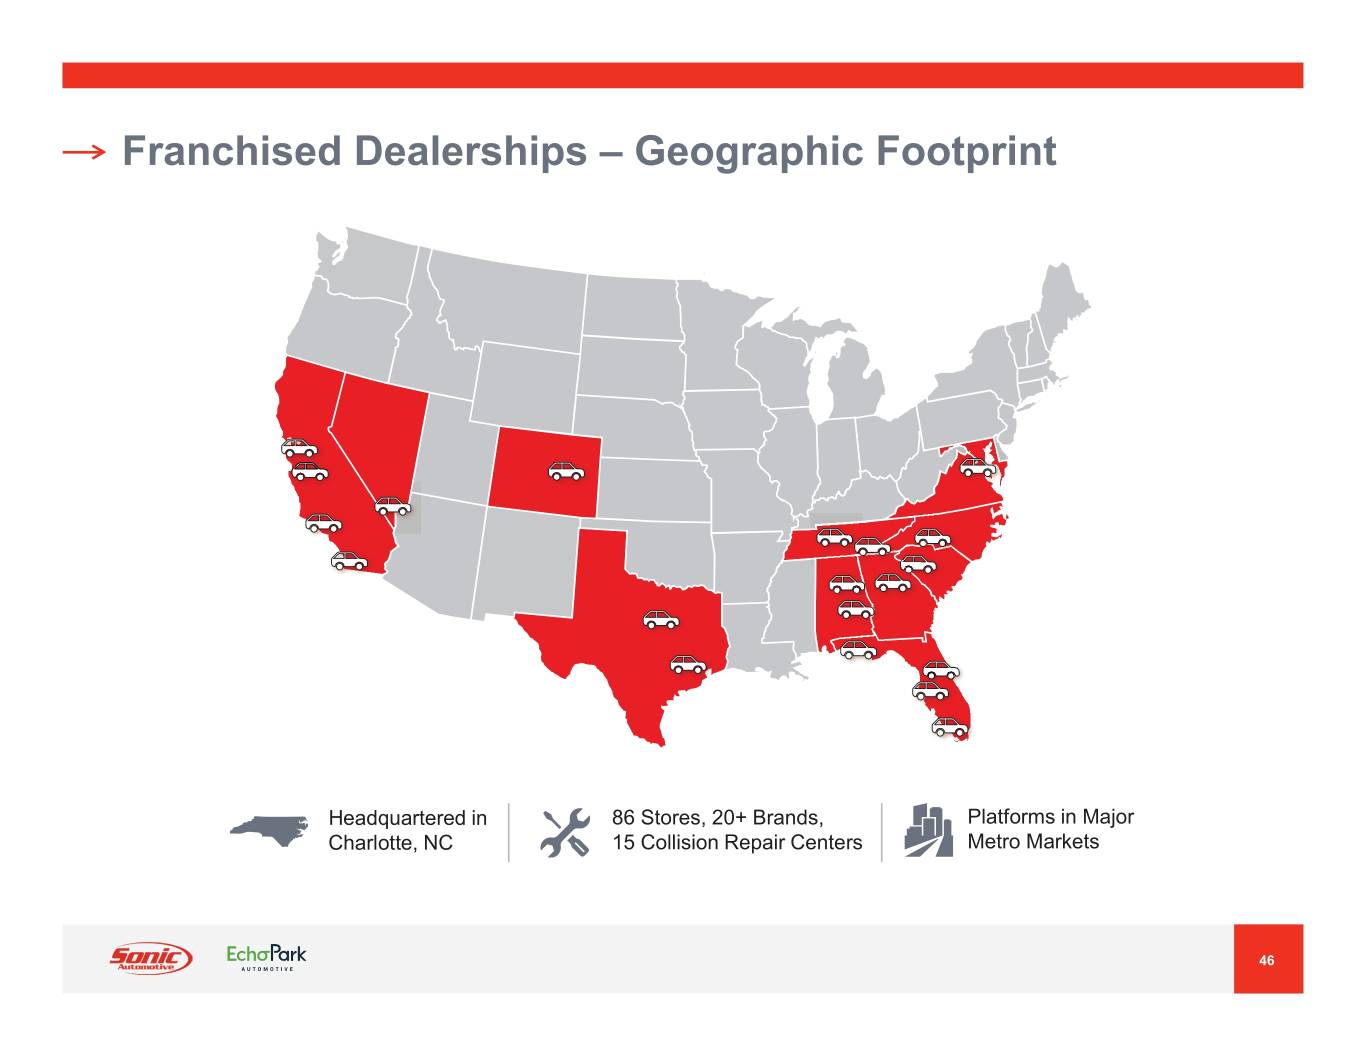
Franchised Dealerships – Geographic Footprint Headquartered in 86 Stores, 20+ Brands, Platforms in Major Charlotte, NC 15 Collision Repair Centers Metro Markets 46
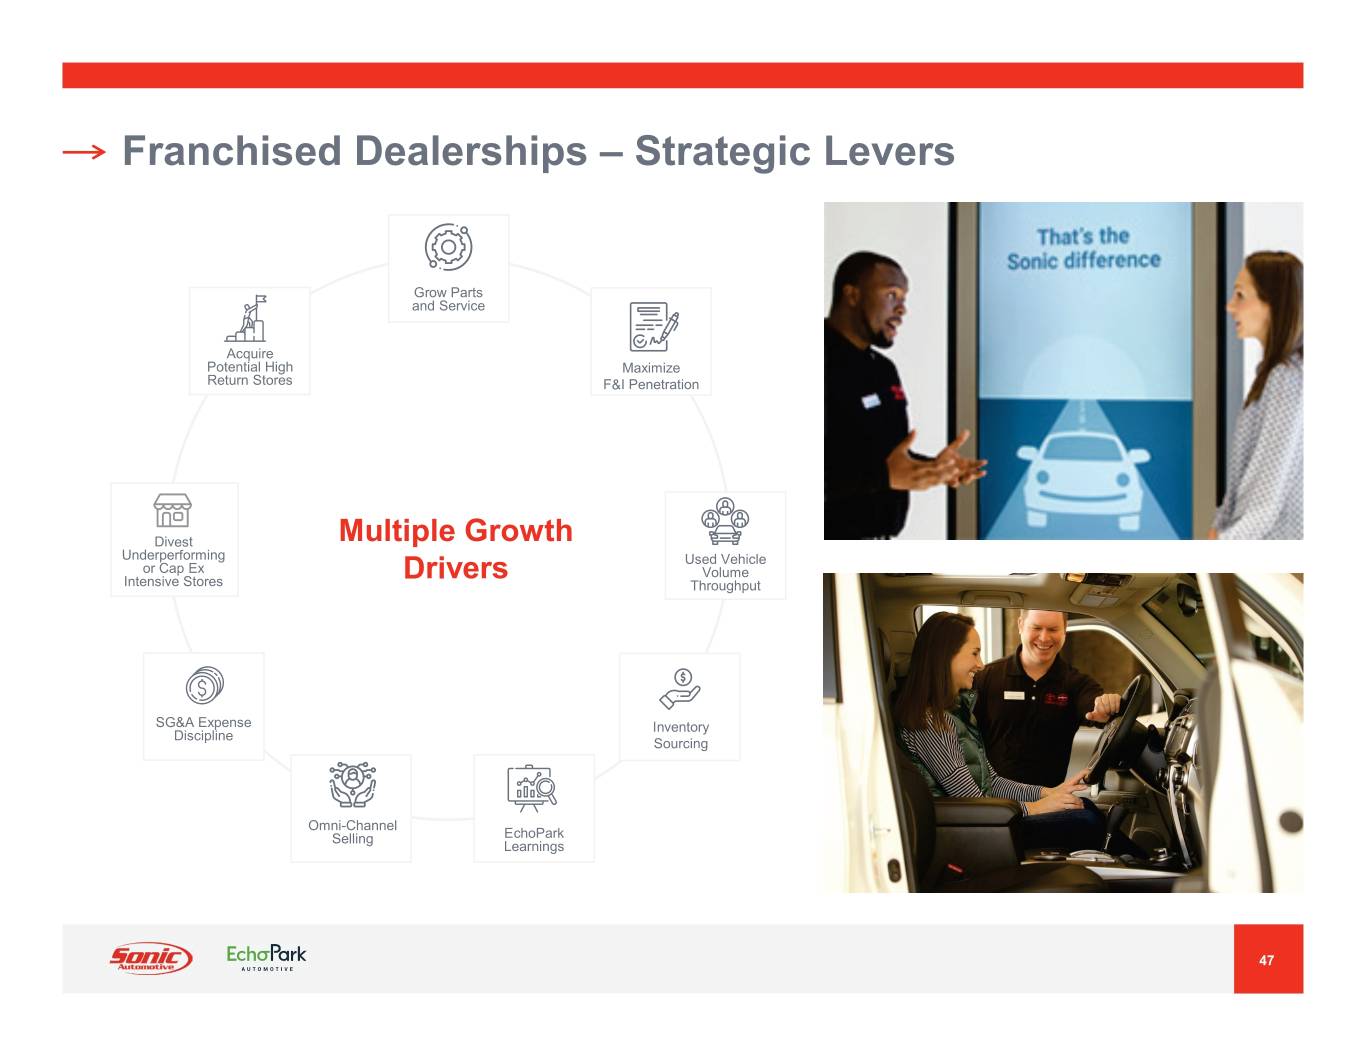
Franchised Dealerships – Strategic Levers Grow Parts and Service Acquire Potential High Maximize Return Stores F&I Penetration Divest Multiple Growth Underperforming Used Vehicle or Cap Ex Drivers Volume Intensive Stores Throughput SG&A Expense Inventory Discipline Sourcing Omni-Channel Selling EchoPark Learnings 47
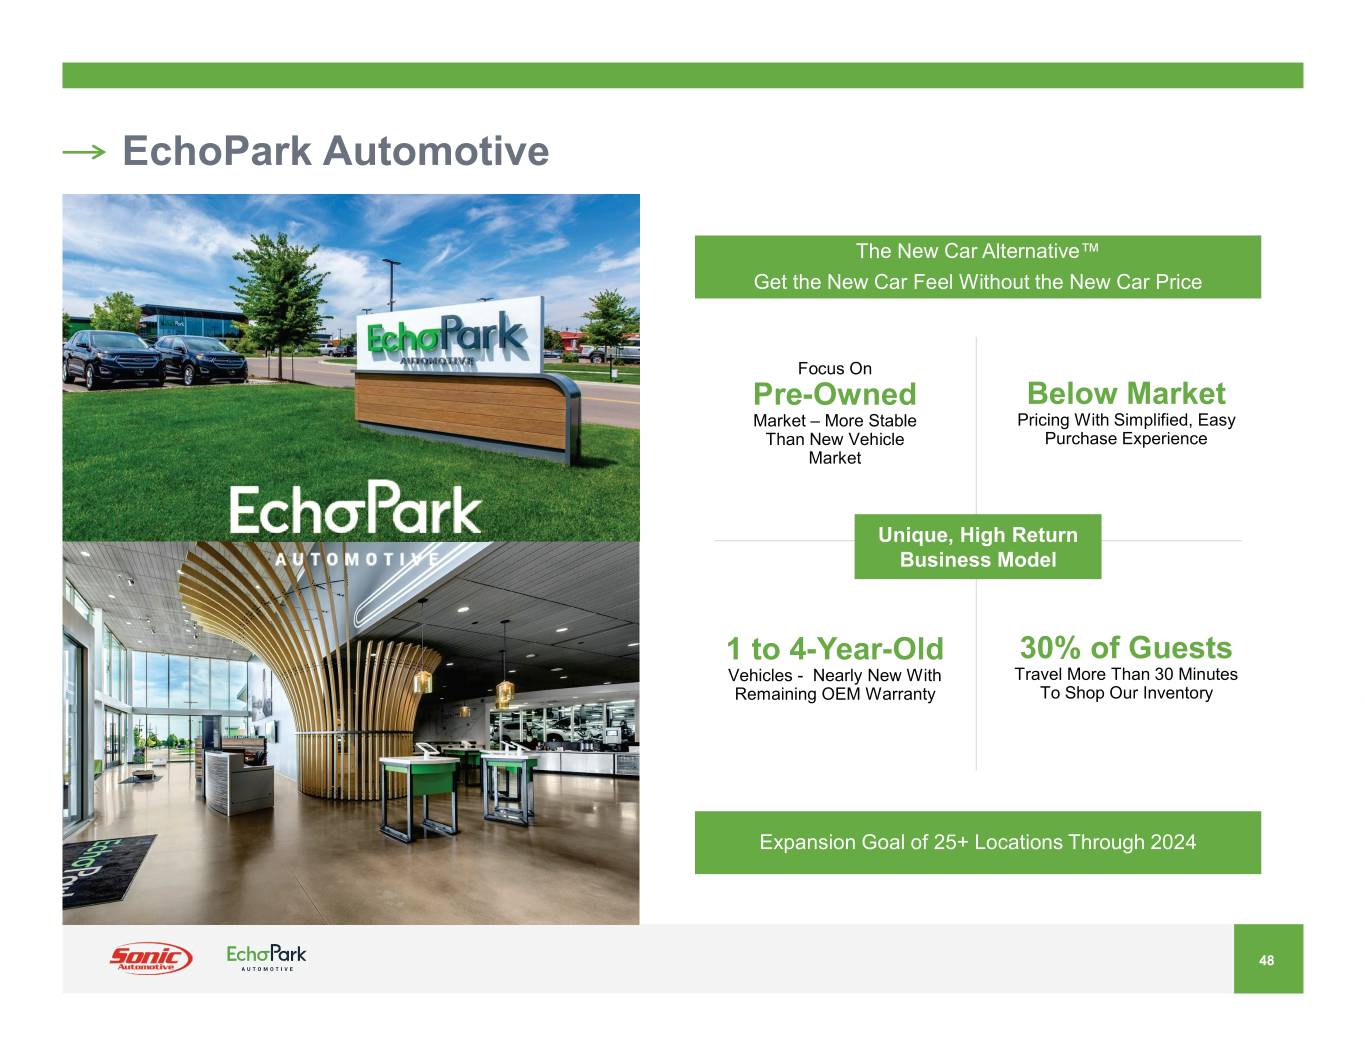
EchoPark Automotive The New Car Alternative™ Get the New Car Feel Without the New Car Price Focus On Pre-Owned Below Market Market – More Stable Pricing With Simplified, Easy Than New Vehicle Purchase Experience Market Unique, High Return Business Model 1 to 4-Year-Old 30% of Guests Vehicles - Nearly New With Travel More Than 30 Minutes Remaining OEM Warranty To Shop Our Inventory Expansion Goal of 25+ Locations Through 2024 48
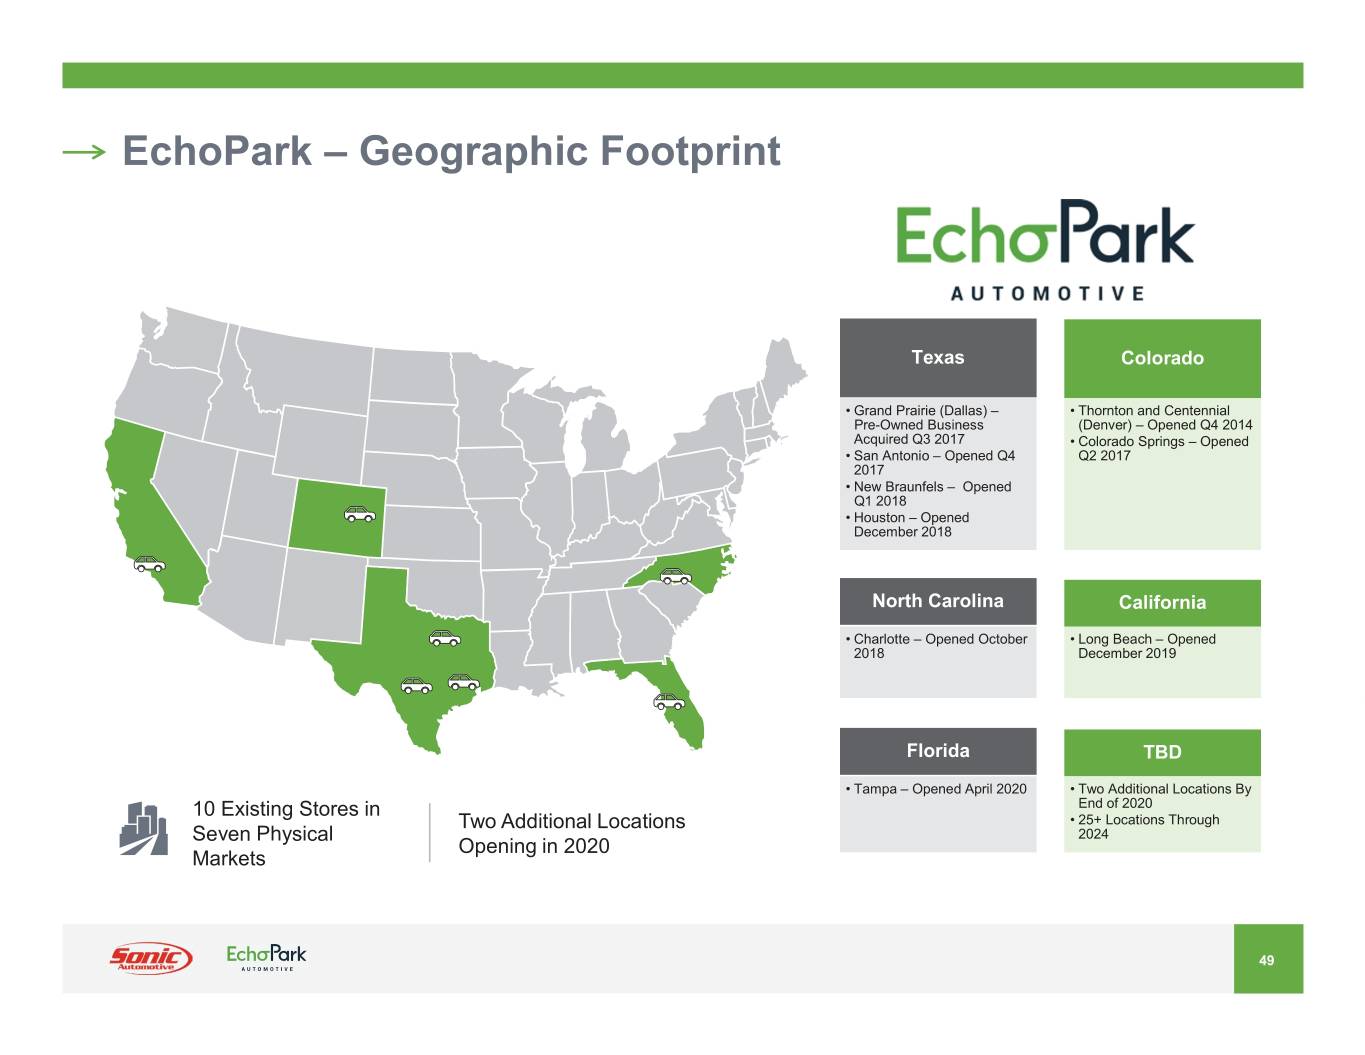
EchoPark – Geographic Footprint Texas Colorado ‡ Grand Prairie (Dallas) – ‡ Thornton and Centennial Pre-Owned Business (Denver) – Opened Q4 2014 Acquired Q3 2017 ‡ Colorado Springs – Opened ‡ San Antonio – Opened Q4 Q2 2017 2017 ‡ New Braunfels – Opened Q1 2018 ‡ Houston – Opened December 2018 North Carolina California ‡ Charlotte – Opened October ‡ Long Beach – Opened 2018 December 2019 Florida TBD ‡ Tampa – Opened April 2020 ‡ Two Additional Locations By 10 Existing Stores in End of 2020 Two Additional Locations ‡ 25+ Locations Through Seven Physical 2024 Opening in 2020 Markets 49
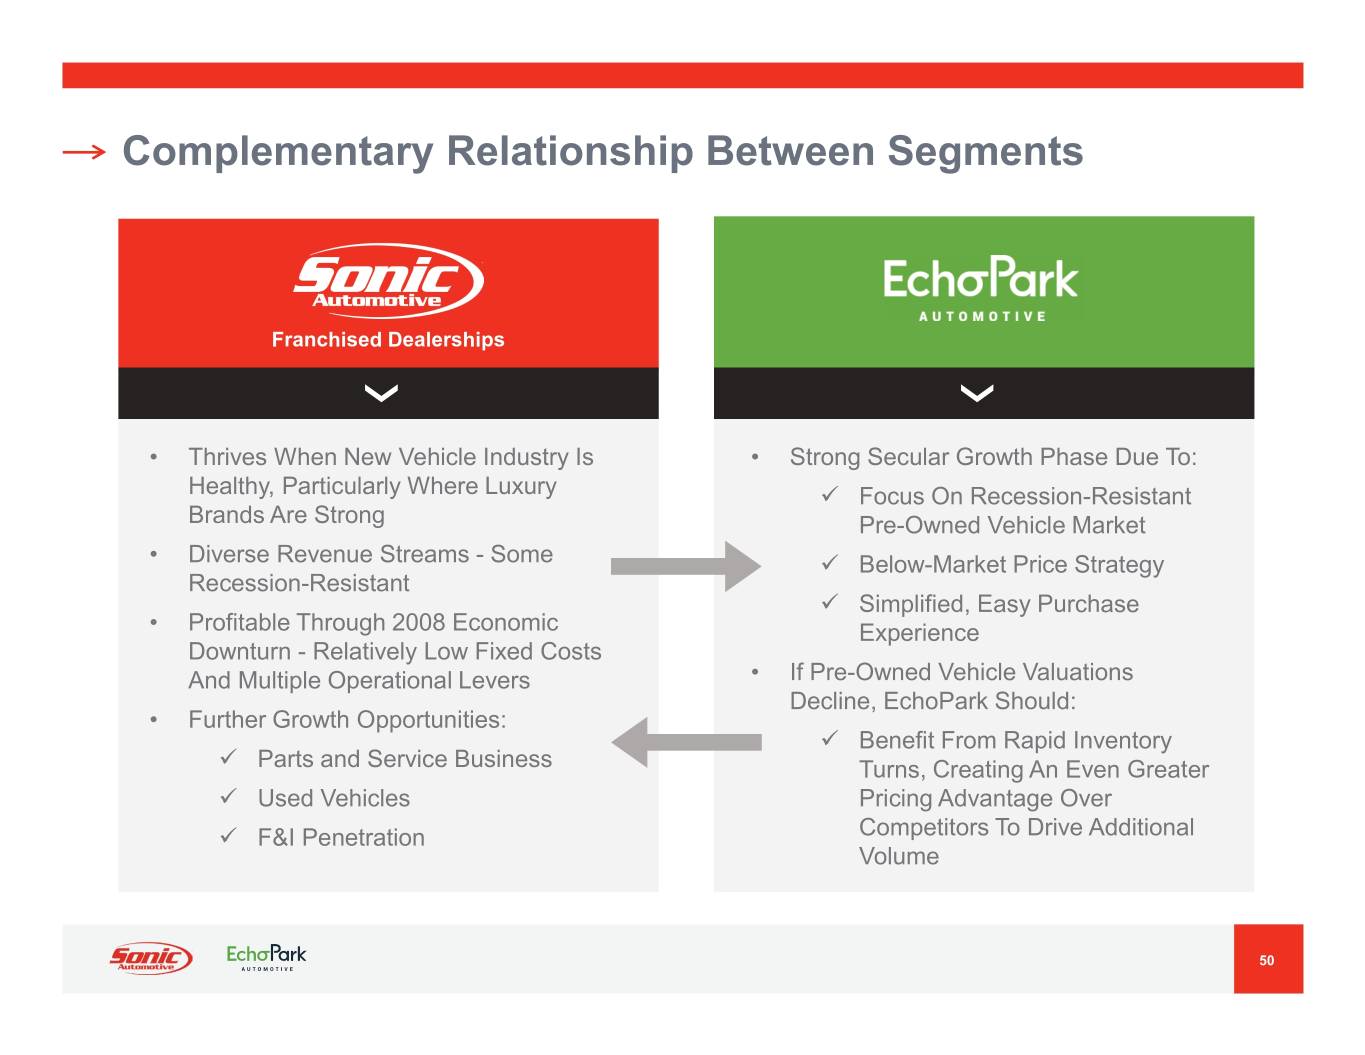
Complementary Relationship Between Segments Franchised Dealerships ‡ Thrives When New Vehicle Industry Is ‡ Strong Secular Growth Phase Due To: Healthy, Particularly Where Luxury 9 Focus On Recession-Resistant Brands Are Strong Pre-Owned Vehicle Market ‡ Diverse Revenue Streams - Some 9 Below-Market Price Strategy Recession-Resistant 9 Simplified, Easy Purchase ‡ Profitable Through 2008 Economic Experience Downturn - Relatively Low Fixed Costs And Multiple Operational Levers ‡ If Pre-Owned Vehicle Valuations Decline, EchoPark Should: ‡ Further Growth Opportunities: 9 Benefit From Rapid Inventory 9 Parts and Service Business Turns, Creating An Even Greater 9 Used Vehicles Pricing Advantage Over 9 F&I Penetration Competitors To Drive Additional Volume 50
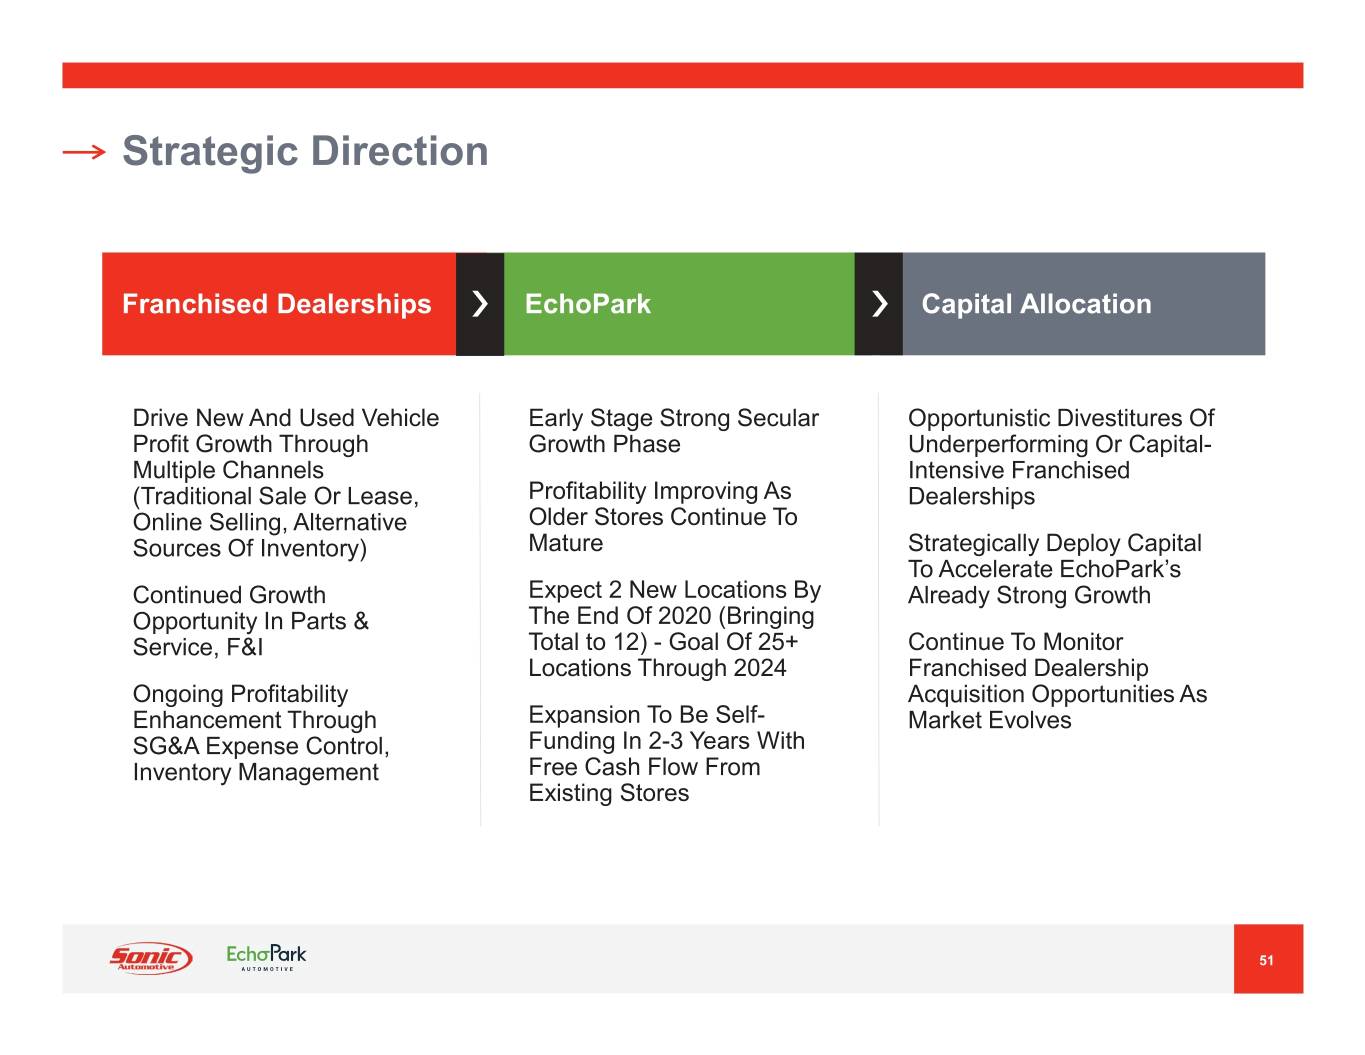
Strategic Direction Franchised Dealerships EchoPark Capital Allocation Drive New And Used Vehicle Early Stage Strong Secular Opportunistic Divestitures Of Profit Growth Through Growth Phase Underperforming Or Capital- Multiple Channels Intensive Franchised (Traditional Sale Or Lease, Profitability Improving As Dealerships Online Selling, Alternative Older Stores Continue To Sources Of Inventory) Mature Strategically Deploy Capital To Accelerate EchoPark’s Continued Growth Expect 2 New Locations By Already Strong Growth Opportunity In Parts & The End Of 2020 (Bringing Service, F&I Total to 12) - Goal Of 25+ Continue To Monitor Locations Through 2024 Franchised Dealership Ongoing Profitability Acquisition Opportunities As Enhancement Through Expansion To Be Self- Market Evolves SG&A Expense Control, Funding In 2-3 Years With Inventory Management Free Cash Flow From Existing Stores 51

Appendix – Non-GAAP Reconciliations April 29, 2020
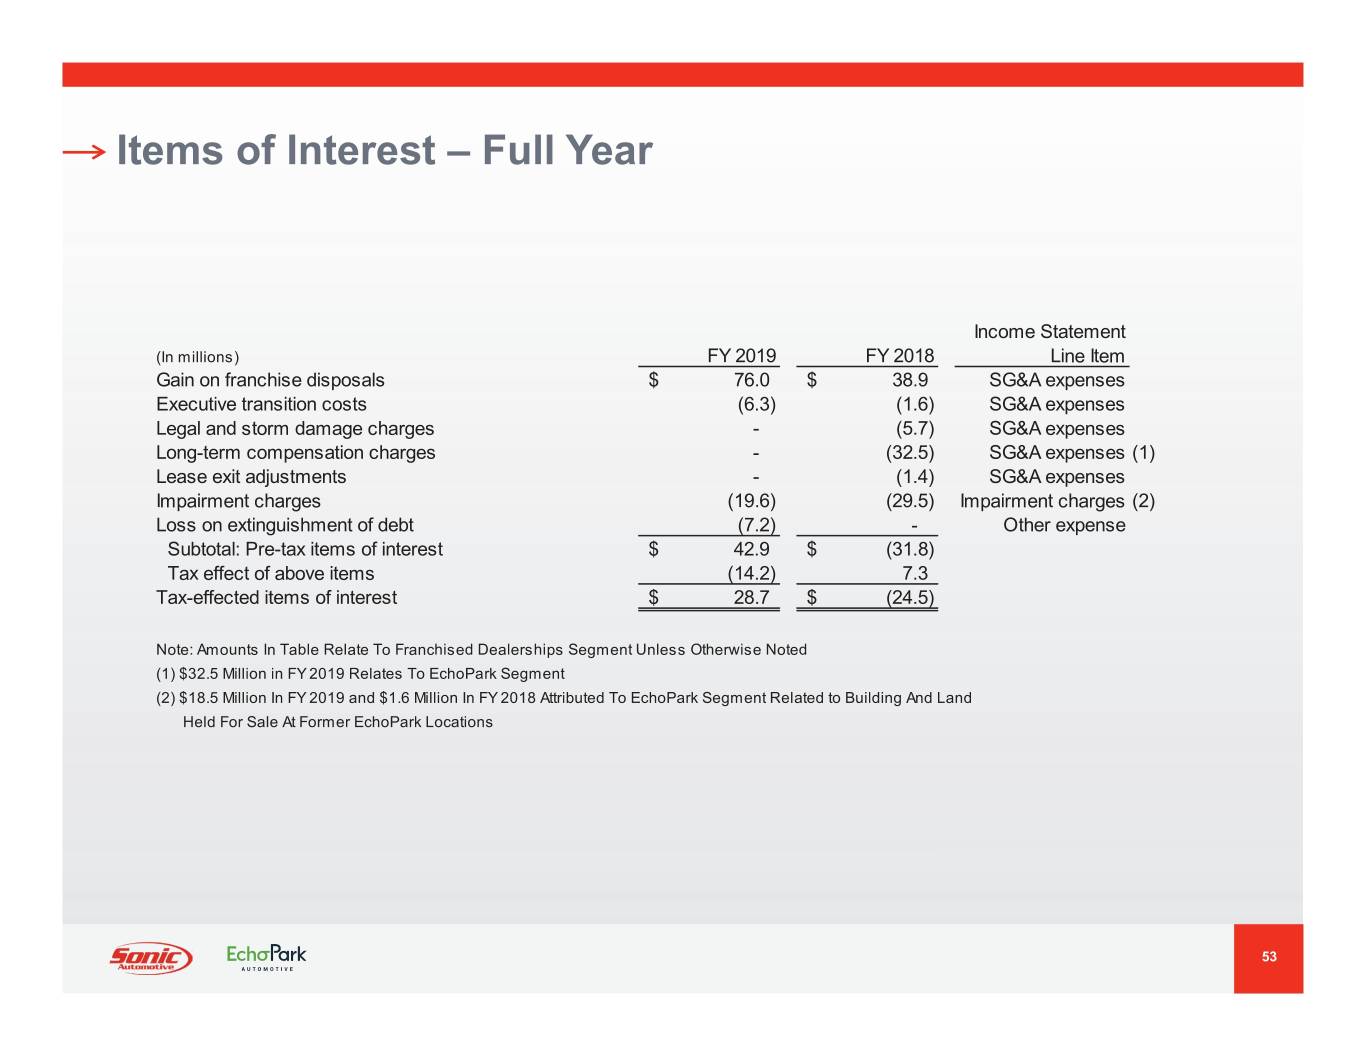
Items of Interest – Full Year Income Statement (In millions) FY 2019 FY 2018 Line Item Gain on franchise disposals$ 76.0 $ 38.9 SG&A expenses Executive transition costs (6.3) (1.6) SG&A expenses Legal and storm damage charges - (5.7) SG&A expenses Long-term compensation charges - (32.5) SG&A expenses (1) Lease exit adjustments - (1.4) SG&A expenses Impairment charges (19.6) (29.5) Impairment charges (2) Loss on extinguishment of debt (7.2) - Other expense Subtotal: Pre-tax items of interest$ 42.9 $ (31.8) Tax effect of above items (14.2) 7.3 Tax-effected items of interest$ 28.7 $ (24.5) Note: Amounts In Table Relate To Franchised Dealerships Segment Unless Otherwise Noted (1) $32.5 Million in FY 2019 Relates To EchoPark Segment (2) $18.5 Million In FY 2019 and $1.6 Million In FY 2018 Attributed To EchoPark Segment Related to Building And Land Held For Sale At Former EchoPark Locations 53
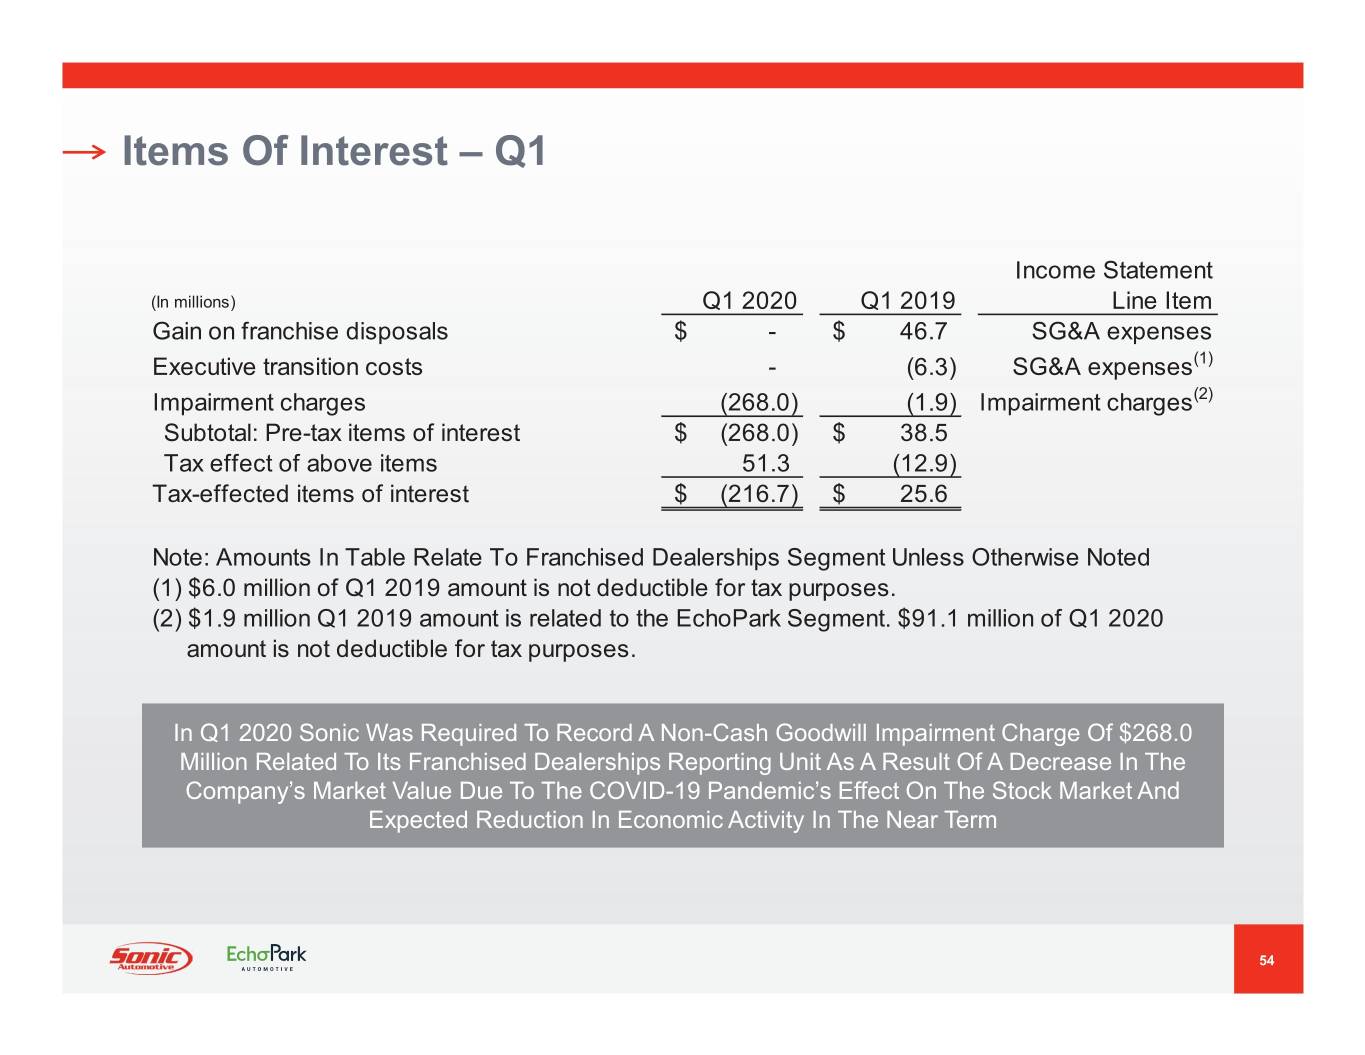
Items Of Interest – Q1 Income Statement (In millions) Q1 2020 Q1 2019 Line Item Gain on franchise disposals$ - $ 46.7 SG&A expenses Executive transition costs - (6.3) SG&A expenses (1) Impairment charges (268.0) (1.9) Impairment charges (2) Subtotal: Pre-tax items of interest$ (268.0) $ 38.5 Tax effect of above items 51.3 (12.9) Tax-effected items of interest$ (216.7) $ 25.6 Note: Amounts In Table Relate To Franchised Dealerships Segment Unless Otherwise Noted (1) $6.0 million of Q1 2019 amount is not deductible for tax purposes. (2) $1.9 million Q1 2019 amount is related to the EchoPark Segment. $91.1 million of Q1 2020 amount is not deductible for tax purposes. In Q1 2020 Sonic Was Required To Record A Non-Cash Goodwill Impairment Charge Of $268.0 Million Related To Its Franchised Dealerships Reporting Unit As A Result Of A Decrease In The Company’s Market Value Due To The COVID-19 Pandemic’s Effect On The Stock Market And Expected Reduction In Economic Activity In The Near Term 54
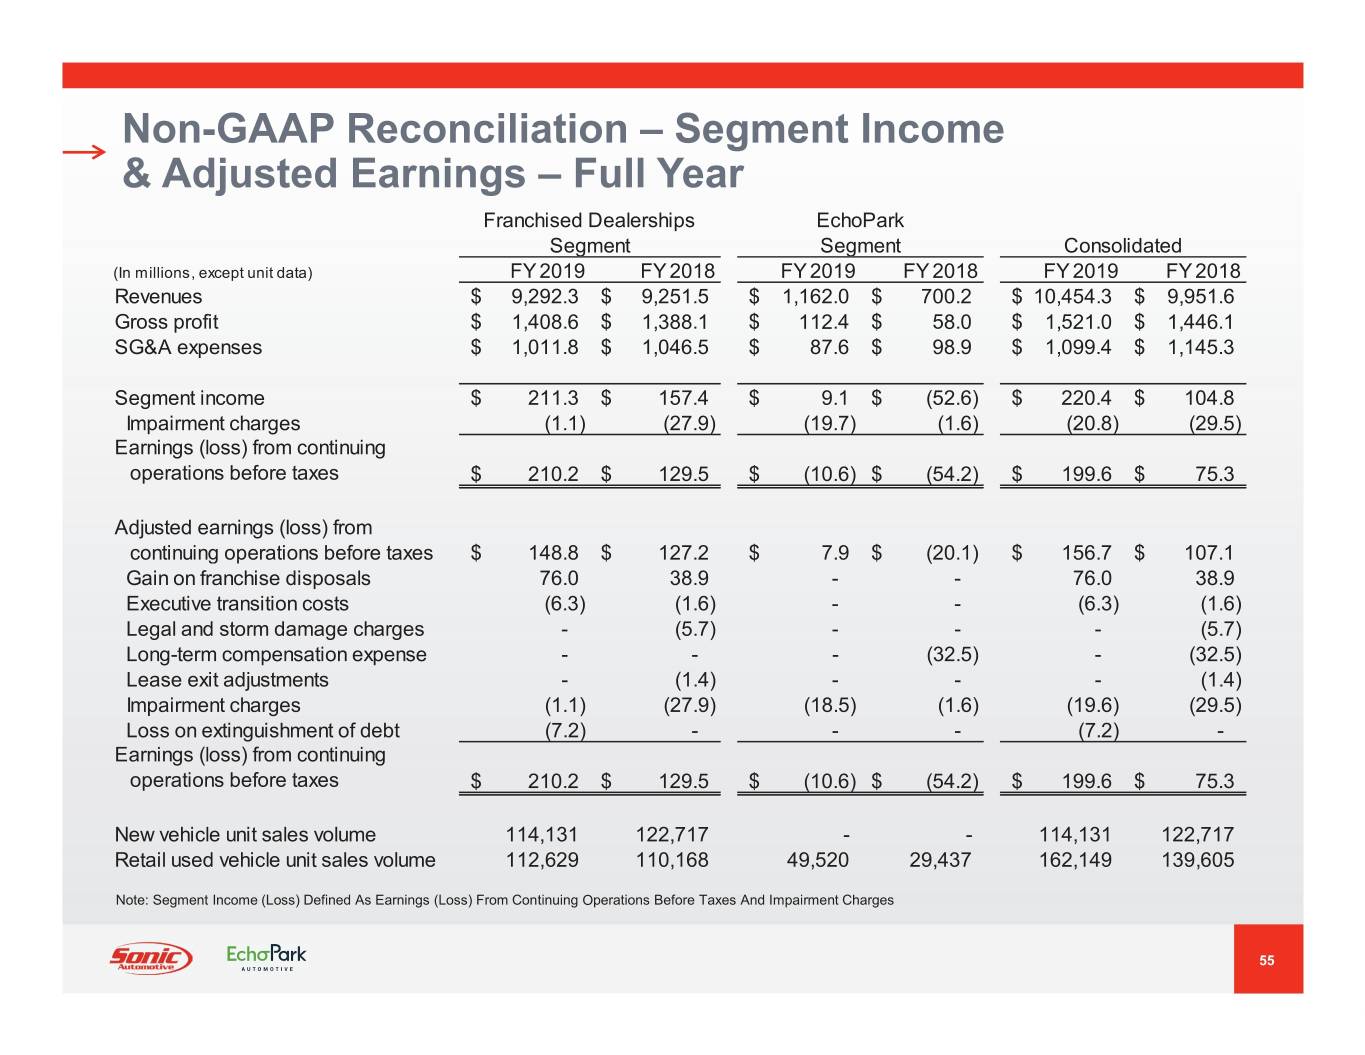
Non-GAAP Reconciliation – Segment Income & Adjusted Earnings – Full Year Franchised Dealerships EchoPark Segment Segment Consolidated (In millions, except unit data) FY 2019 FY 2018 FY 2019 FY 2018 FY 2019 FY 2018 Revenues$ 9,292.3 $ 9,251.5 $ 1,162.0 $ 700.2 $ 10,454.3 $ 9,951.6 Gross profit$ 1,408.6 $ 1,388.1 $ 112.4 $ 58.0 $ 1,521.0 $ 1,446.1 SG&A expenses$ 1,011.8 $ 1,046.5 $ 87.6 $ 98.9 $ 1,099.4 $ 1,145.3 Segment income$ 211.3 $ 157.4 $ 9.1 $ (52.6) $ 220.4 $ 104.8 Impairment charges (1.1) (27.9) (19.7) (1.6) (20.8) (29.5) Earnings (loss) from continuing operations before taxes $ 210.2 $ 129.5 $ (10.6) $ (54.2) $ 199.6 $ 75.3 Adjusted earnings (loss) from continuing operations before taxes$ 148.8 $ 127.2 $ 7.9 $ (20.1) $ 156.7 $ 107.1 Gain on franchise disposals 76.0 38.9 - - 76.0 38.9 Executive transition costs (6.3) (1.6) - - (6.3) (1.6) Legal and storm damage charges - (5.7) - - - (5.7) Long-term compensation expense - - - (32.5) - (32.5) Lease exit adjustments - (1.4) - - - (1.4) Impairment charges (1.1) (27.9) (18.5) (1.6) (19.6) (29.5) Loss on extinguishment of debt (7.2) - - - (7.2) - Earnings (loss) from continuing operations before taxes $ 210.2 $ 129.5 $ (10.6) $ (54.2) $ 199.6 $ 75.3 New vehicle unit sales volume 114,131 122,717 - - 114,131 122,717 Retail used vehicle unit sales volume 112,629 110,168 49,520 29,437 162,149 139,605 Note: Segment Income (Loss) Defined As Earnings (Loss) From Continuing Operations Before Taxes And Impairment Charges 55
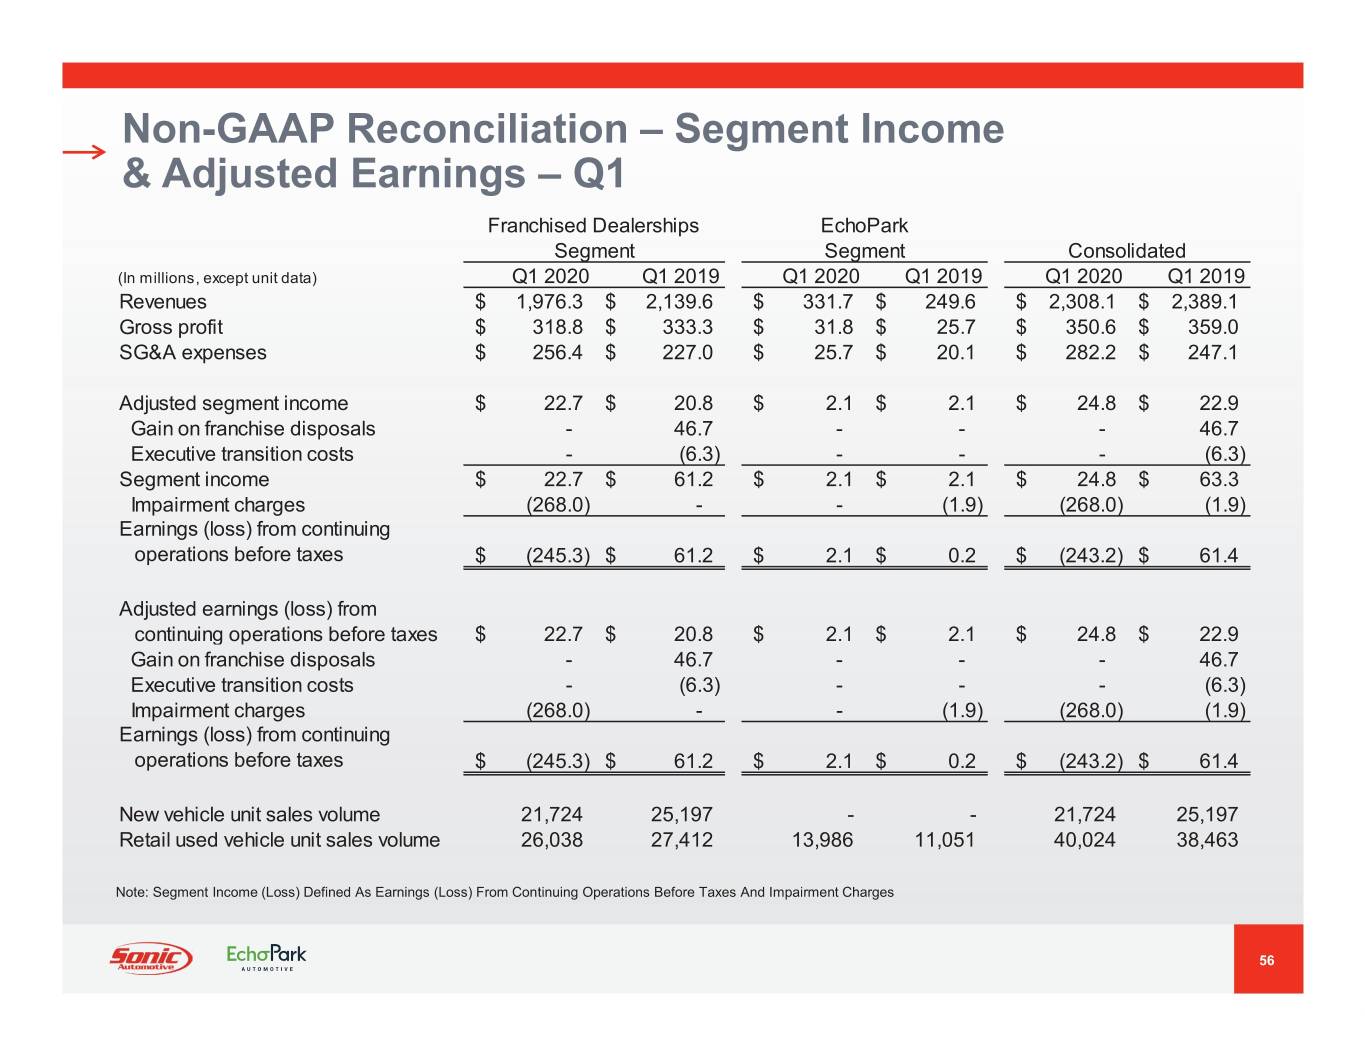
Non-GAAP Reconciliation – Segment Income & Adjusted Earnings – Q1 Franchised Dealerships EchoPark Segment Segment Consolidated (In millions, except unit data) Q1 2020 Q1 2019 Q1 2020 Q1 2019 Q1 2020 Q1 2019 Revenues$ 1,976.3 $ 2,139.6 $ 331.7 $ 249.6 $ 2,308.1 $ 2,389.1 Gross profit$ 318.8 $ 333.3 $ 31.8 $ 25.7 $ 350.6 $ 359.0 SG&A expenses$ 256.4 $ 227.0 $ 25.7 $ 20.1 $ 282.2 $ 247.1 Adjusted segment income$ 22.7 $ 20.8 $ 2.1 $ 2.1 $ 24.8 $ 22.9 Gain on franchise disposals - 46.7 - - - 46.7 Executive transition costs - (6.3) - - - (6.3) Segment income$ 22.7 $ 61.2 $ 2.1 $ 2.1 $ 24.8 $ 63.3 Impairment charges (268.0) - - (1.9) (268.0) (1.9) Earnings (loss) from continuing operations before taxes $ (245.3) $ 61.2 $ 2.1 $ 0.2 $ (243.2) $ 61.4 Adjusted earnings (loss) from continuing operations before taxes$ 22.7 $ 20.8 $ 2.1 $ 2.1 $ 24.8 $ 22.9 Gain on franchise disposals - 46.7 - - - 46.7 Executive transition costs - (6.3) - - - (6.3) Impairment charges (268.0) - - (1.9) (268.0) (1.9) Earnings (loss) from continuing operations before taxes $ (245.3) $ 61.2 $ 2.1 $ 0.2 $ (243.2) $ 61.4 New vehicle unit sales volume 21,724 25,197 - - 21,724 25,197 Retail used vehicle unit sales volume 26,038 27,412 13,986 11,051 40,024 38,463 Note: Segment Income (Loss) Defined As Earnings (Loss) From Continuing Operations Before Taxes And Impairment Charges 56
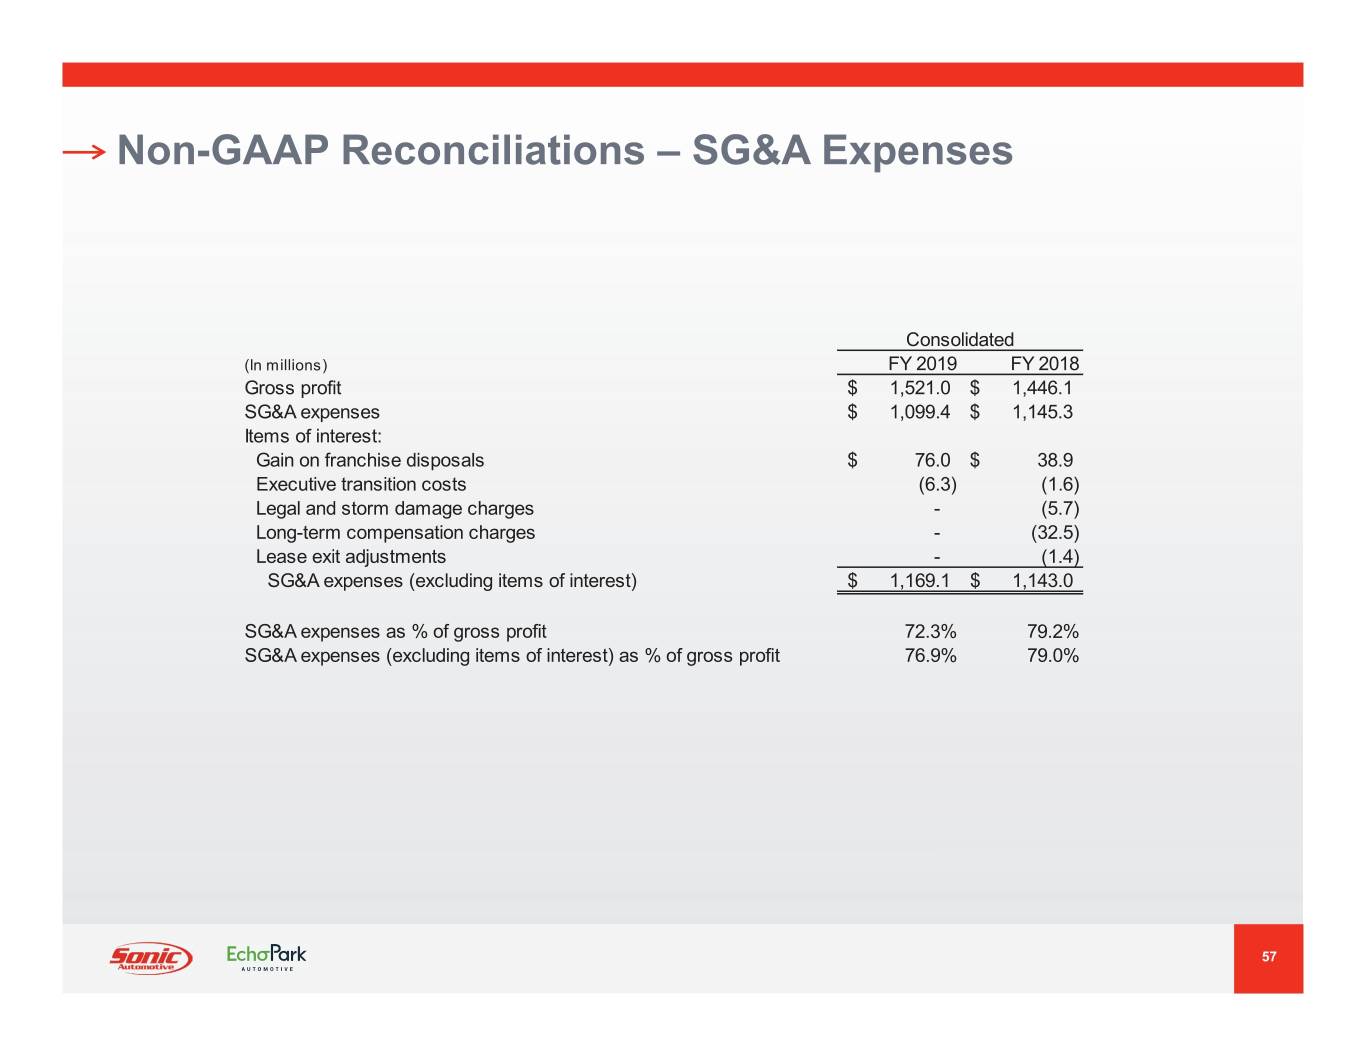
Non-GAAP Reconciliations – SG&A Expenses Consolidated (In millions) FY 2019 FY 2018 Gross profit$ 1,521.0 $ 1,446.1 SG&A expenses$ 1,099.4 $ 1,145.3 Items of interest: Gain on franchise disposals$ 76.0 $ 38.9 Executive transition costs (6.3) (1.6) Legal and storm damage charges - (5.7) Long-term compensation charges - (32.5) Lease exit adjustments - (1.4) SG&A expenses (excluding items of interest)$ 1,169.1 $ 1,143.0 SG&A expenses as % of gross profit 72.3% 79.2% SG&A expenses (excluding items of interest) as % of gross profit 76.9% 79.0% 57
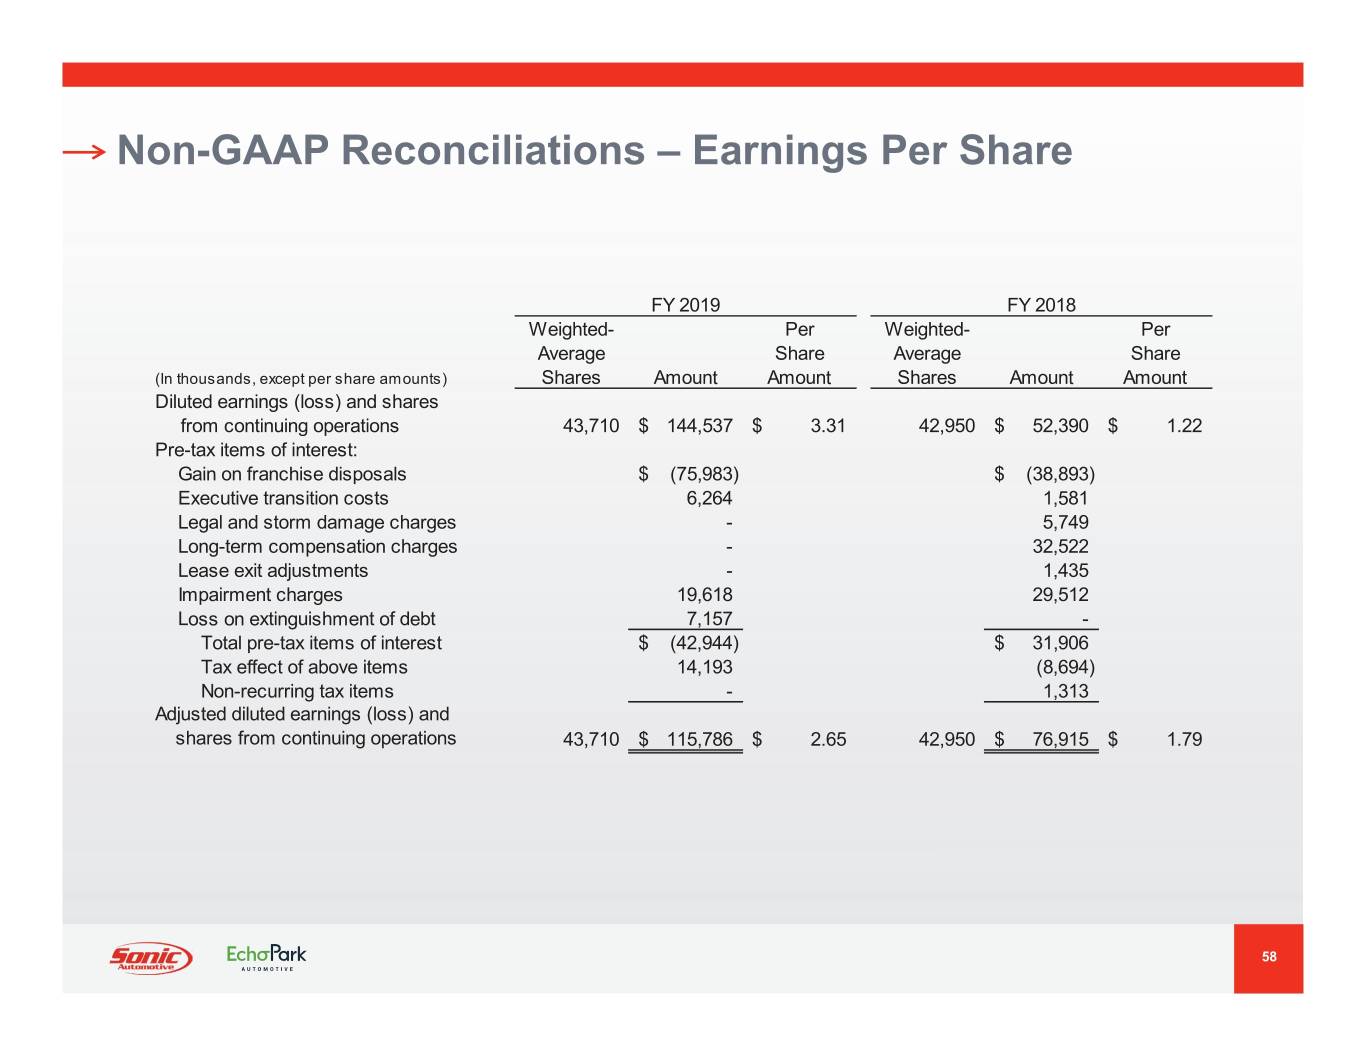
Non-GAAP Reconciliations – Earnings Per Share FY 2019 FY 2018 Weighted- Per Weighted- Per Average Share Average Share (In thousands, except per share amounts) Shares Amount Amount Shares Amount Amount Diluted earnings (loss) and shares from continuing operations 43,710 $ 144,537 $ 3.31 42,950 $ 52,390 $ 1.22 Pre-tax items of interest: Gain on franchise disposals$ (75,983) $ (38,893) Executive transition costs 6,264 1,581 Legal and storm damage charges - 5,749 Long-term compensation charges - 32,522 Lease exit adjustments - 1,435 Impairment charges 19,618 29,512 Loss on extinguishment of debt 7,157 - Total pre-tax items of interest$ (42,944) $ 31,906 Tax effect of above items 14,193 (8,694) Non-recurring tax items - 1,313 Adjusted diluted earnings (loss) and shares from continuing operations 43,710 $ 115,786 $ 2.65 42,950 $ 76,915 $ 1.79 58
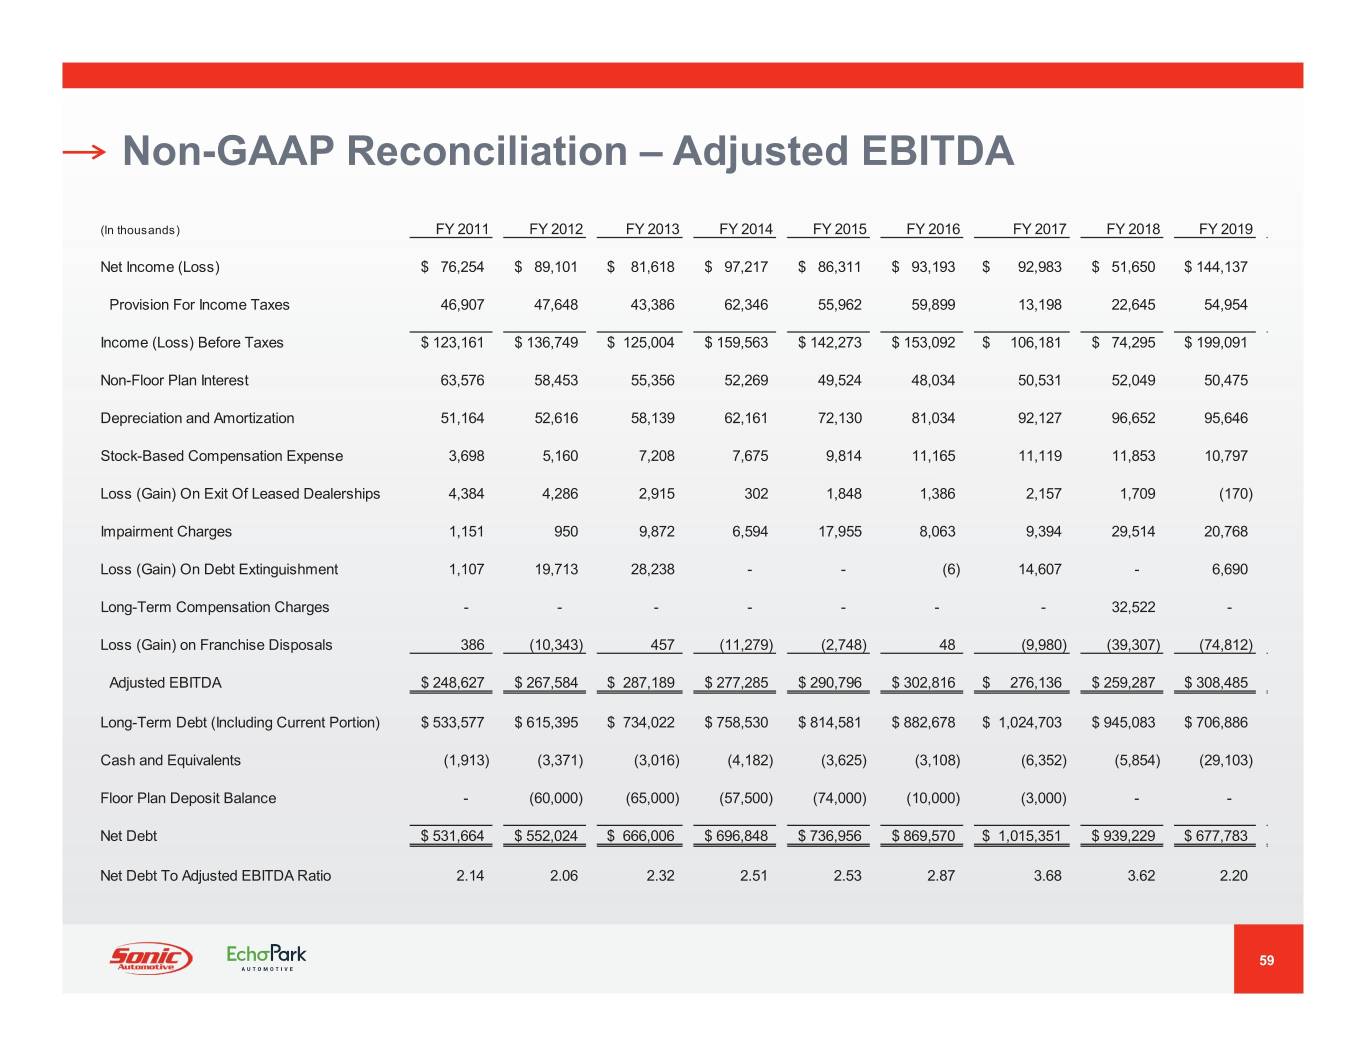
Non-GAAP Reconciliation – Adjusted EBITDA (In thousands) FY 2011 FY 2012 FY 2013 FY 2014 FY 2015 FY 2016 FY 2017 FY 2018 FY 2019 Net Income (Loss)$ 76,254 $ 89,101 $ 81,618 $ 97,217 $ 86,311 $ 93,193 $ 92,983 $ 51,650 $ 144,137 Provision For Income Taxes 46,907 47,648 43,386 62,346 55,962 59,899 13,198 22,645 54,954 Income (Loss) Before Taxes$ 123,161 $ 136,749 $ 125,004 $ 159,563 $ 142,273 $ 153,092 $ 106,181 $ 74,295 $ 199,091 Non-Floor Plan Interest 63,576 58,453 55,356 52,269 49,524 48,034 50,531 52,049 50,475 Depreciation and Amortization 51,164 52,616 58,139 62,161 72,130 81,034 92,127 96,652 95,646 Stock-Based Compensation Expense 3,698 5,160 7,208 7,675 9,814 11,165 11,119 11,853 10,797 Loss (Gain) On Exit Of Leased Dealerships 4,384 4,286 2,915 302 1,848 1,386 2,157 1,709 (170) Impairment Charges 1,151 950 9,872 6,594 17,955 8,063 9,394 29,514 20,768 Loss (Gain) On Debt Extinguishment 1,107 19,713 28,238 - - (6) 14,607 - 6,690 Long-Term Compensation Charges - - - - - - - 32,522 - Loss (Gain) on Franchise Disposals 386 (10,343) 457 (11,279) (2,748) 48 (9,980) (39,307) (74,812) Adjusted EBITDA$ 248,627 $ 267,584 $ 287,189 $ 277,285 $ 290,796 $ 302,816 $ 276,136 $ 259,287 $ 308,485 Long-Term Debt (Including Current Portion)$ 533,577 $ 615,395 $ 734,022 $ 758,530 $ 814,581 $ 882,678 $ 1,024,703 $ 945,083 $ 706,886 Cash and Equivalents (1,913) (3,371) (3,016) (4,182) (3,625) (3,108) (6,352) (5,854) (29,103) Floor Plan Deposit Balance - (60,000) (65,000) (57,500) (74,000) (10,000) (3,000) - - Net Debt$ 531,664 $ 552,024 $ 666,006 $ 696,848 $ 736,956 $ 869,570 $ 1,015,351 $ 939,229 $ 677,783 Net Debt To Adjusted EBITDA Ratio 2.14 2.06 2.32 2.51 2.53 2.87 3.68 3.62 2.20 59
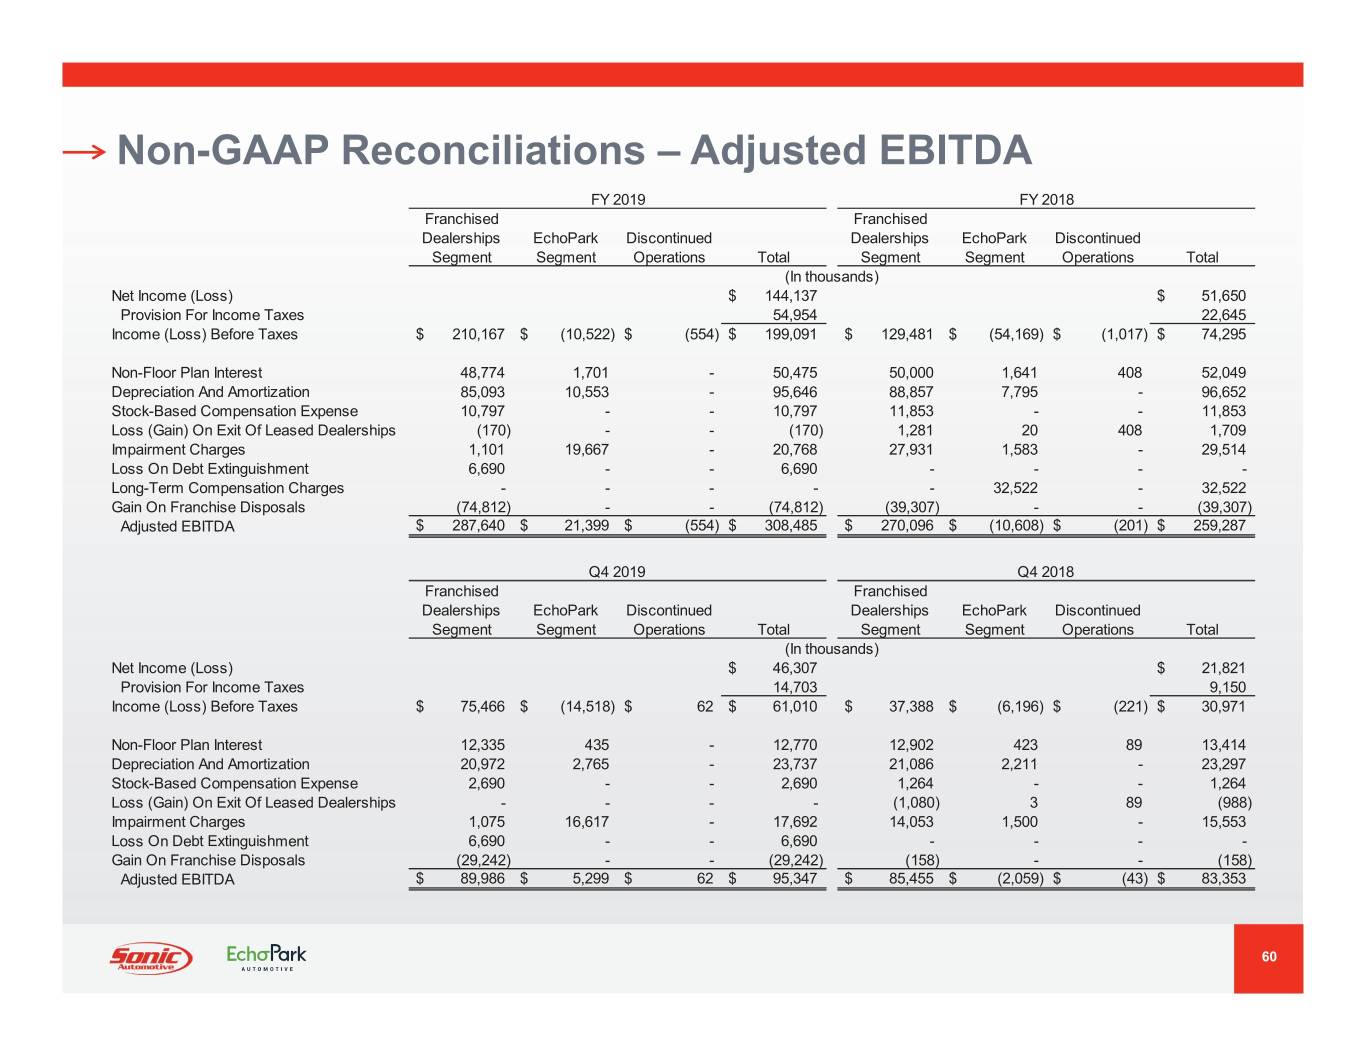
Non-GAAP Reconciliations – Adjusted EBITDA FY 2019 FY 2018 Franchised Franchised Dealerships EchoPark Discontinued Dealerships EchoPark Discontinued Segment Segment Operations Total Segment Segment Operations Total (In thousands) Net Income (Loss) $ 144,137 $ 51,650 Provision For Income Taxes 54,954 22,645 Income (Loss) Before Taxes $ 210,167 $ (10,522) $ (554) $ 199,091 $ 129,481 $ (54,169) $ (1,017) $ 74,295 Non-Floor Plan Interest 48,774 1,701 - 50,475 50,000 1,641 408 52,049 Depreciation And Amortization 85,093 10,553 - 95,646 88,857 7,795 - 96,652 Stock-Based Compensation Expense 10,797 - - 10,797 11,853 - - 11,853 Loss (Gain) On Exit Of Leased Dealerships (170) - - (170) 1,281 20 408 1,709 Impairment Charges 1,101 19,667 - 20,768 27,931 1,583 - 29,514 Loss On Debt Extinguishment 6,690 - - 6,690 - - - - Long-Term Compensation Charges - - - - - 32,522 - 32,522 Gain On Franchise Disposals (74,812) - - (74,812) (39,307) - - (39,307) Adjusted EBITDA $ 287,640 $ 21,399 $ (554) $ 308,485 $ 270,096 $ (10,608) $ (201) $ 259,287 Q4 2019 Q4 2018 Franchised Franchised Dealerships EchoPark Discontinued Dealerships EchoPark Discontinued Segment Segment Operations Total Segment Segment Operations Total (In thousands) Net Income (Loss) $ 46,307 $ 21,821 Provision For Income Taxes 14,703 9,150 Income (Loss) Before Taxes $ 75,466 $ (14,518) $ 62 $ 61,010 $ 37,388 $ (6,196) $ (221) $ 30,971 Non-Floor Plan Interest 12,335 435 - 12,770 12,902 423 89 13,414 Depreciation And Amortization 20,972 2,765 - 23,737 21,086 2,211 - 23,297 Stock-Based Compensation Expense 2,690 - - 2,690 1,264 - - 1,264 Loss (Gain) On Exit Of Leased Dealerships - - - - (1,080) 3 89 (988) Impairment Charges 1,075 16,617 - 17,692 14,053 1,500 - 15,553 Loss On Debt Extinguishment 6,690 - - 6,690 - - - - Gain On Franchise Disposals (29,242) - - (29,242) (158) - - (158) Adjusted EBITDA $ 89,986 $ 5,299 $ 62 $ 95,347 $ 85,455 $ (2,059) $ (43) $ 83,353 60
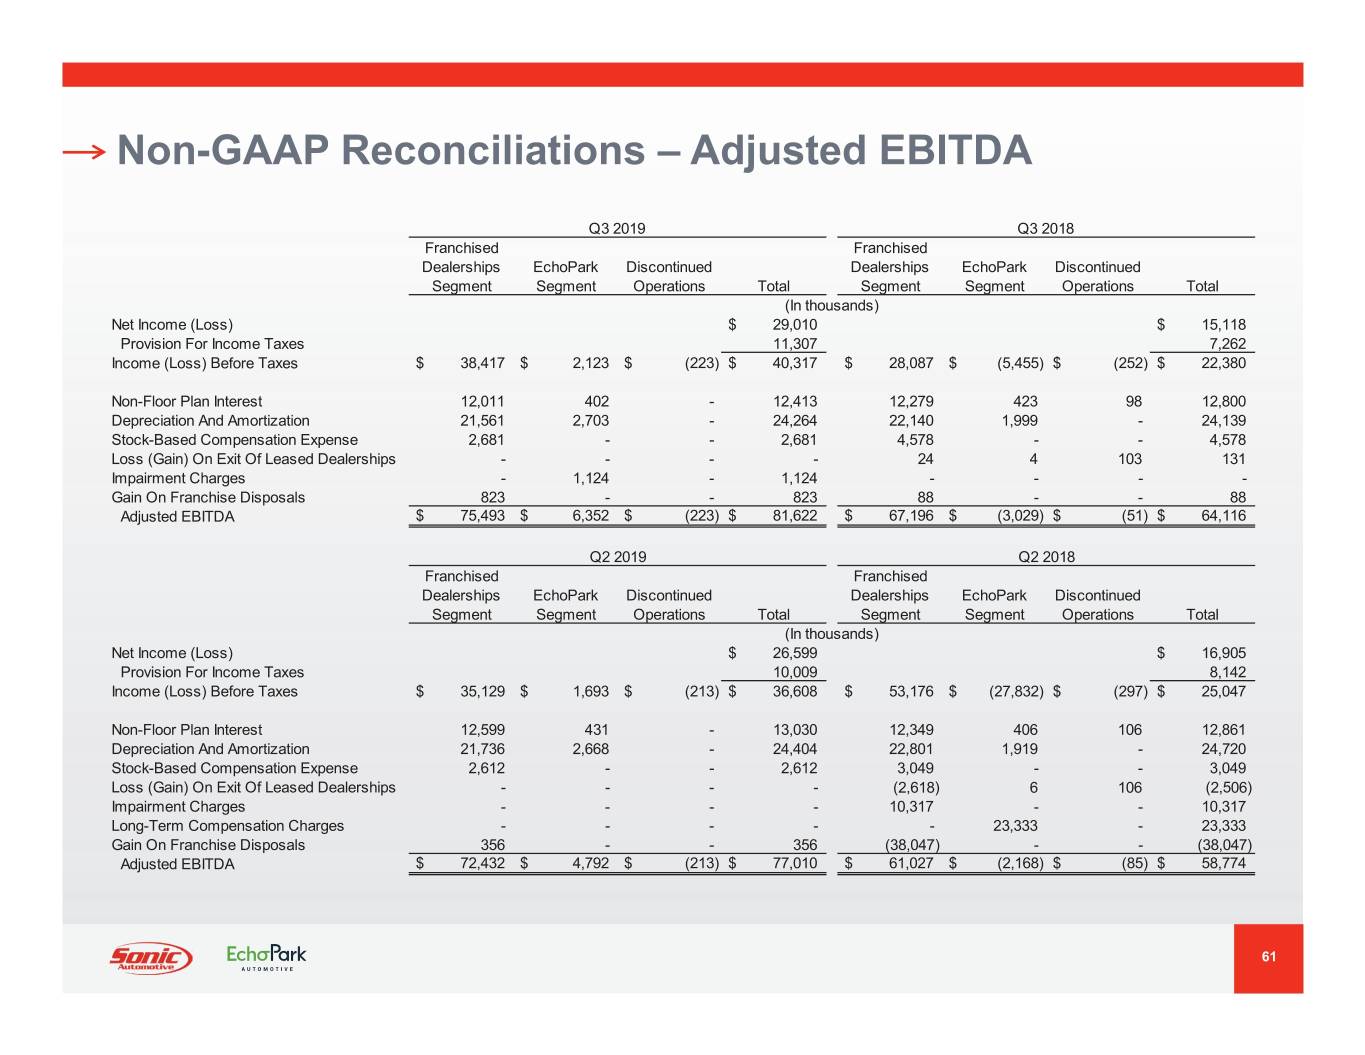
Non-GAAP Reconciliations – Adjusted EBITDA Q3 2019 Q3 2018 Franchised Franchised Dealerships EchoPark Discontinued Dealerships EchoPark Discontinued Segment Segment Operations Total Segment Segment Operations Total (In thousands) Net Income (Loss) $ 29,010 $ 15,118 Provision For Income Taxes 11,307 7,262 Income (Loss) Before Taxes $ 38,417 $ 2,123 $ (223) $ 40,317 $ 28,087 $ (5,455) $ (252) $ 22,380 Non-Floor Plan Interest 12,011 402 - 12,413 12,279 423 98 12,800 Depreciation And Amortization 21,561 2,703 - 24,264 22,140 1,999 - 24,139 Stock-Based Compensation Expense 2,681 - - 2,681 4,578 - - 4,578 Loss (Gain) On Exit Of Leased Dealerships - - - - 24 4 103 131 Impairment Charges - 1,124 - 1,124 - - - - Gain On Franchise Disposals 823 - - 823 88 - - 88 Adjusted EBITDA $ 75,493 $ 6,352 $ (223) $ 81,622 $ 67,196 $ (3,029) $ (51) $ 64,116 Q2 2019 Q2 2018 Franchised Franchised Dealerships EchoPark Discontinued Dealerships EchoPark Discontinued Segment Segment Operations Total Segment Segment Operations Total (In thousands) Net Income (Loss) $ 26,599 $ 16,905 Provision For Income Taxes 10,009 8,142 Income (Loss) Before Taxes $ 35,129 $ 1,693 $ (213) $ 36,608 $ 53,176 $ (27,832) $ (297) $ 25,047 Non-Floor Plan Interest 12,599 431 - 13,030 12,349 406 106 12,861 Depreciation And Amortization 21,736 2,668 - 24,404 22,801 1,919 - 24,720 Stock-Based Compensation Expense 2,612 - - 2,612 3,049 - - 3,049 Loss (Gain) On Exit Of Leased Dealerships - - - - (2,618) 6 106 (2,506) Impairment Charges - - - - 10,317 - - 10,317 Long-Term Compensation Charges - - - - - 23,333 - 23,333 Gain On Franchise Disposals 356 - - 356 (38,047) - - (38,047) Adjusted EBITDA $ 72,432 $ 4,792 $ (213) $ 77,010 $ 61,027 $ (2,168) $ (85) $ 58,774 61
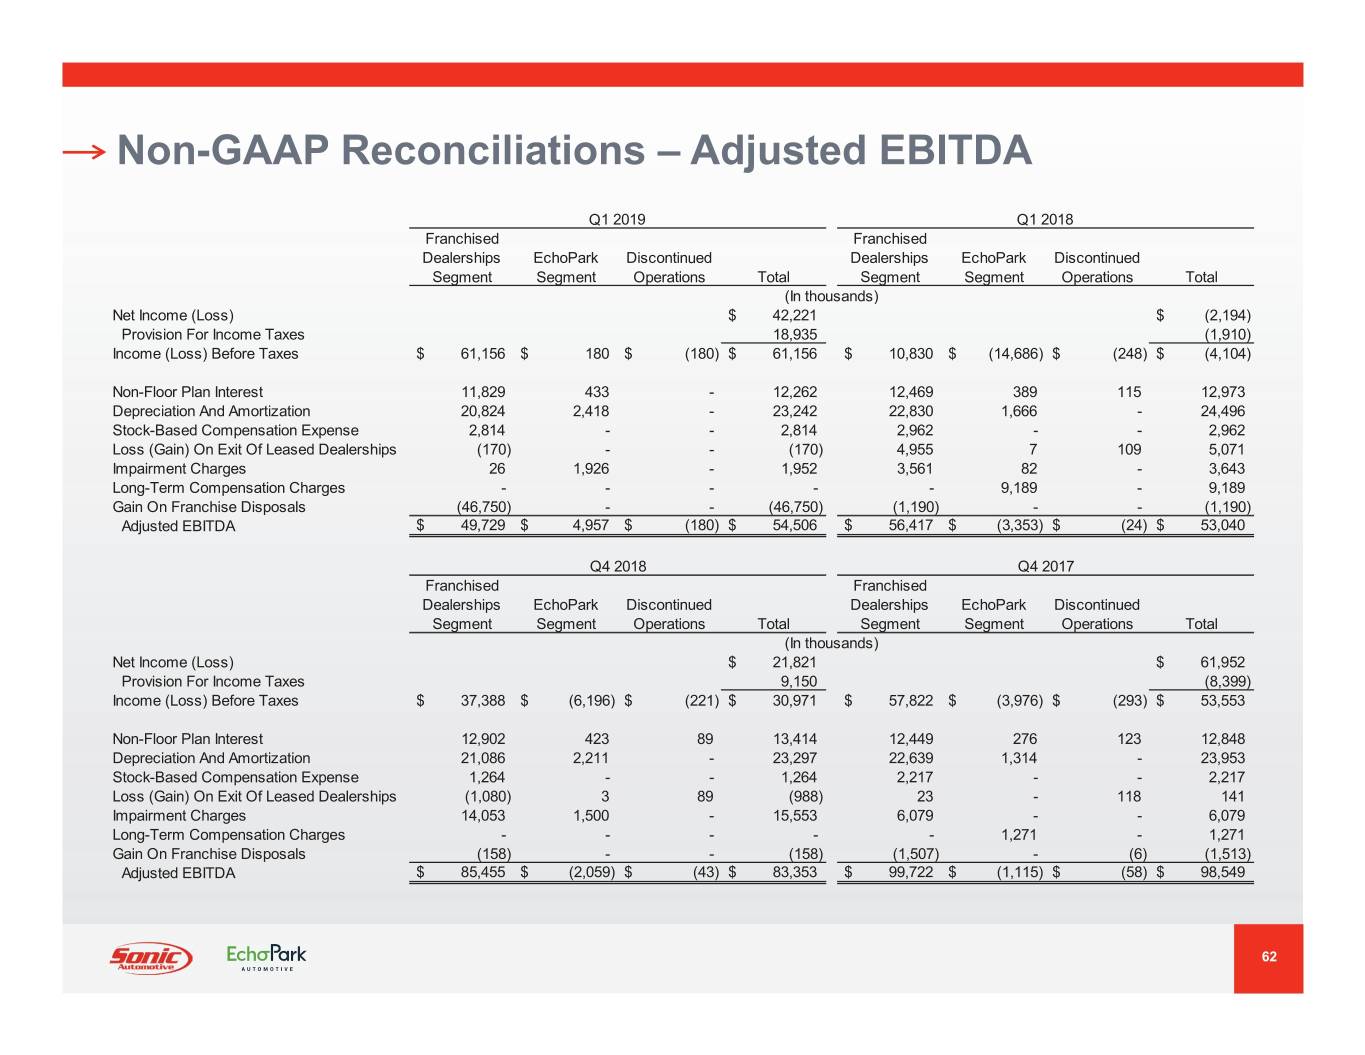
Non-GAAP Reconciliations – Adjusted EBITDA Q1 2019 Q1 2018 Franchised Franchised Dealerships EchoPark Discontinued Dealerships EchoPark Discontinued Segment Segment Operations Total Segment Segment Operations Total (In thousands) Net Income (Loss) $ 42,221 $ (2,194) Provision For Income Taxes 18,935 (1,910) Income (Loss) Before Taxes $ 61,156 $ 180 $ (180) $ 61,156 $ 10,830 $ (14,686) $ (248) $ (4,104) Non-Floor Plan Interest 11,829 433 - 12,262 12,469 389 115 12,973 Depreciation And Amortization 20,824 2,418 - 23,242 22,830 1,666 - 24,496 Stock-Based Compensation Expense 2,814 - - 2,814 2,962 - - 2,962 Loss (Gain) On Exit Of Leased Dealerships (170) - - (170) 4,955 7 109 5,071 Impairment Charges 26 1,926 - 1,952 3,561 82 - 3,643 Long-Term Compensation Charges - - - - - 9,189 - 9,189 Gain On Franchise Disposals (46,750) - - (46,750) (1,190) - - (1,190) Adjusted EBITDA $ 49,729 $ 4,957 $ (180) $ 54,506 $ 56,417 $ (3,353) $ (24) $ 53,040 Q4 2018 Q4 2017 Franchised Franchised Dealerships EchoPark Discontinued Dealerships EchoPark Discontinued Segment Segment Operations Total Segment Segment Operations Total (In thousands) Net Income (Loss) $ 21,821 $ 61,952 Provision For Income Taxes 9,150 (8,399) Income (Loss) Before Taxes $ 37,388 $ (6,196) $ (221) $ 30,971 $ 57,822 $ (3,976) $ (293) $ 53,553 Non-Floor Plan Interest 12,902 423 89 13,414 12,449 276 123 12,848 Depreciation And Amortization 21,086 2,211 - 23,297 22,639 1,314 - 23,953 Stock-Based Compensation Expense 1,264 - - 1,264 2,217 - - 2,217 Loss (Gain) On Exit Of Leased Dealerships (1,080) 3 89 (988) 23 - 118 141 Impairment Charges 14,053 1,500 - 15,553 6,079 - - 6,079 Long-Term Compensation Charges - - - - - 1,271 - 1,271 Gain On Franchise Disposals (158) - - (158) (1,507) - (6) (1,513) Adjusted EBITDA $ 85,455 $ (2,059) $ (43) $ 83,353 $ 99,722 $ (1,115) $ (58) $ 98,549 62
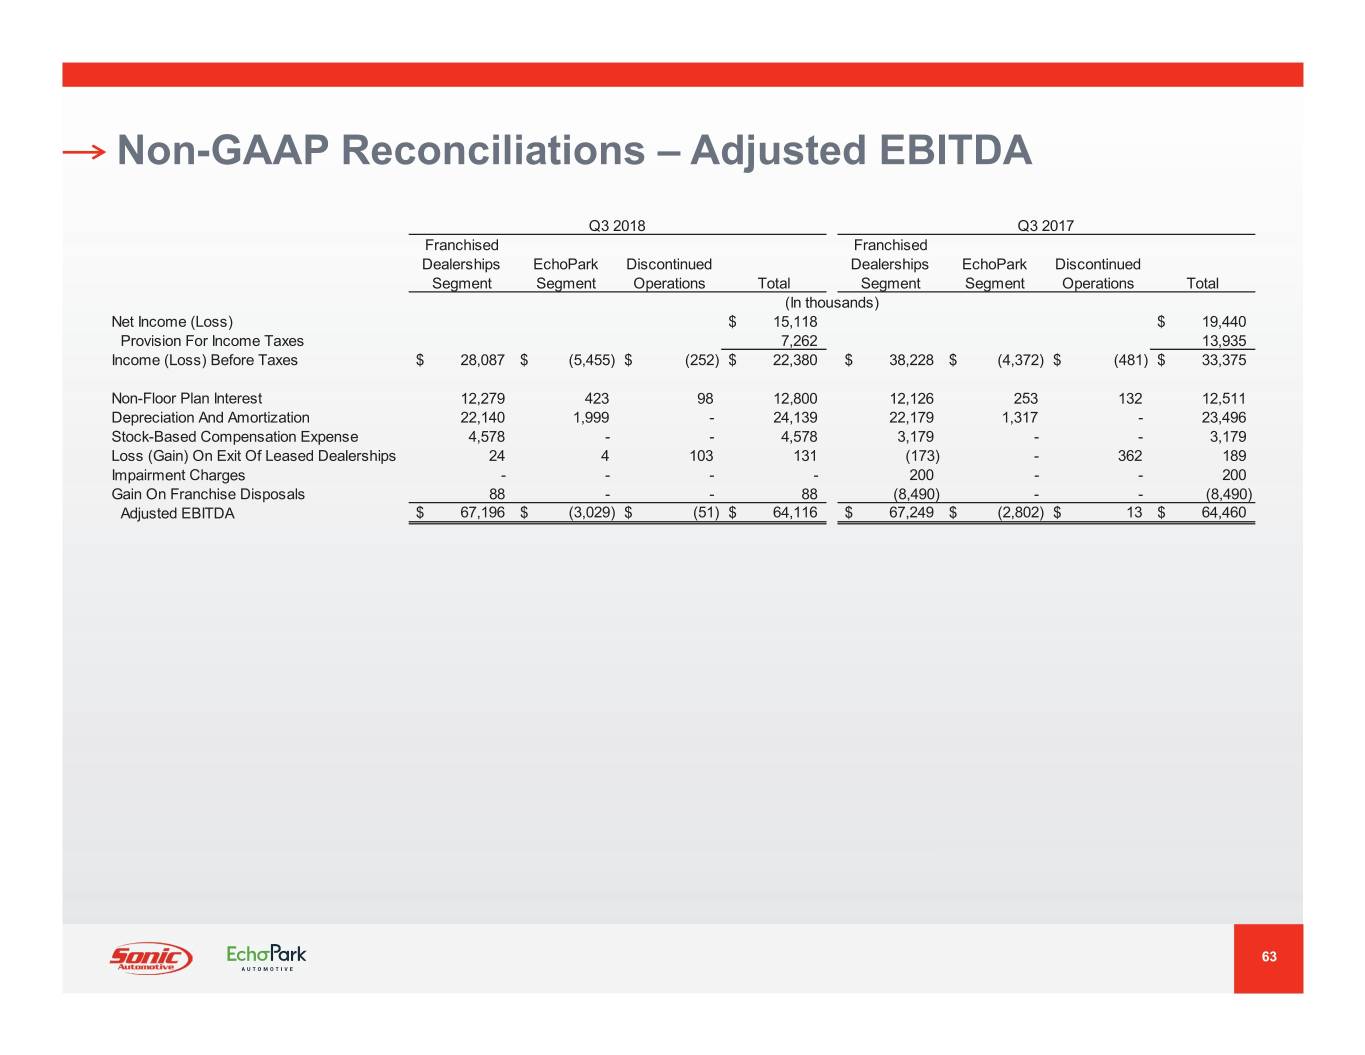
Non-GAAP Reconciliations – Adjusted EBITDA Q3 2018 Q3 2017 Franchised Franchised Dealerships EchoPark Discontinued Dealerships EchoPark Discontinued Segment Segment Operations Total Segment Segment Operations Total (In thousands) Net Income (Loss) $ 15,118 $ 19,440 Provision For Income Taxes 7,262 13,935 Income (Loss) Before Taxes $ 28,087 $ (5,455) $ (252) $ 22,380 $ 38,228 $ (4,372) $ (481) $ 33,375 Non-Floor Plan Interest 12,279 423 98 12,800 12,126 253 132 12,511 Depreciation And Amortization 22,140 1,999 - 24,139 22,179 1,317 - 23,496 Stock-Based Compensation Expense 4,578 - - 4,578 3,179 - - 3,179 Loss (Gain) On Exit Of Leased Dealerships 24 4 103 131 (173) - 362 189 Impairment Charges - - - - 200 - - 200 Gain On Franchise Disposals 88 - - 88 (8,490) - - (8,490) Adjusted EBITDA $ 67,196 $ (3,029) $ (51) $ 64,116 $ 67,249 $ (2,802) $ 13 $ 64,460 63

Investor Relations Contact: Sonic Automotive Inc. (NYSE: SAH) Danny Wieland, Director of Financial Reporting ir@sonicautomotive.com (704) 927-3462