
Sonic Automotive Investor Presentation Third Quarter 2023 Updated October 26, 2023 Exhibit 99.2
2 Forward-Looking Statements This presentation contains “forward-looking statements” within the meaning of the Private Securities Litigation Reform Act of 1995. These statements relate to future events, are not historical facts and are based on our current expectations and assumptions regarding our business, the economy and other future conditions. These statements can generally be identified by lead-in words such as “may,” “will,” “should,” “could,” “believe,” “expect,” “estimate,” “anticipate,” “intend,” “plan,” “project,” “foresee” and other similar words or phrases. Statements that describe our Company’s objectives, plans or goals are also forward-looking statements. Examples of such forward- looking information we may be discussing in this presentation include, without limitation, our anticipated future new vehicle unit sales volume, revenues and profitability, our anticipated future used vehicle unit sales volume, revenues and profitability, future levels of consumer demand for new and used vehicles, our anticipated future parts, service and collision repair (“Fixed Operations”) gross profit, our anticipated expense reductions, long-term annual revenue and profitability targets, anticipated future growth capital expenditures, profitability and pricing expectations in our EchoPark Segment, EchoPark’s omnichannel strategy, anticipated future EchoPark population coverage, anticipated future EchoPark revenue and unit sales volume, anticipated future performance and growth of our Franchised Dealerships Segment, anticipated growth of our Powersports Segment, anticipated liquidity positions, anticipated industry new vehicle sales volume, the implementation of growth and operating strategies, including acquisitions of dealerships and properties, anticipated future acquisition synergies, the return of capital to stockholders, anticipated future success and impacts from the implementation of our strategic initiatives, and earnings per share expectations. You are cautioned that these forward-looking statements are not guarantees of future performance, involve risks and uncertainties and actual results may differ materially from those projected in the forward-looking statements as a result of various factors. These risks and uncertainties include, without limitation, economic conditions in the markets in which we operate, supply chain disruptions and manufacturing delays, labor shortages, the impacts of inflation and increases in interest rates, new and used vehicle industry sales volume, the success of our operational strategies, the rate and timing of overall economic expansion or contraction, and the risk factors described in the Company’s Annual Report on Form 10-K for the year ended December 31, 2022 and other reports and information filed with the United States Securities and Exchange Commission (the “SEC”). These forward-looking statements, risks, uncertainties and additional factors speak only as of the date of this presentation. We undertake no obligation to update any such statements, except as required under federal securities laws and the rules and regulations of the SEC.

3 Company Overview
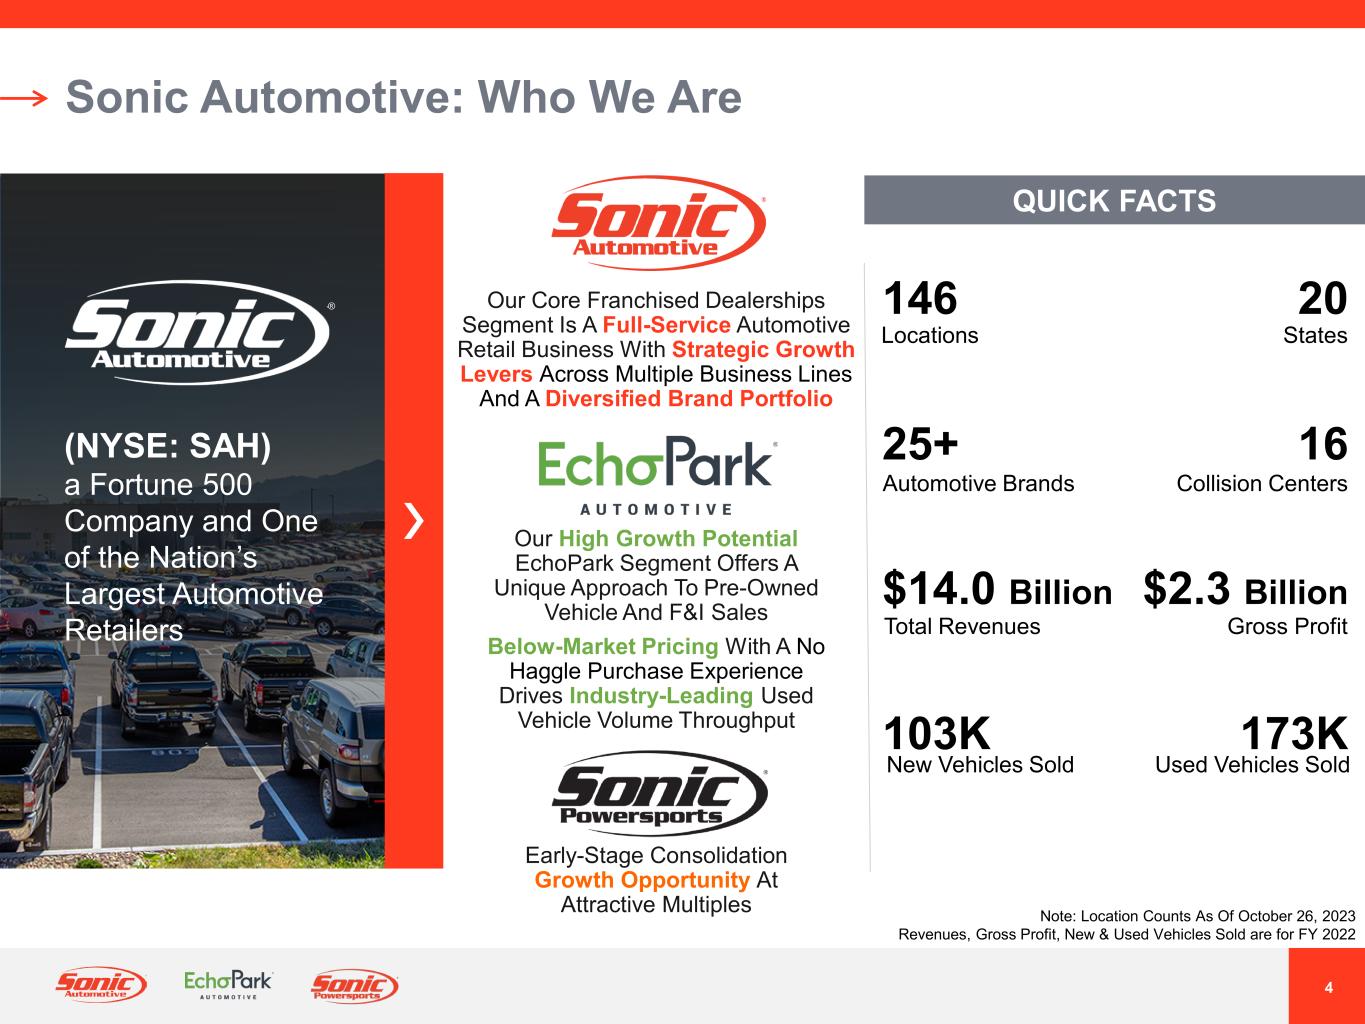
4 ® Sonic Automotive: Who We Are QUICK FACTS (NYSE: SAH) a Fortune 500 Company and One of the Nation’s Largest Automotive Retailers 146 25+ 20 16 $14.0 Billion $2.3 Billion 103K New Vehicles Sold 173K Total Revenues Automotive Brands Locations Used Vehicles Sold Collision Centers States Gross Profit Note: Location Counts As Of October 26, 2023 Revenues, Gross Profit, New & Used Vehicles Sold are for FY 2022 Our Core Franchised Dealerships Segment Is A Full-Service Automotive Retail Business With Strategic Growth Levers Across Multiple Business Lines And A Diversified Brand Portfolio Our High Growth Potential EchoPark Segment Offers A Unique Approach To Pre-Owned Vehicle And F&I Sales Below-Market Pricing With A No Haggle Purchase Experience Drives Industry-Leading Used Vehicle Volume Throughput Early-Stage Consolidation Growth Opportunity At Attractive Multiples
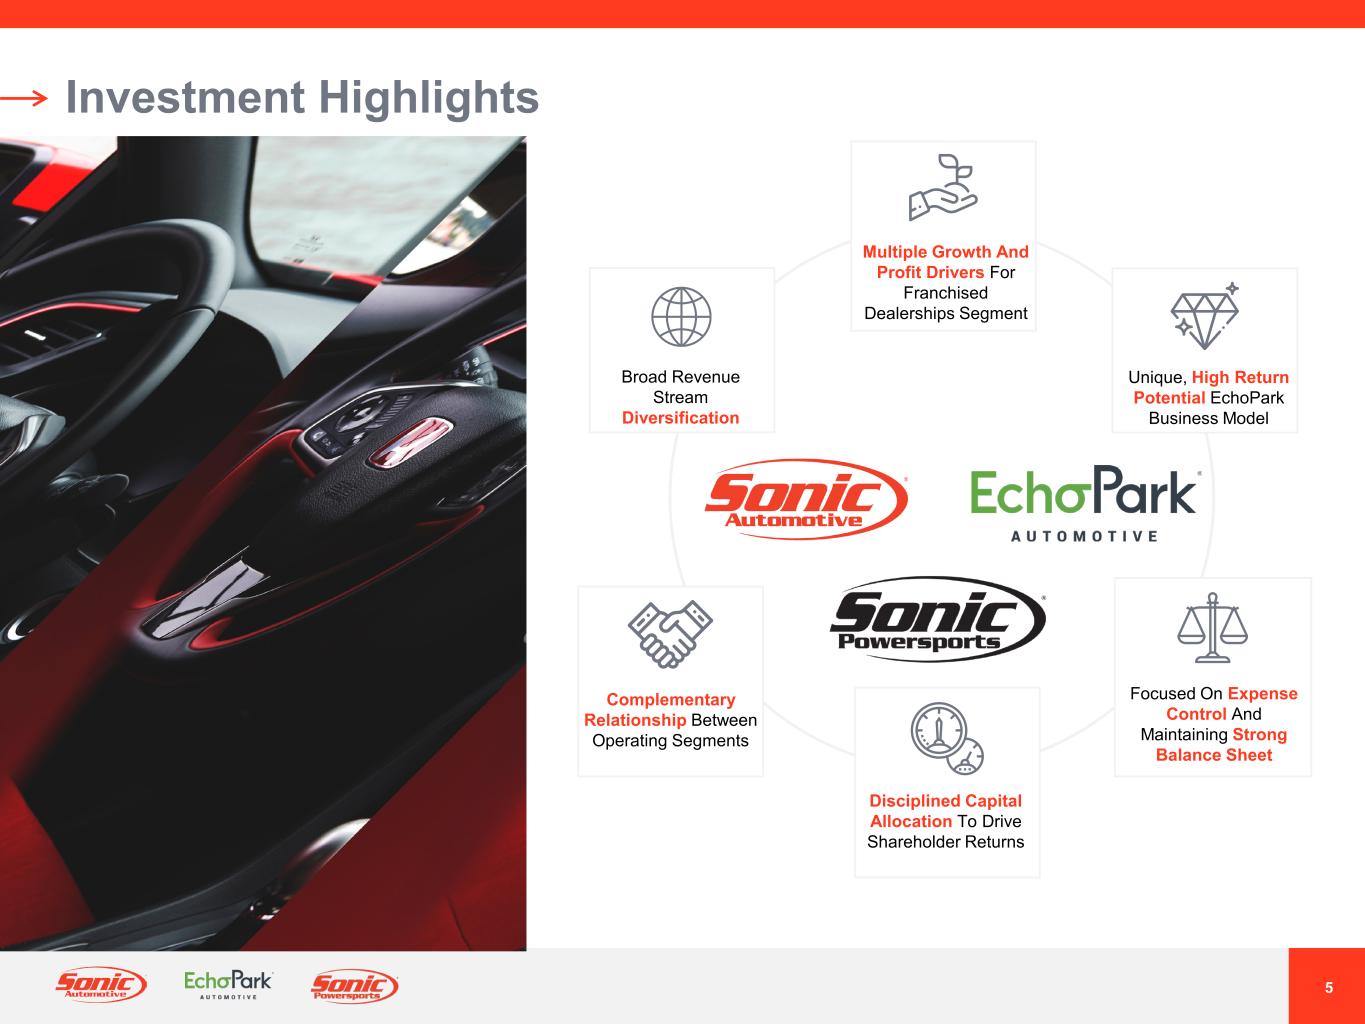
5 Investment Highlights Multiple Growth And Profit Drivers For Franchised Dealerships Segment Unique, High Return Potential EchoPark Business Model Broad Revenue Stream Diversification Complementary Relationship Between Operating Segments Disciplined Capital Allocation To Drive Shareholder Returns Focused On Expense Control And Maintaining Strong Balance Sheet
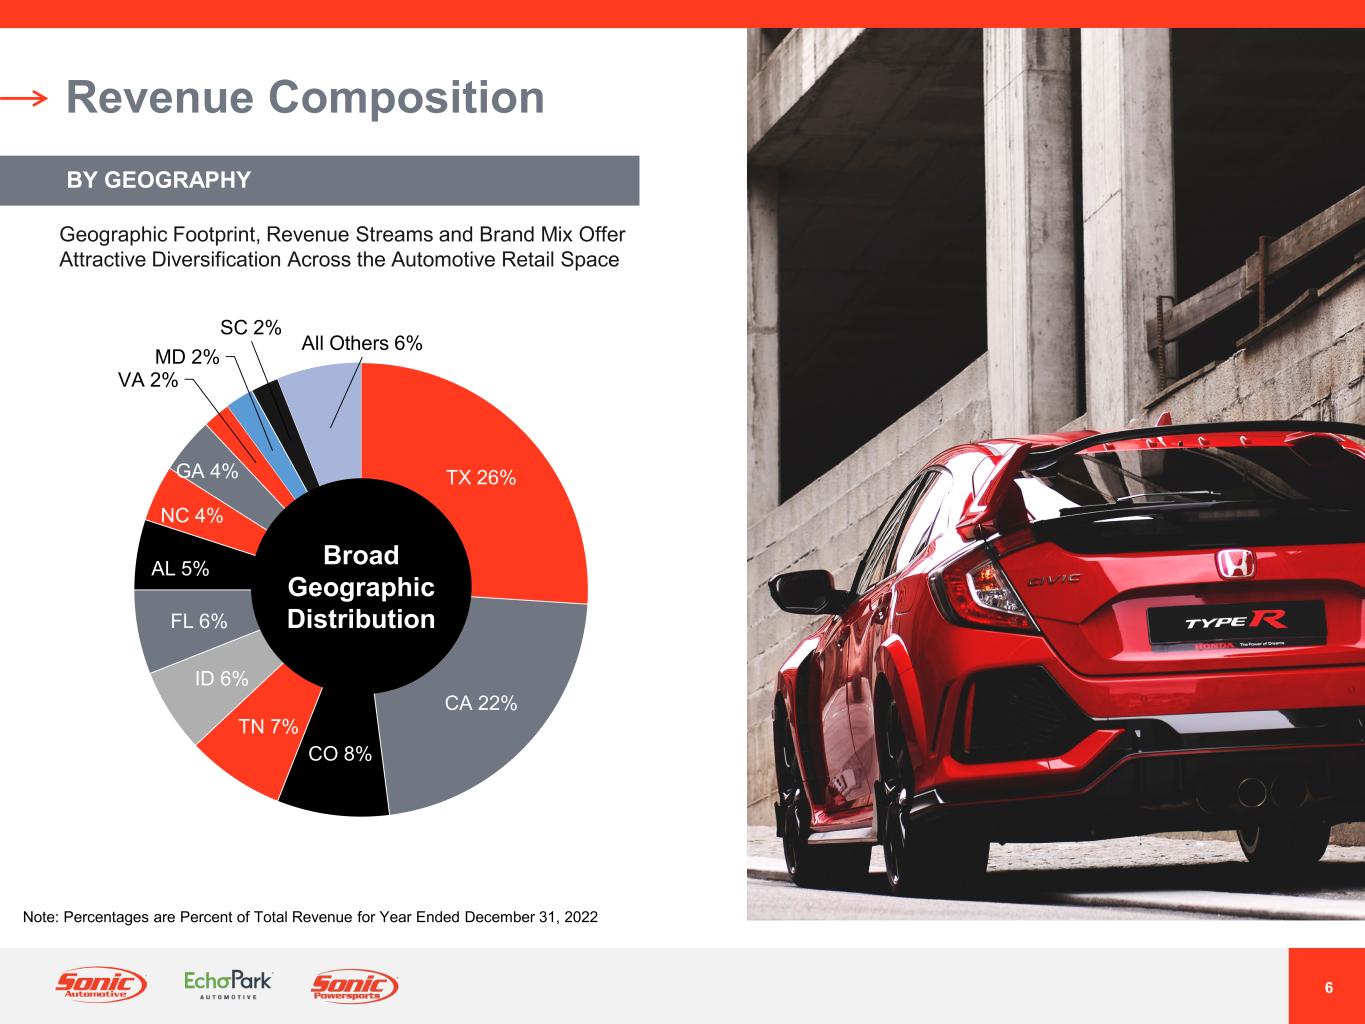
6 Revenue Composition BY GEOGRAPHY TX 26% CA 22% CO 8% TN 7% ID 6% FL 6% AL 5% NC 4% GA 4% VA 2% MD 2% SC 2% All Others 6% Broad Geographic Distribution Geographic Footprint, Revenue Streams and Brand Mix Offer Attractive Diversification Across the Automotive Retail Space Note: Percentages are Percent of Total Revenue for Year Ended December 31, 2022
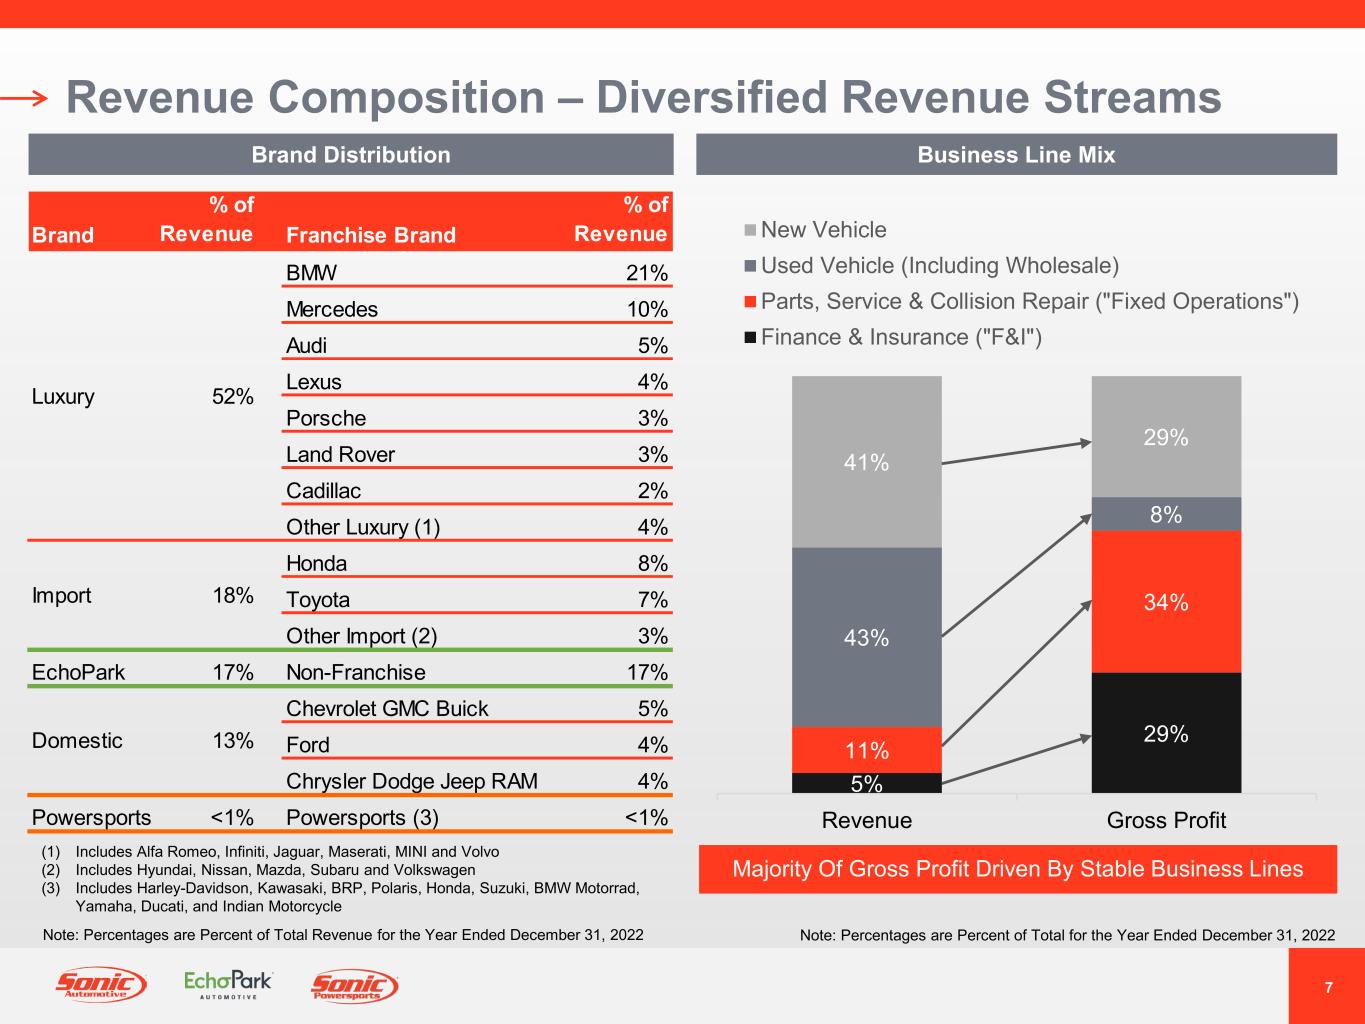
7 Revenue Composition – Diversified Revenue Streams Note: Percentages are Percent of Total for the Year Ended December 31, 2022 5% 29% 11% 34% 43% 8% 41% 29% Revenue Gross Profit New Vehicle Used Vehicle (Including Wholesale) Parts, Service & Collision Repair ("Fixed Operations") Finance & Insurance ("F&I") Brand Distribution Note: Percentages are Percent of Total Revenue for the Year Ended December 31, 2022 Brand % of Revenue Franchise Brand % of Revenue BMW 21% Mercedes 10% Audi 5% Lexus 4% Porsche 3% Land Rover 3% Cadillac 2% Other Luxury (1) 4% Honda 8% Toyota 7% Other Import (2) 3% EchoPark 17% Non-Franchise 17% Chevrolet GMC Buick 5% Ford 4% Chrysler Dodge Jeep RAM 4% Powersports <1% Powersports (3) <1% Luxury 52% 18%Import Domestic 13% (1) Includes Alfa Romeo, Infiniti, Jaguar, Maserati, MINI and Volvo (2) Includes Hyundai, Nissan, Mazda, Subaru and Volkswagen (3) Includes Harley-Davidson, Kawasaki, BRP, Polaris, Honda, Suzuki, BMW Motorrad, Yamaha, Ducati, and Indian Motorcycle Business Line Mix Majority Of Gross Profit Driven By Stable Business Lines
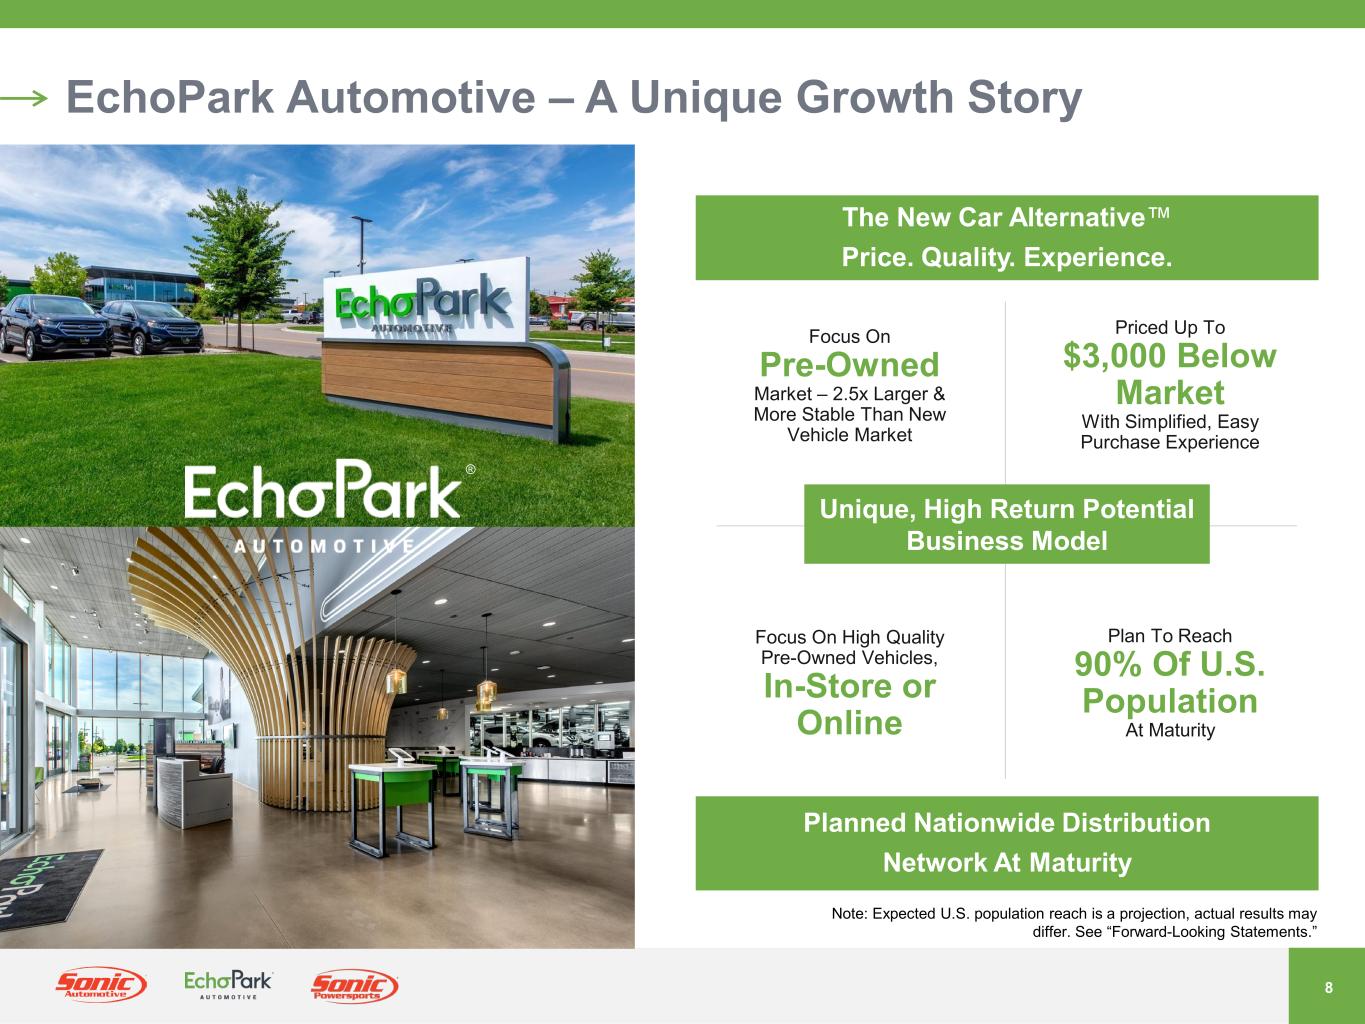
8 ® EchoPark Automotive – A Unique Growth Story Planned Nationwide Distribution Network At Maturity Unique, High Return Potential Business Model Focus On High Quality Pre-Owned Vehicles, In-Store or Online Plan To Reach 90% Of U.S. Population At Maturity Priced Up To $3,000 Below Market With Simplified, Easy Purchase Experience Focus On Pre-Owned Market – 2.5x Larger & More Stable Than New Vehicle Market The New Car Alternative™ Price. Quality. Experience. Note: Expected U.S. population reach is a projection, actual results may differ. See “Forward-Looking Statements.”
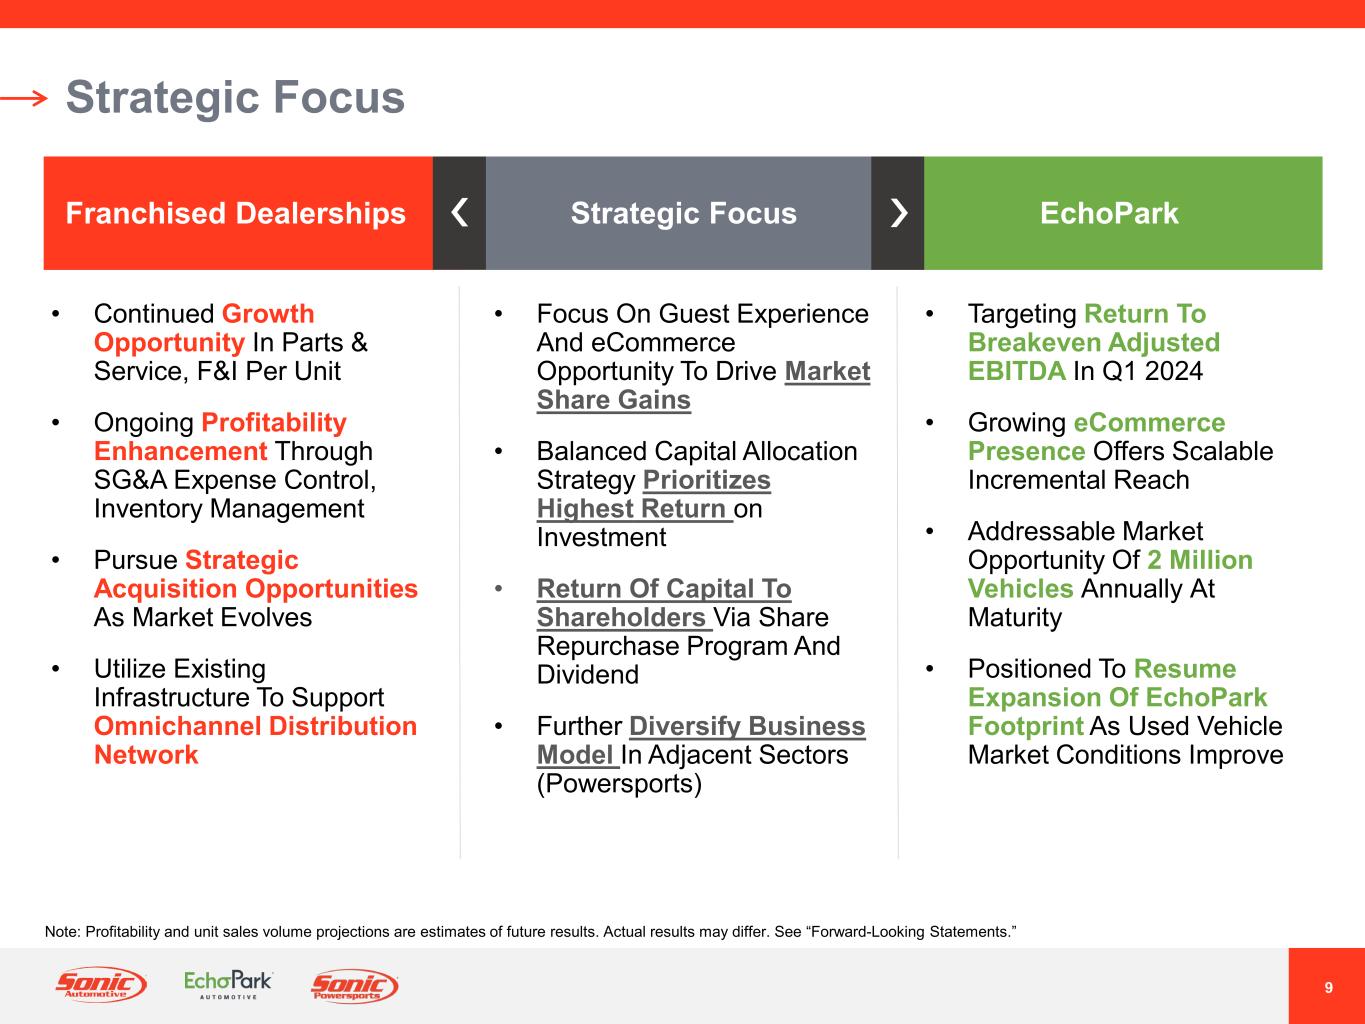
9 Strategic Focus • Continued Growth Opportunity In Parts & Service, F&I Per Unit • Ongoing Profitability Enhancement Through SG&A Expense Control, Inventory Management • Pursue Strategic Acquisition Opportunities As Market Evolves • Utilize Existing Infrastructure To Support Omnichannel Distribution Network • Targeting Return To Breakeven Adjusted EBITDA In Q1 2024 • Growing eCommerce Presence Offers Scalable Incremental Reach • Addressable Market Opportunity Of 2 Million Vehicles Annually At Maturity • Positioned To Resume Expansion Of EchoPark Footprint As Used Vehicle Market Conditions Improve • Focus On Guest Experience And eCommerce Opportunity To Drive Market Share Gains • Balanced Capital Allocation Strategy Prioritizes Highest Return on Investment • Return Of Capital To Shareholders Via Share Repurchase Program And Dividend • Further Diversify Business Model In Adjacent Sectors (Powersports) Franchised Dealerships EchoParkStrategic Focus Note: Profitability and unit sales volume projections are estimates of future results. Actual results may differ. See “Forward-Looking Statements.”
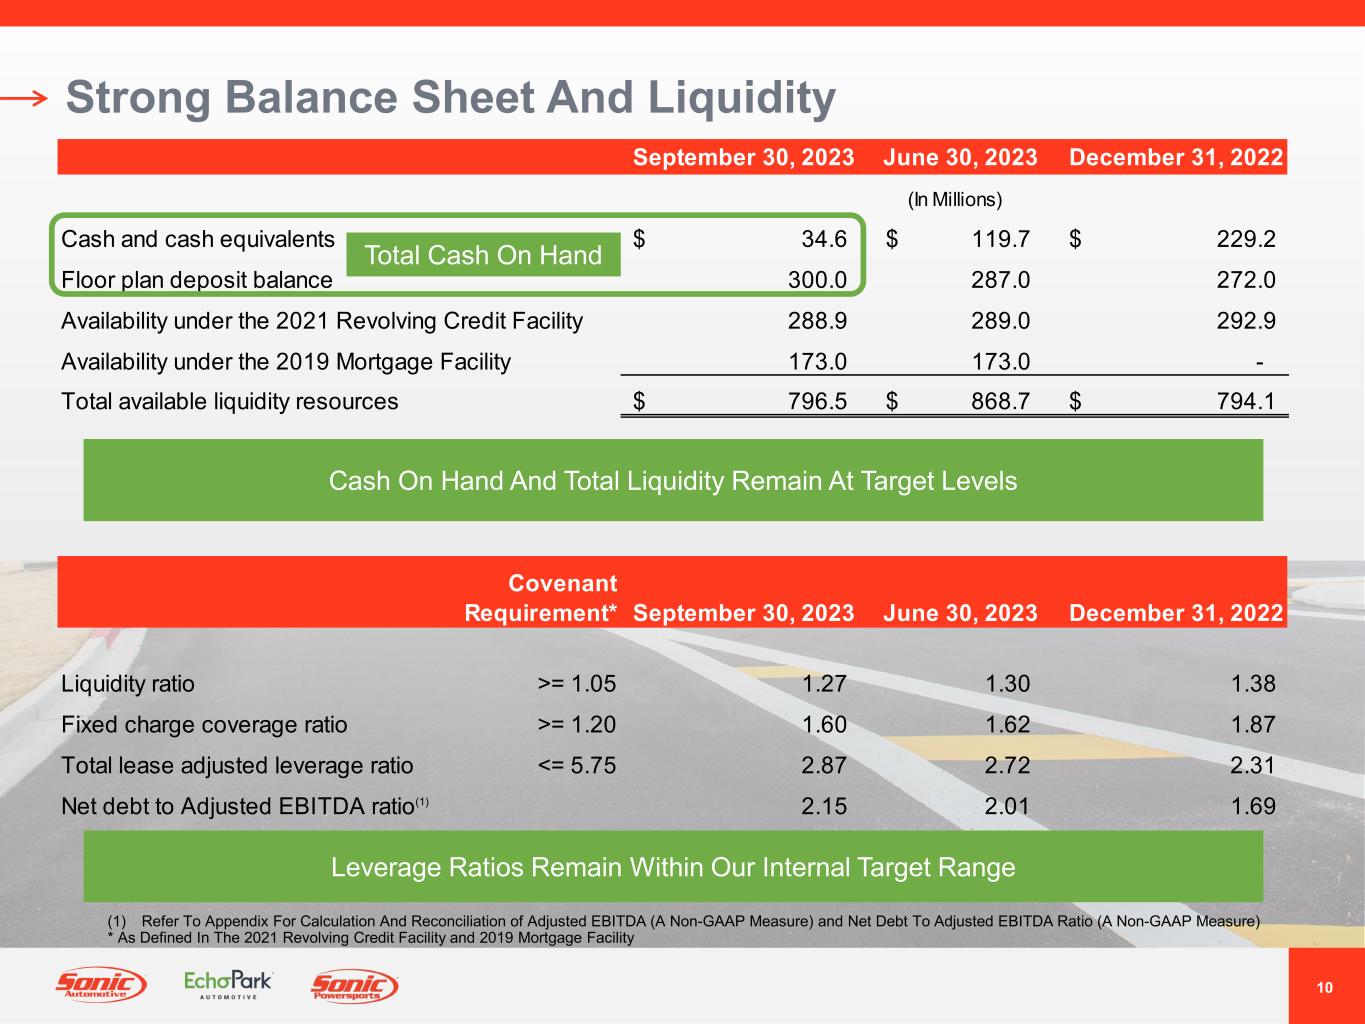
10 Strong Balance Sheet And Liquidity September 30, 2023 June 30, 2023 December 31, 2022 (In Millions) Cash and cash equivalents 34.6$ 119.7$ 229.2$ Floor plan deposit balance 300.0 287.0 272.0 Availability under the 2021 Revolving Credit Facility 288.9 289.0 292.9 Availability under the 2019 Mortgage Facility 173.0 173.0 - Total available liquidity resources 796.5$ 868.7$ 794.1$ Covenant Requirement* September 30, 2023 June 30, 2023 December 31, 2022 Liquidity ratio >= 1.05 1.27 1.30 1.38 Fixed charge coverage ratio >= 1.20 1.60 1.62 1.87 Total lease adjusted leverage ratio <= 5.75 2.87 2.72 2.31 Net debt to Adjusted EBITDA ratio(1) 2.15 2.01 1.69 Cash On Hand And Total Liquidity Remain At Target Levels Leverage Ratios Remain Within Our Internal Target Range Total Cash On Hand (1) Refer To Appendix For Calculation And Reconciliation of Adjusted EBITDA (A Non-GAAP Measure) and Net Debt To Adjusted EBITDA Ratio (A Non-GAAP Measure) * As Defined In The 2021 Revolving Credit Facility and 2019 Mortgage Facility
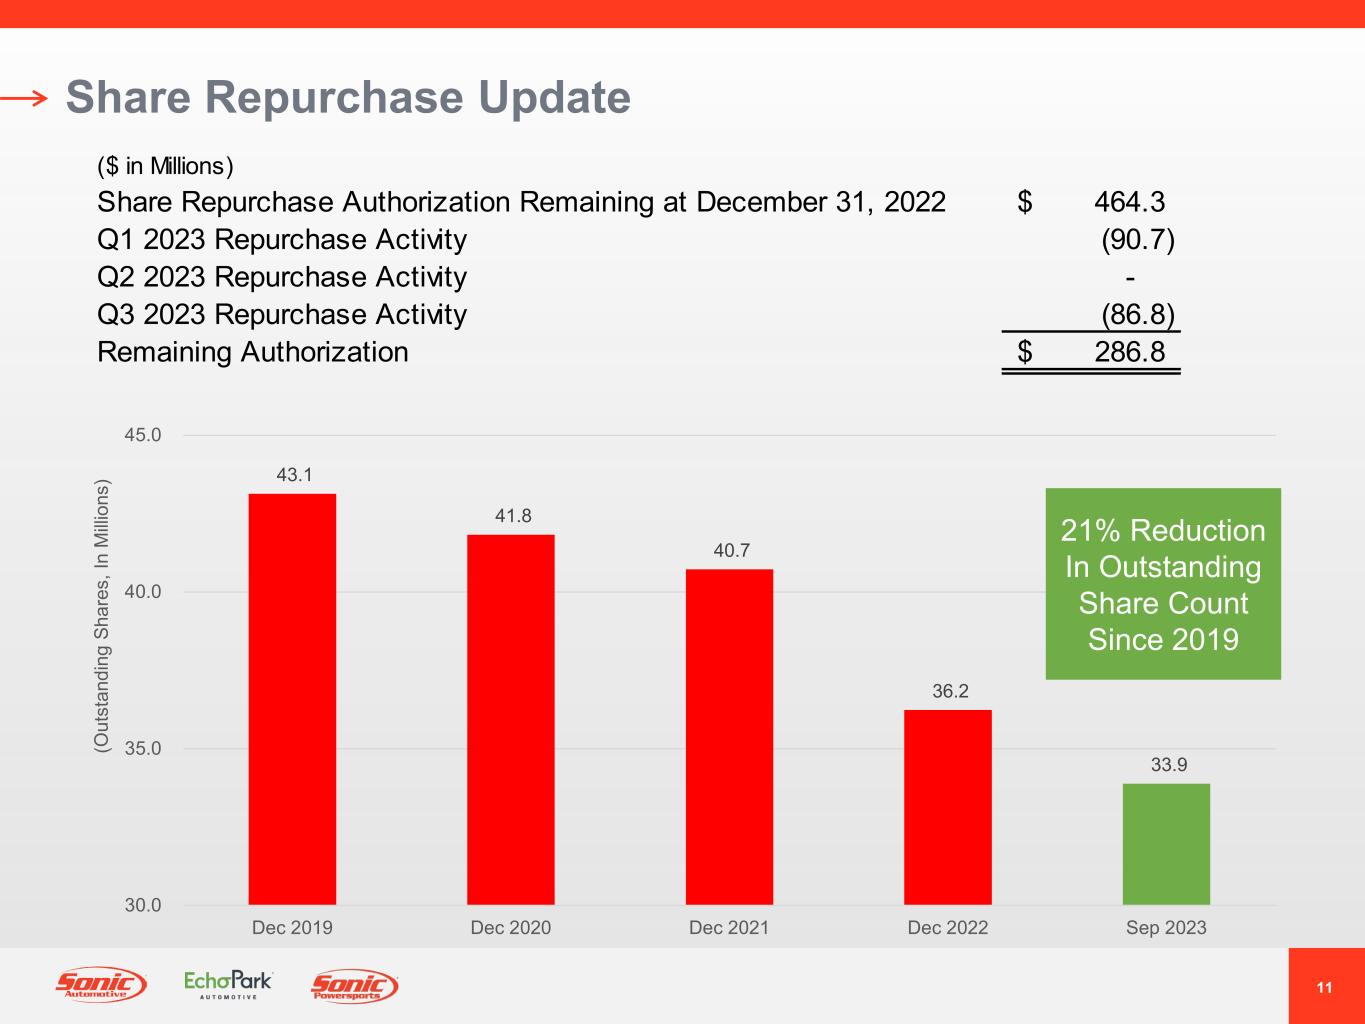
11 Share Repurchase Update ($ in Millions) Share Repurchase Authorization Remaining at December 31, 2022 464.3$ Q1 2023 Repurchase Activity (90.7) Q2 2023 Repurchase Activity - Q3 2023 Repurchase Activity (86.8) Remaining Authorization 286.8$ 43.1 41.8 40.7 36.2 33.9 30.0 35.0 40.0 45.0 Dec 2019 Dec 2020 Dec 2021 Dec 2022 Sep 2023 (O ut st an di ng S ha re s, In M illi on s) 21% Reduction In Outstanding Share Count Since 2019

12 Franchised Dealerships
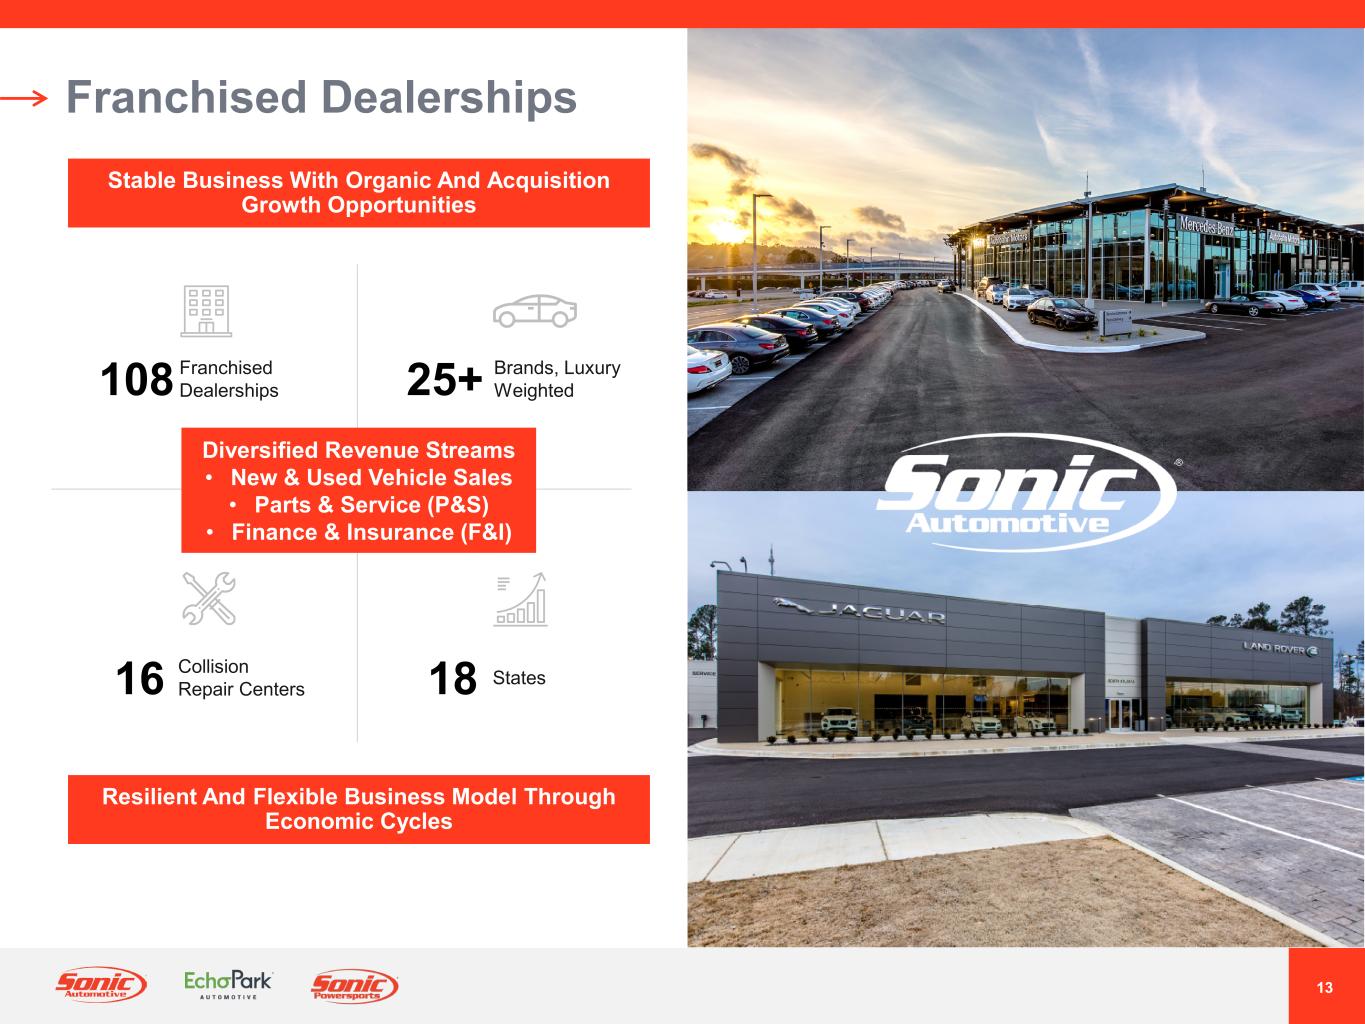
13 New & Used Vehicle Sales Parts & Service (P&S) Finance & Insurance (F&I) ® Franchised Dealerships Franchised Dealerships108 Brands, Luxury Weighted25+ Diversified Revenue Streams • New & Used Vehicle Sales • Parts Service (P S) • Finance & Insurance (F&I) Collision Repair Centers16 18 States Stable Business With Organic And Acquisition Growth Opportunities Resilient And Flexible Business Model Through Economic Cycles
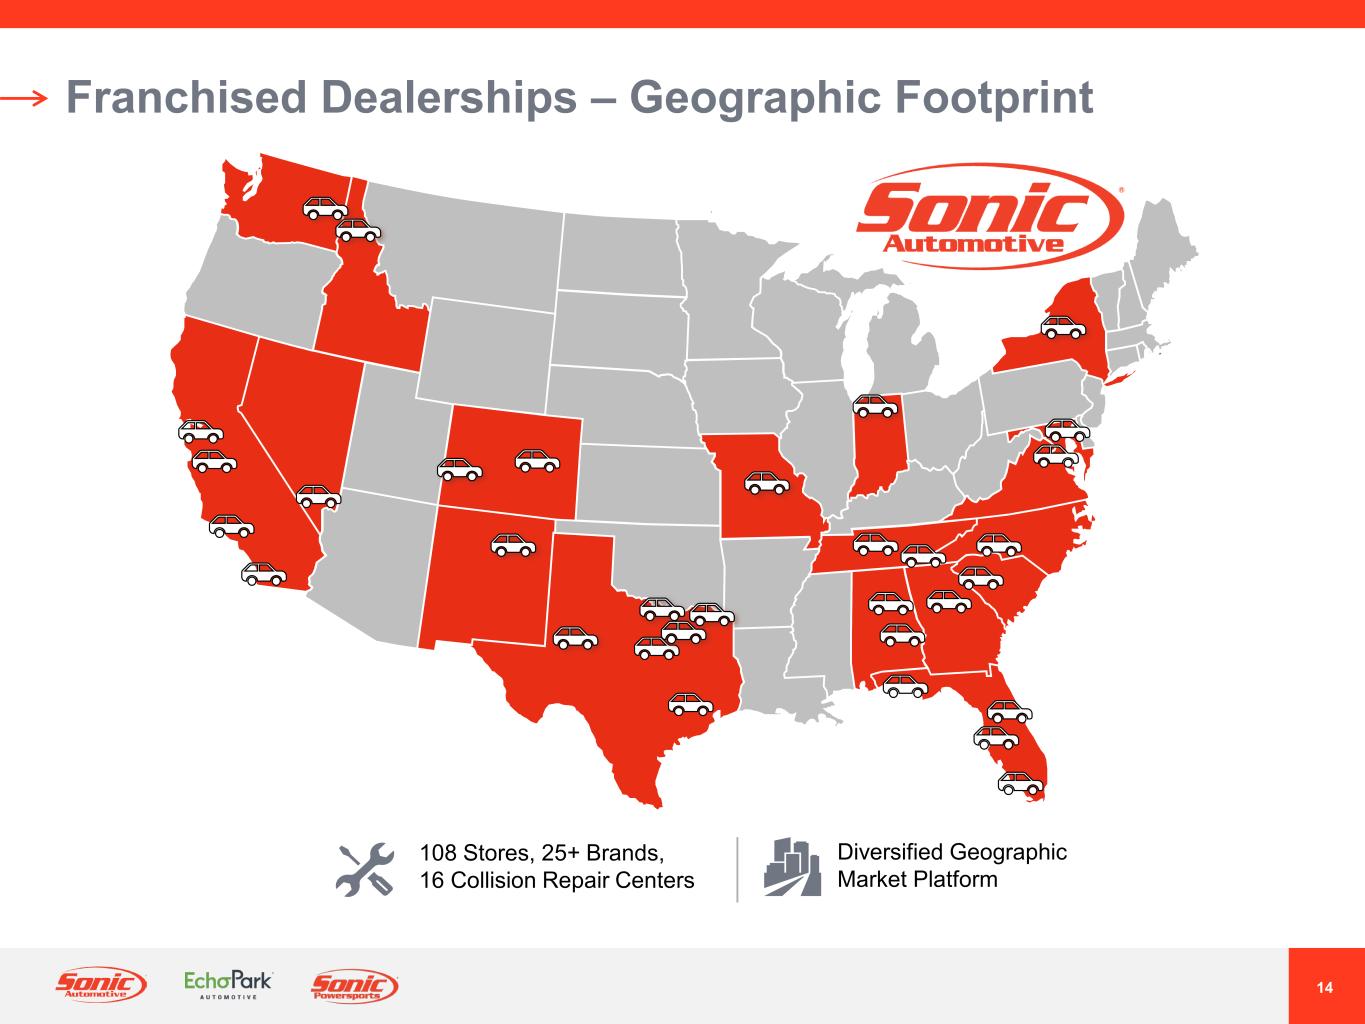
14 Franchised Dealerships – Geographic Footprint Diversified Geographic Market Platform 108 Stores, 25+ Brands, 16 Collision Repair Centers
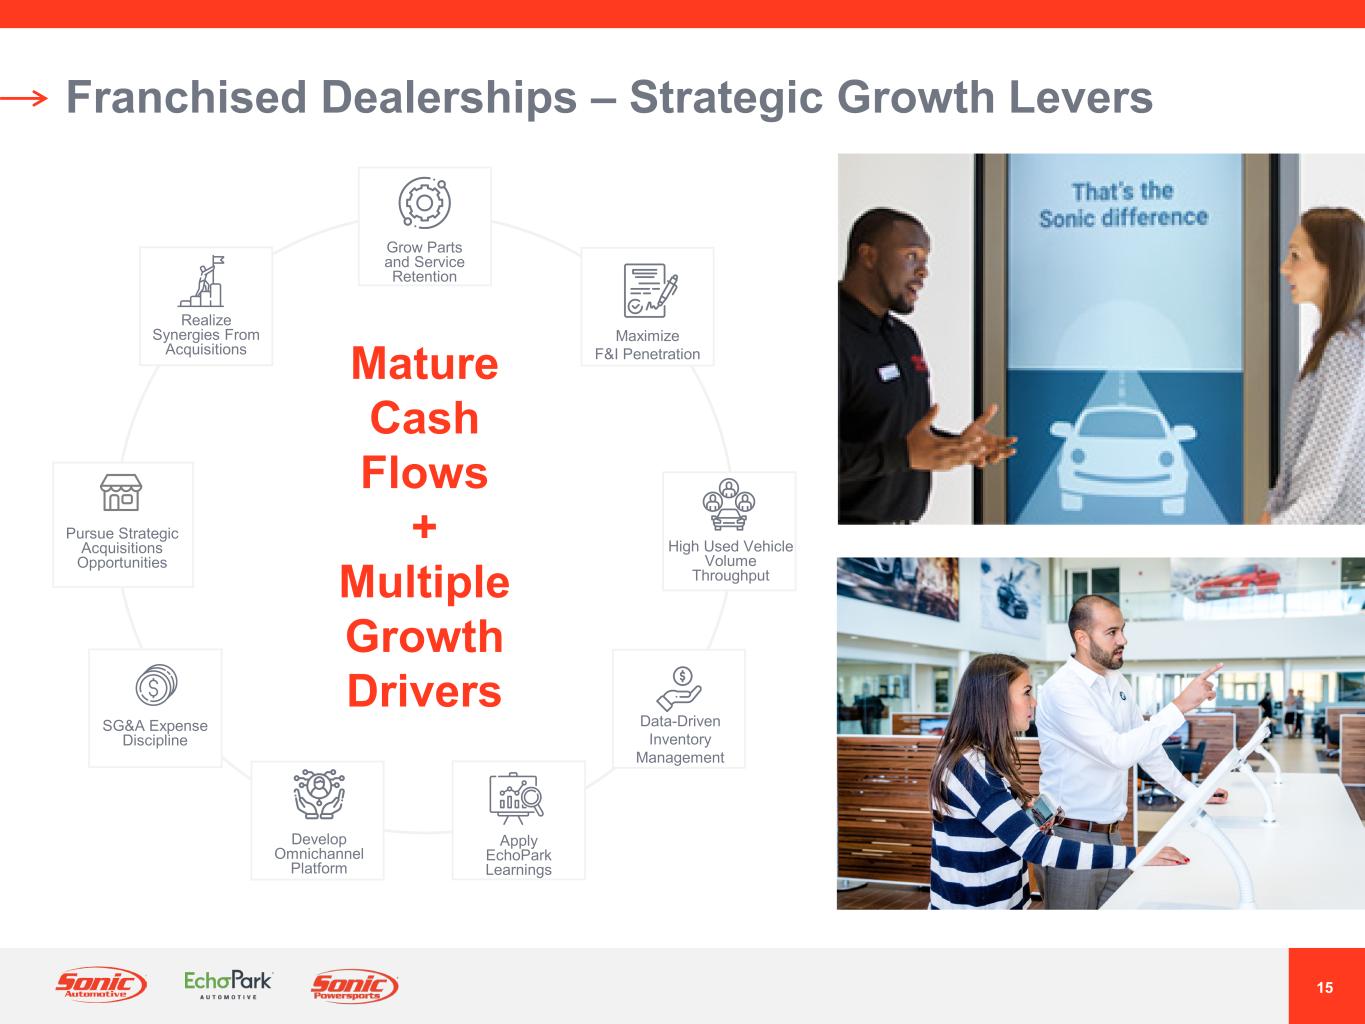
15 Franchised Dealerships – Strategic Growth Levers Mature Cash Flows + Multiple Growth Drivers Pursue Strategic Acquisitions Opportunities Grow Parts and Service Retention Maximize F&I Penetration High Used Vehicle Volume Throughput Data-Driven Inventory Management Apply EchoPark Learnings Develop Omnichannel Platform SG&A Expense Discipline Realize Synergies From Acquisitions

16 EchoPark
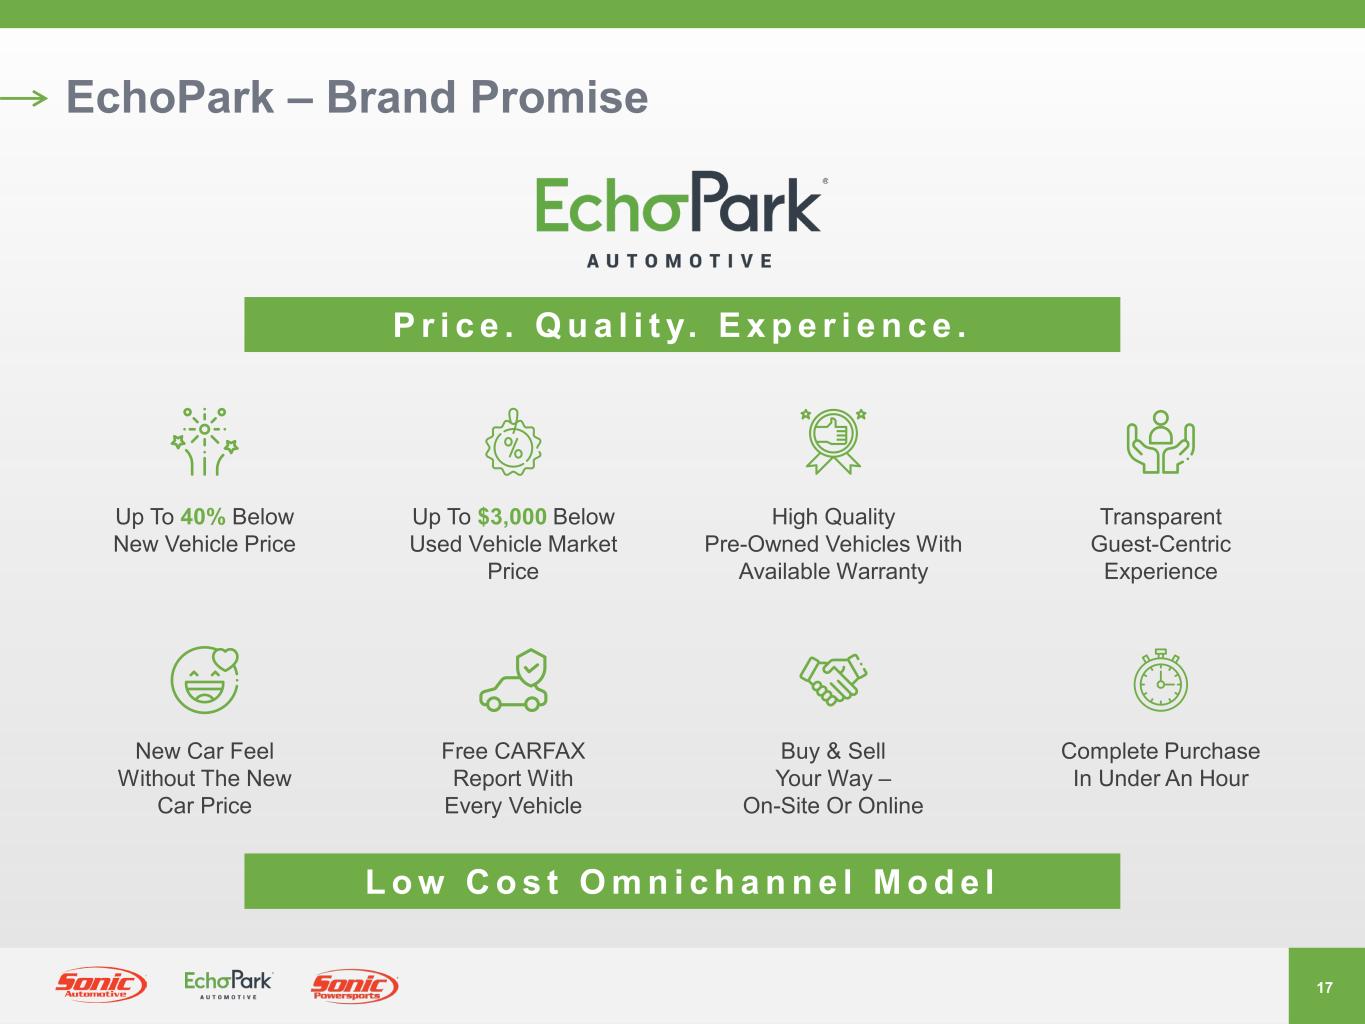
17 EchoPark – Brand Promise Up To 40% Below New Vehicle Price Up To $3,000 Below Used Vehicle Market Price High Quality Pre-Owned Vehicles With Available Warranty Transparent Guest-Centric Experience New Car Feel Without The New Car Price Complete Purchase In Under An Hour Free CARFAX Report With Every Vehicle Buy & Sell Your Way – On-Site Or Online P r i c e . Q u a l i t y. E x p e r i e n c e . L o w C o s t O m n i c h a n n e l M o d e l
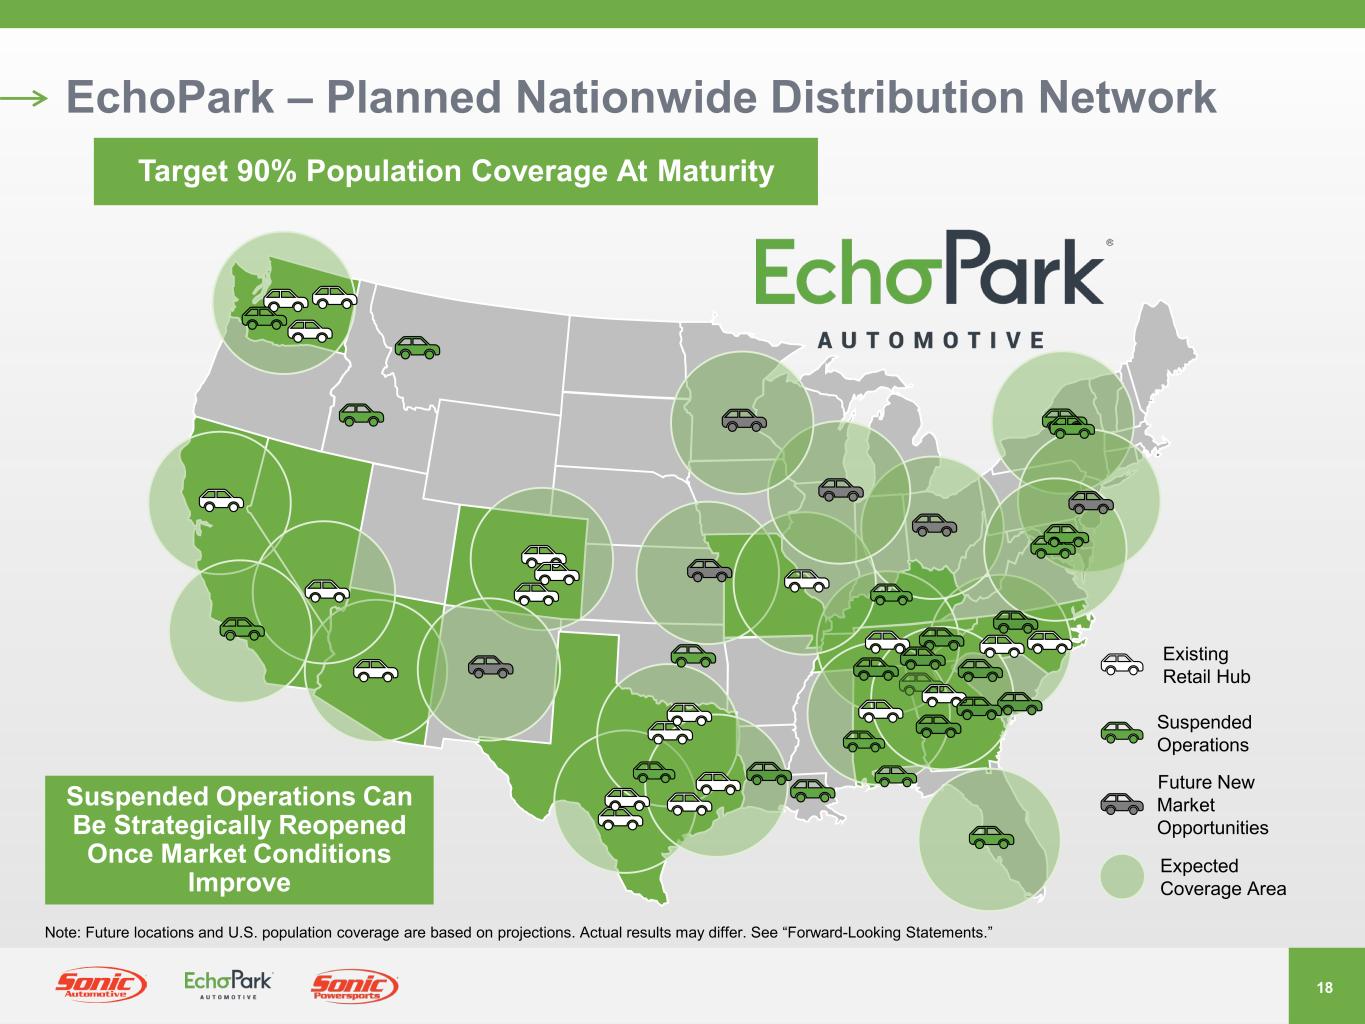
18 EchoPark – Planned Nationwide Distribution Network Target 90% Population Coverage At Maturity Note: Future locations and U.S. population coverage are based on projections. Actual results may differ. See “Forward-Looking Statements.” Suspended Operations Expected Coverage Area Existing Retail Hub Future New Market Opportunities Suspended Operations Can Be Strategically Reopened Once Market Conditions Improve
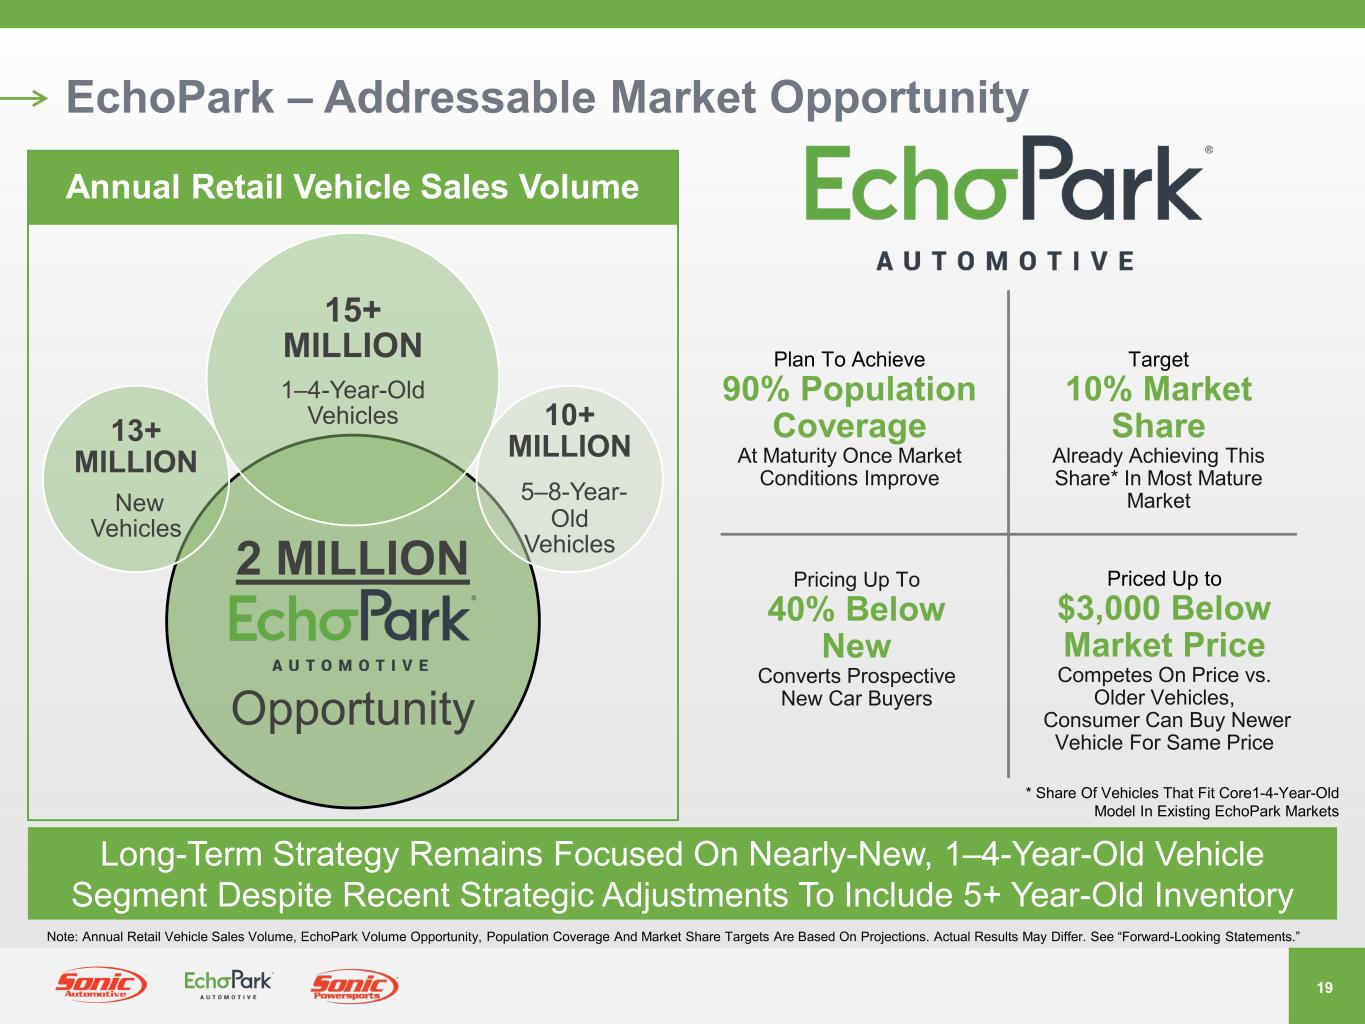
19 EchoPark – Addressable Market Opportunity * Share Of Vehicles That Fit Core1-4-Year-Old Model In Existing EchoPark Markets Plan To Achieve 90% Population Coverage At Maturity Once Market Conditions Improve Target 10% Market Share Already Achieving This Share* In Most Mature Market Priced Up to $3,000 Below Market Price Competes On Price vs. Older Vehicles, Consumer Can Buy Newer Vehicle For Same Price Pricing Up To 40% Below New Converts Prospective New Car Buyers 2 MILLION Opportunity 15+ MILLION 1–4-Year-Old Vehicles 10+ MILLION 5–8-Year- Old Vehicles 13+ MILLION New Vehicles Long-Term Strategy Remains Focused On Nearly-New, 1–4-Year-Old Vehicle Segment Despite Recent Strategic Adjustments To Include 5+ Year-Old Inventory Annual Retail Vehicle Sales Volume Note: Annual Retail Vehicle Sales Volume, EchoPark Volume Opportunity, Population Coverage And Market Share Targets Are Based On Projections. Actual Results May Differ. See “Forward-Looking Statements.”
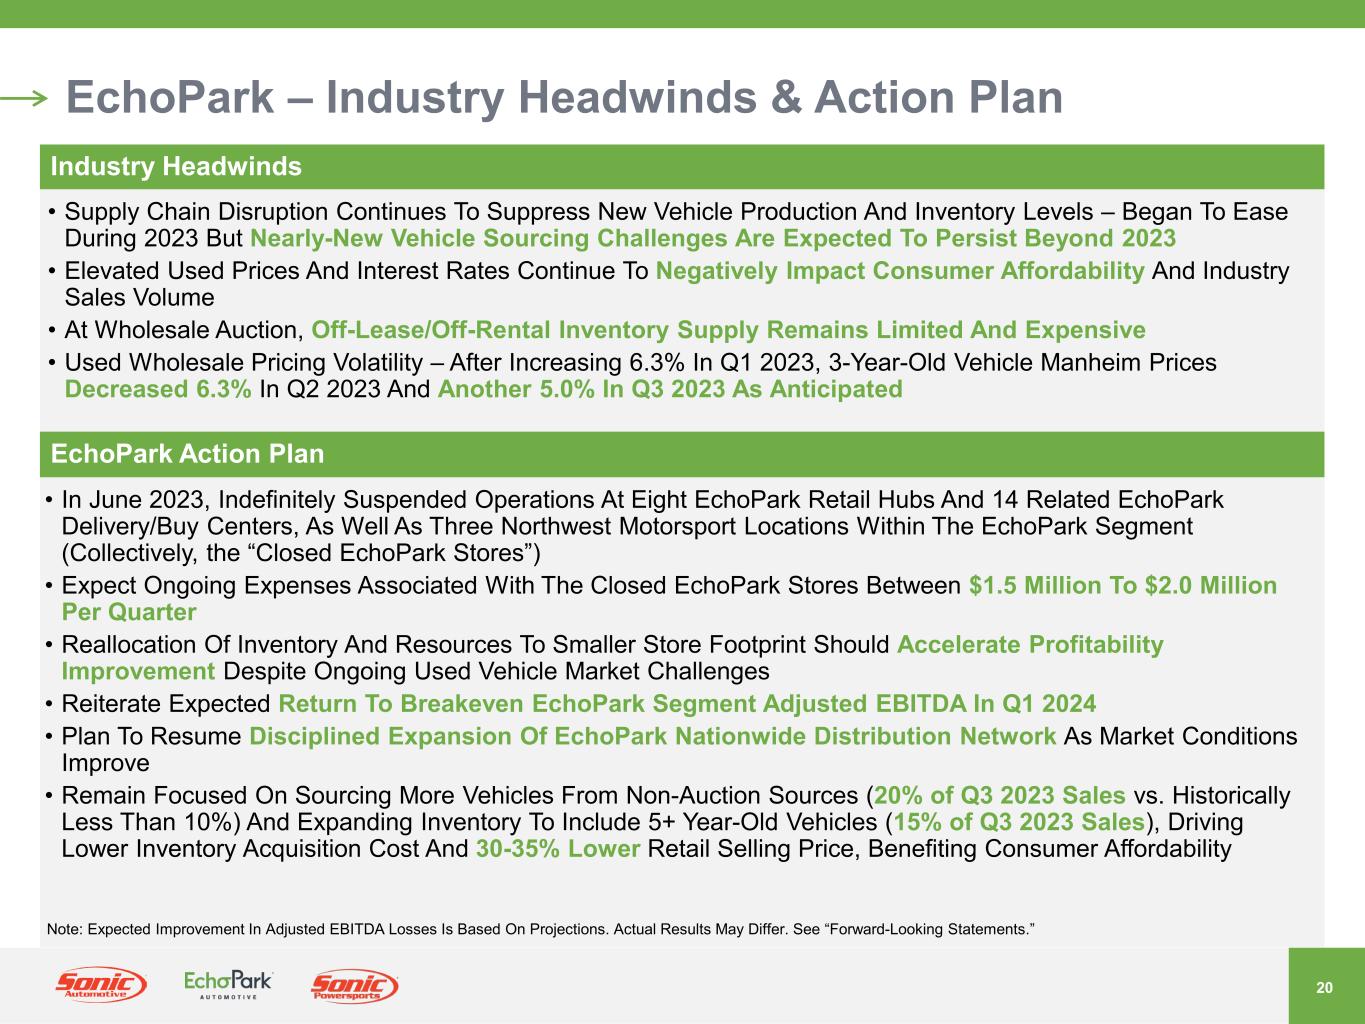
20 EchoPark – Industry Headwinds & Action Plan Industry Headwinds • Supply Chain Disruption Continues To Suppress New Vehicle Production And Inventory Levels – Began To Ease During 2023 But Nearly-New Vehicle Sourcing Challenges Are Expected To Persist Beyond 2023 • Elevated Used Prices And Interest Rates Continue To Negatively Impact Consumer Affordability And Industry Sales Volume • At Wholesale Auction, Off-Lease/Off-Rental Inventory Supply Remains Limited And Expensive • Used Wholesale Pricing Volatility – After Increasing 6.3% In Q1 2023, 3-Year-Old Vehicle Manheim Prices Decreased 6.3% In Q2 2023 And Another 5.0% In Q3 2023 As Anticipated EchoPark Action Plan • In June 2023, Indefinitely Suspended Operations At Eight EchoPark Retail Hubs And 14 Related EchoPark Delivery/Buy Centers, As Well As Three Northwest Motorsport Locations Within The EchoPark Segment (Collectively, the “Closed EchoPark Stores”) • Expect Ongoing Expenses Associated With The Closed EchoPark Stores Between $1.5 Million To $2.0 Million Per Quarter • Reallocation Of Inventory And Resources To Smaller Store Footprint Should Accelerate Profitability Improvement Despite Ongoing Used Vehicle Market Challenges • Reiterate Expected Return To Breakeven EchoPark Segment Adjusted EBITDA In Q1 2024 • Plan To Resume Disciplined Expansion Of EchoPark Nationwide Distribution Network As Market Conditions Improve • Remain Focused On Sourcing More Vehicles From Non-Auction Sources (20% of Q3 2023 Sales vs. Historically Less Than 10%) And Expanding Inventory To Include 5+ Year-Old Vehicles (15% of Q3 2023 Sales), Driving Lower Inventory Acquisition Cost And 30-35% Lower Retail Selling Price, Benefiting Consumer Affordability Note: Expected Improvement In Adjusted EBITDA Losses Is Based On Projections. Actual Results May Differ. See “Forward-Looking Statements.”
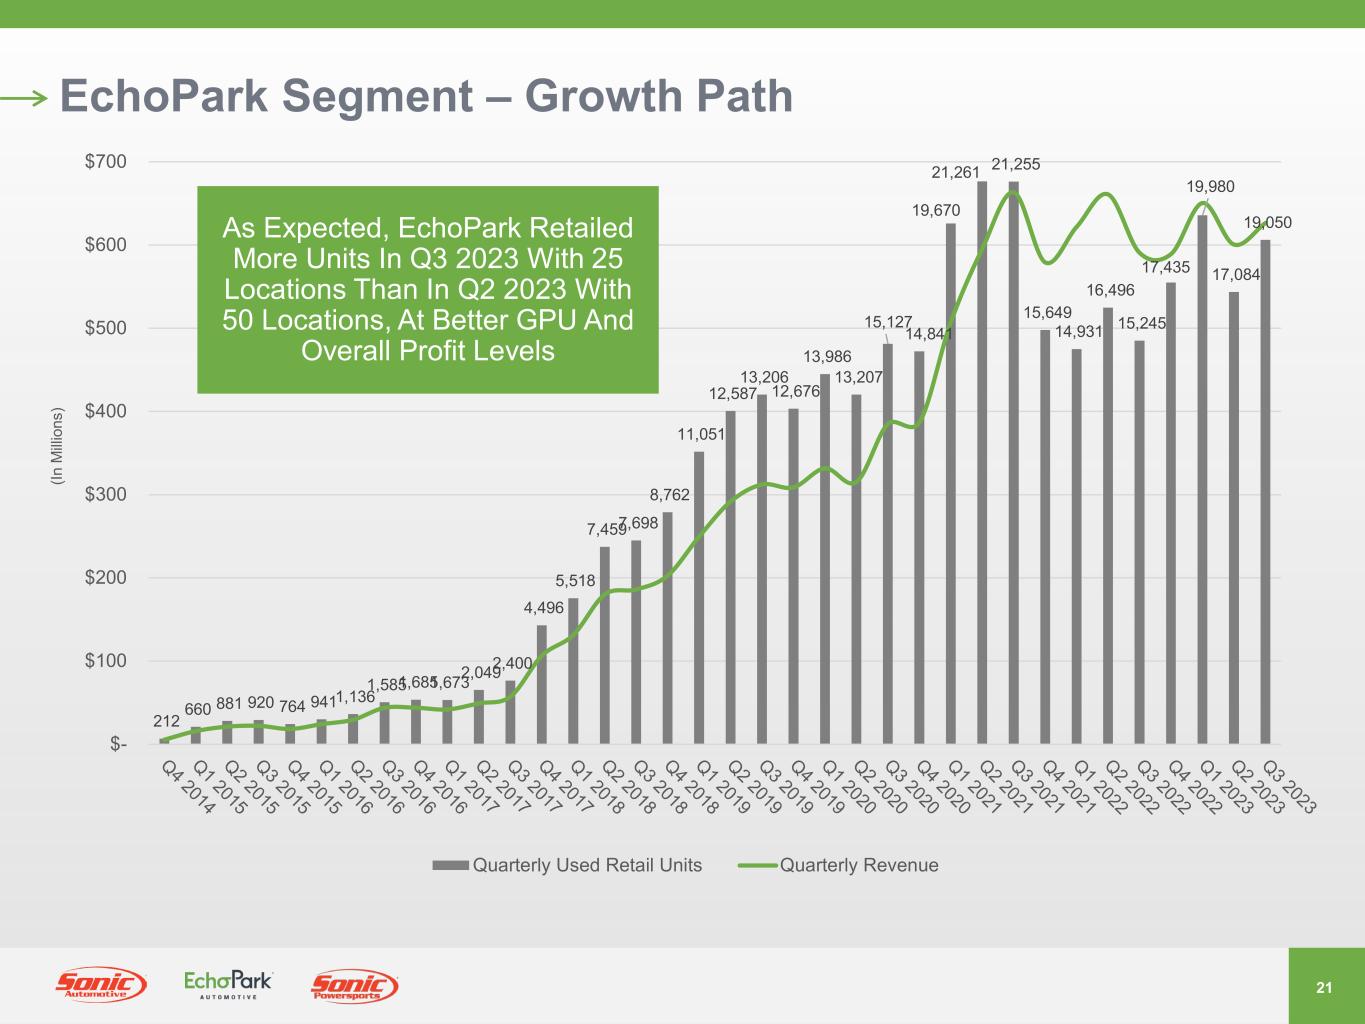
21 EchoPark Segment – Growth Path 212 660 881 920 764 941 1,136 1,585 1,685 1,673 2,049 2,400 4,496 5,518 7,459 7,698 8,762 11,051 12,587 13,206 12,676 13,986 13,207 15,127 14,841 19,670 21,261 21,255 15,649 14,931 16,496 15,245 17,435 19,980 17,084 19,050 $- $100 $200 $300 $400 $500 $600 $700 (In M illi on s) Quarterly Used Retail Units Quarterly Revenue As Expected, EchoPark Retailed More Units In Q3 2023 With 25 Locations Than In Q2 2023 With 50 Locations, At Better GPU And Overall Profit Levels
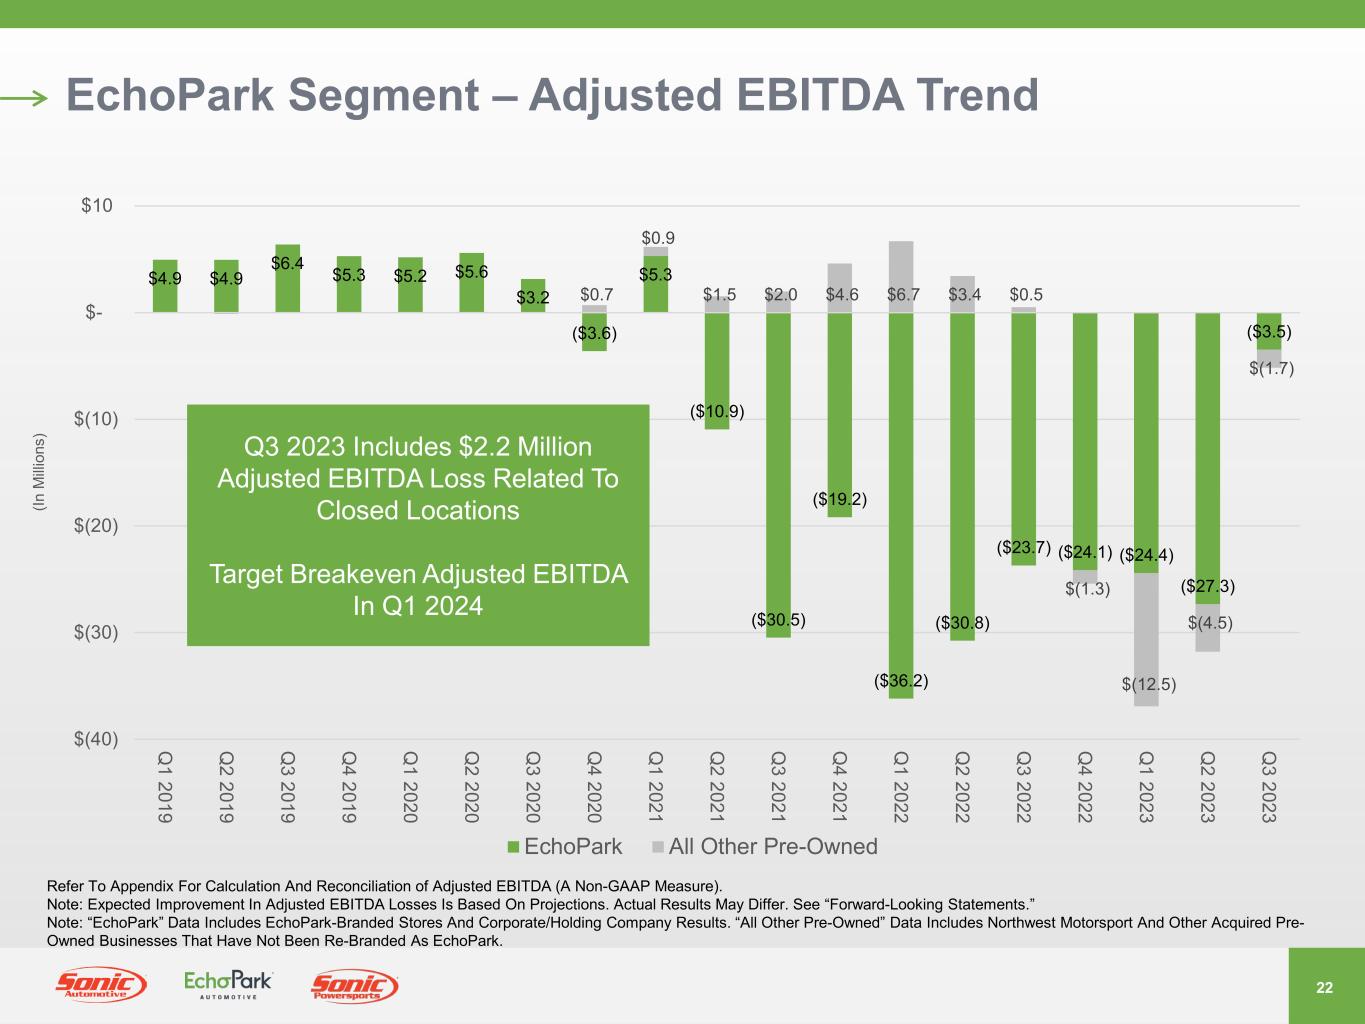
22 EchoPark Segment – Adjusted EBITDA Trend $4.9 $4.9 $6.4 $5.3 $5.2 $5.6 $3.2 ($3.6) $5.3 ($10.9) ($30.5) ($19.2) ($36.2) ($30.8) ($23.7) ($24.1) ($24.4) ($27.3) ($3.5) $0.7 $0.9 $1.5 $2.0 $4.6 $6.7 $3.4 $0.5 $(1.3) $(12.5) $(4.5) $(1.7) $(40) $(30) $(20) $(10) $- $10 Q 1 2019 Q 2 2019 Q 3 2019 Q 4 2019 Q 1 2020 Q 2 2020 Q 3 2020 Q 4 2020 Q 1 2021 Q 2 2021 Q 3 2021 Q 4 2021 Q 1 2022 Q 2 2022 Q 3 2022 Q 4 2022 Q 1 2023 Q 2 2023 Q 3 2023 EchoPark All Other Pre-Owned (In M illi on s) Refer To Appendix For Calculation And Reconciliation of Adjusted EBITDA (A Non-GAAP Measure). Note: Expected Improvement In Adjusted EBITDA Losses Is Based On Projections. Actual Results May Differ. See “Forward-Looking Statements.” Note: “EchoPark” Data Includes EchoPark-Branded Stores And Corporate/Holding Company Results. “All Other Pre-Owned” Data Includes Northwest Motorsport And Other Acquired Pre- Owned Businesses That Have Not Been Re-Branded As EchoPark. Q3 2023 Includes $2.2 Million Adjusted EBITDA Loss Related To Closed Locations Target Breakeven Adjusted EBITDA In Q1 2024

23 Powersports
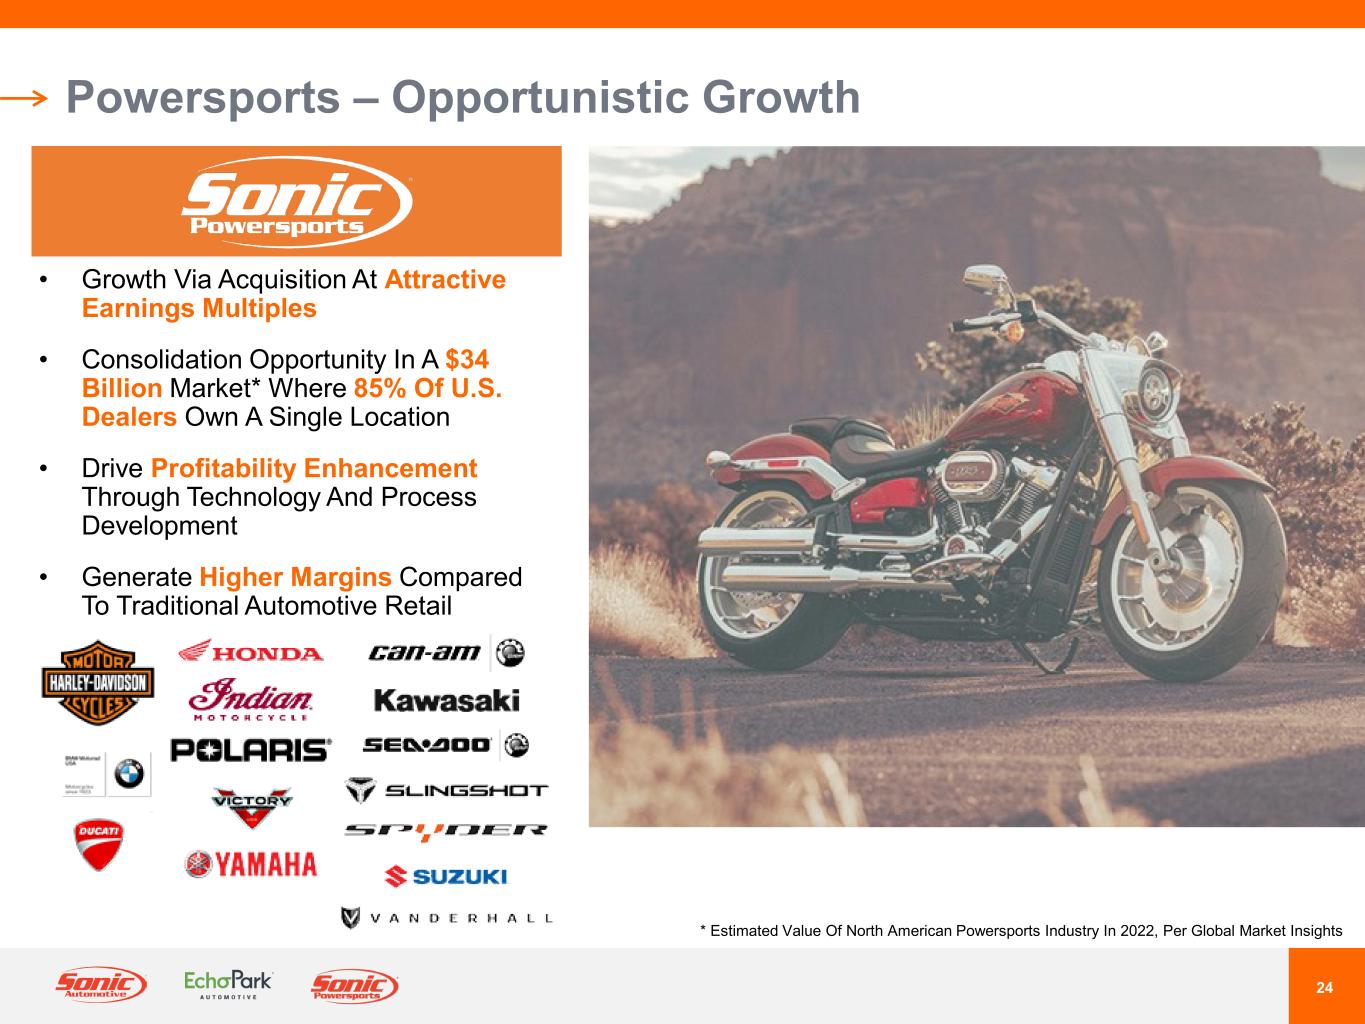
24 Powersports – Opportunistic Growth • Growth Via Acquisition At Attractive Earnings Multiples • Consolidation Opportunity In A $34 Billion Market* Where 85% Of U.S. Dealers Own A Single Location • Drive Profitability Enhancement Through Technology And Process Development • Generate Higher Margins Compared To Traditional Automotive Retail * Estimated Value Of North American Powersports Industry In 2022, Per Global Market Insights

25 Omnichannel Strategy
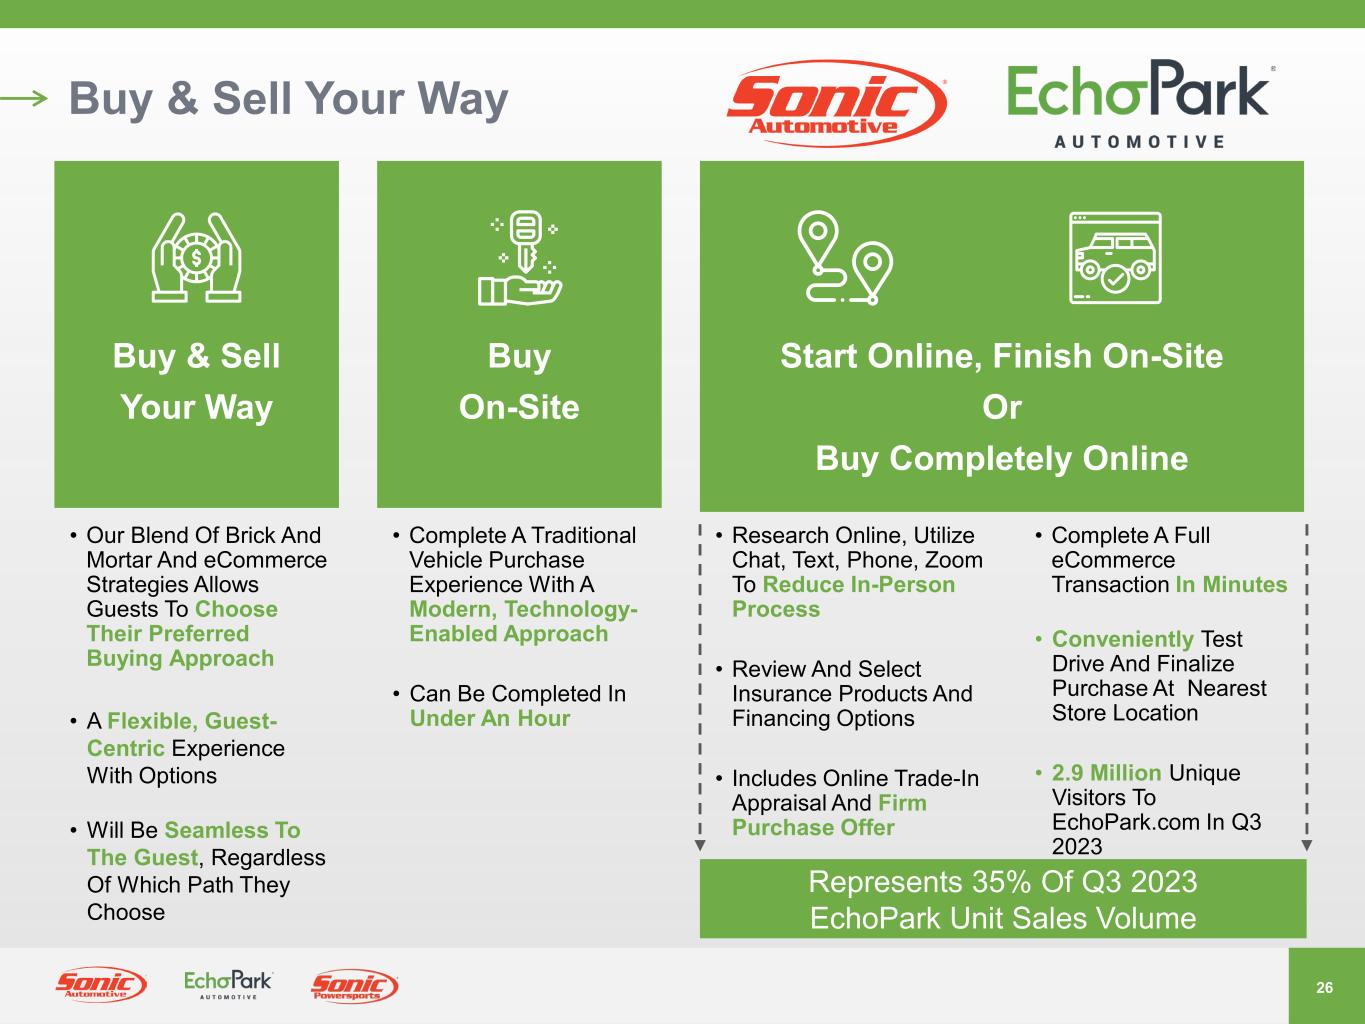
26 Buy & Sell Your Way • Complete A Traditional Vehicle Purchase Experience With A Modern, Technology- Enabled Approach • Can Be Completed In Under An Hour • Research Online, Utilize Chat, Text, Phone, Zoom To Reduce In-Person Process • Review And Select Insurance Products And Financing Options • Includes Online Trade-In Appraisal And Firm Purchase Offer • Complete A Full eCommerce Transaction In Minutes • Conveniently Test Drive And Finalize Purchase At Nearest Store Location • 2.9 Million Unique Visitors To EchoPark.com In Q3 2023 Buy & Sell Your Way Start Online, Finish On-Site Or Buy Completely Online Buy On-Site • Our Blend Of Brick And Mortar And eCommerce Strategies Allows Guests To Choose Their Preferred Buying Approach • A Flexible, Guest- Centric Experience With Options • Will Be Seamless To The Guest, Regardless Of Which Path They Choose Represents 35% Of Q3 2023 EchoPark Unit Sales Volume

27 Appendix
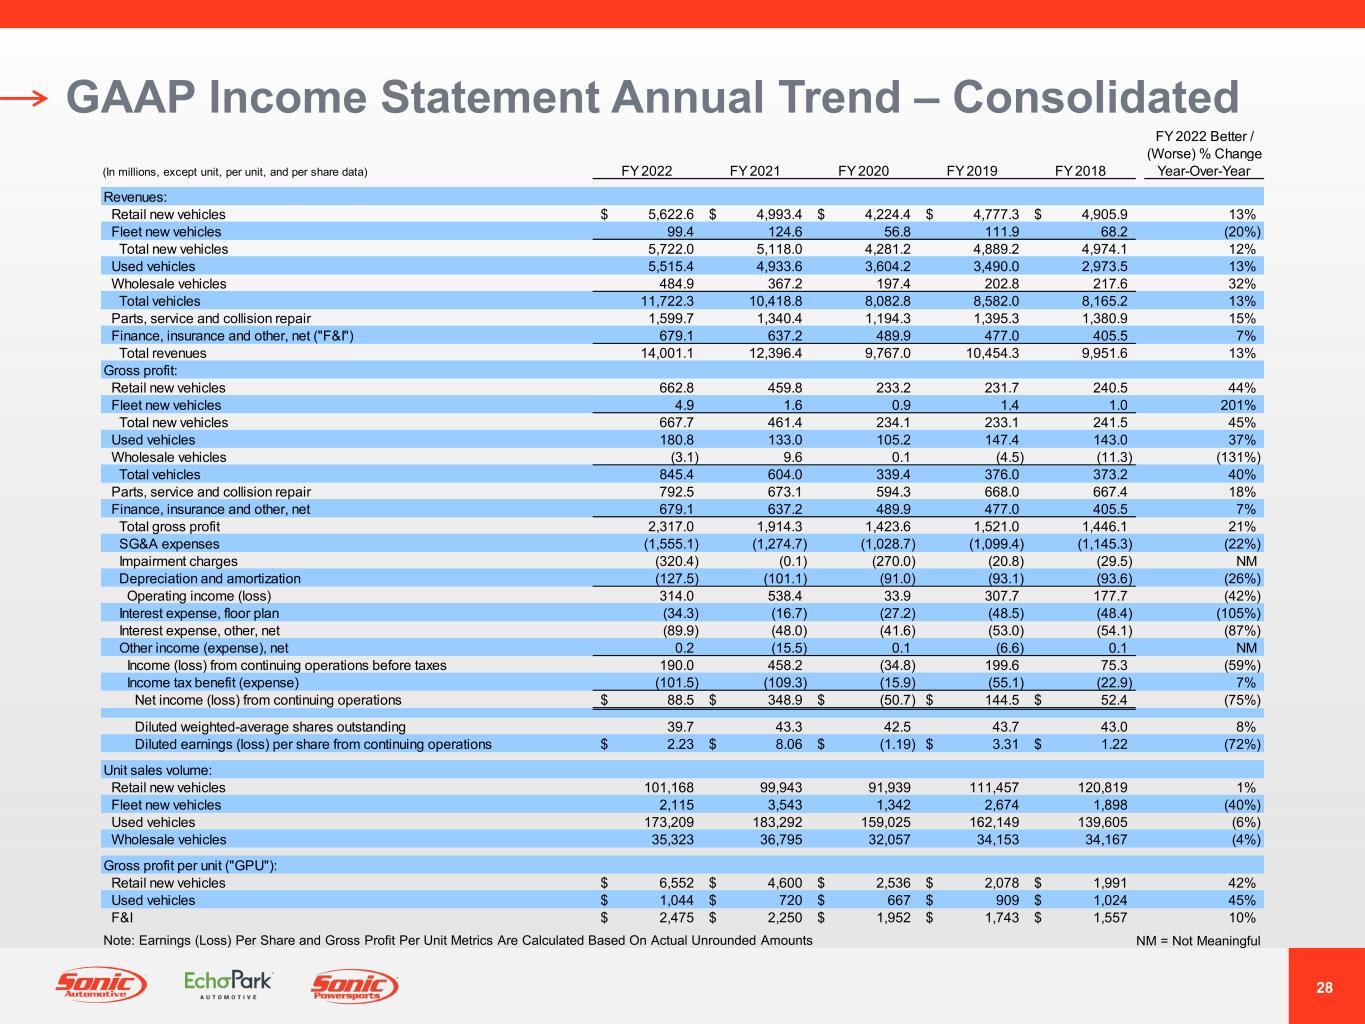
28 GAAP Income Statement Annual Trend – Consolidated NM = Not MeaningfulNote: Earnings (Loss) Per Share and Gross Profit Per Unit Metrics Are Calculated Based On Actual Unrounded Amounts FY 2022 Better / (Worse) % Change (In millions, except unit, per unit, and per share data) FY 2022 FY 2021 FY 2020 FY 2019 FY 2018 Year-Over-Year Revenues: Retail new vehicles 5,622.6$ 4,993.4$ 4,224.4$ 4,777.3$ 4,905.9$ 13% Fleet new vehicles 99.4 124.6 56.8 111.9 68.2 (20%) Total new vehicles 5,722.0 5,118.0 4,281.2 4,889.2 4,974.1 12% Used vehicles 5,515.4 4,933.6 3,604.2 3,490.0 2,973.5 13% Wholesale vehicles 484.9 367.2 197.4 202.8 217.6 32% Total vehicles 11,722.3 10,418.8 8,082.8 8,582.0 8,165.2 13% Parts, service and collision repair 1,599.7 1,340.4 1,194.3 1,395.3 1,380.9 15% Finance, insurance and other, net ("F&I") 679.1 637.2 489.9 477.0 405.5 7% Total revenues 14,001.1 12,396.4 9,767.0 10,454.3 9,951.6 13% Gross profit: Retail new vehicles 662.8 459.8 233.2 231.7 240.5 44% Fleet new vehicles 4.9 1.6 0.9 1.4 1.0 201% Total new vehicles 667.7 461.4 234.1 233.1 241.5 45% Used vehicles 180.8 133.0 105.2 147.4 143.0 37% Wholesale vehicles (3.1) 9.6 0.1 (4.5) (11.3) (131%) Total vehicles 845.4 604.0 339.4 376.0 373.2 40% Parts, service and collision repair 792.5 673.1 594.3 668.0 667.4 18% Finance, insurance and other, net 679.1 637.2 489.9 477.0 405.5 7% Total gross profit 2,317.0 1,914.3 1,423.6 1,521.0 1,446.1 21% SG&A expenses (1,555.1) (1,274.7) (1,028.7) (1,099.4) (1,145.3) (22%) Impairment charges (320.4) (0.1) (270.0) (20.8) (29.5) NM Depreciation and amortization (127.5) (101.1) (91.0) (93.1) (93.6) (26%) Operating income (loss) 314.0 538.4 33.9 307.7 177.7 (42%) Interest expense, floor plan (34.3) (16.7) (27.2) (48.5) (48.4) (105%) Interest expense, other, net (89.9) (48.0) (41.6) (53.0) (54.1) (87%) Other income (expense), net 0.2 (15.5) 0.1 (6.6) 0.1 NM Income (loss) from continuing operations before taxes 190.0 458.2 (34.8) 199.6 75.3 (59%) Income tax benefit (expense) (101.5) (109.3) (15.9) (55.1) (22.9) 7% Net income (loss) from continuing operations 88.5$ 348.9$ (50.7)$ 144.5$ 52.4$ (75%) Diluted weighted-average shares outstanding 39.7 43.3 42.5 43.7 43.0 8% Diluted earnings (loss) per share from continuing operations 2.23$ 8.06$ (1.19)$ 3.31$ 1.22$ (72%) Unit sales volume: Retail new vehicles 101,168 99,943 91,939 111,457 120,819 1% Fleet new vehicles 2,115 3,543 1,342 2,674 1,898 (40%) Used vehicles 173,209 183,292 159,025 162,149 139,605 (6%) Wholesale vehicles 35,323 36,795 32,057 34,153 34,167 (4%) Gross profit per unit ("GPU"): Retail new vehicles 6,552$ 4,600$ 2,536$ 2,078$ 1,991$ 42% Used vehicles 1,044$ 720$ 667$ 909$ 1,024$ 45% F&I 2,475$ 2,250$ 1,952$ 1,743$ 1,557$ 10%
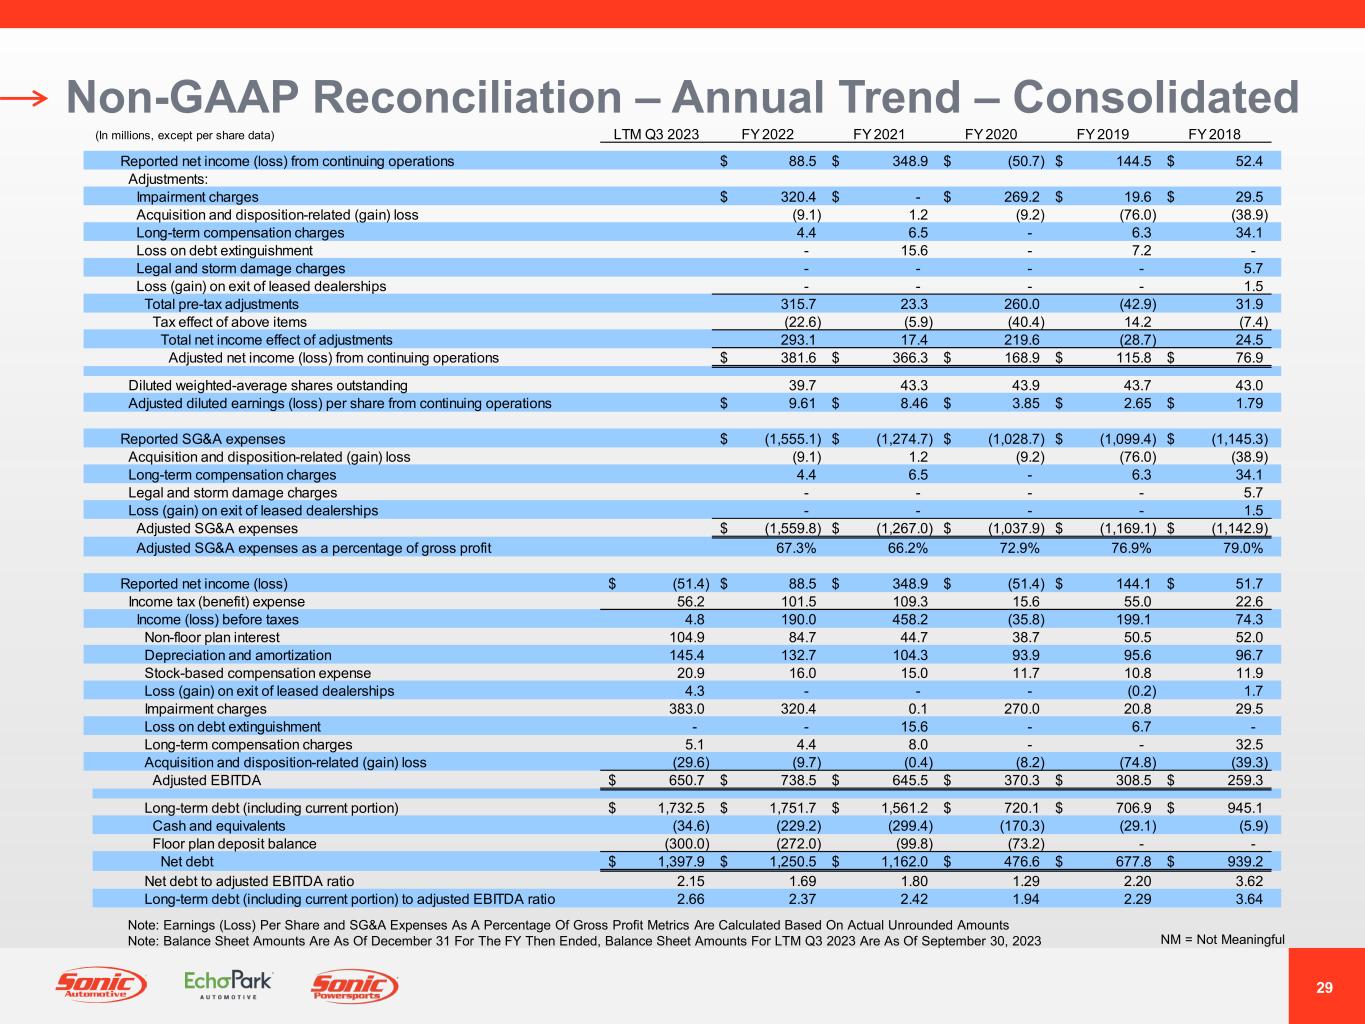
29 Non-GAAP Reconciliation – Annual Trend – Consolidated NM = Not Meaningful Note: Earnings (Loss) Per Share and SG&A Expenses As A Percentage Of Gross Profit Metrics Are Calculated Based On Actual Unrounded Amounts Note: Balance Sheet Amounts Are As Of December 31 For The FY Then Ended, Balance Sheet Amounts For LTM Q3 2023 Are As Of September 30, 2023 (In millions, except per share data) LTM Q3 2023 FY 2022 FY 2021 FY 2020 FY 2019 FY 2018 Reported net income (loss) from continuing operations 88.5$ 348.9$ (50.7)$ 144.5$ 52.4$ Adjustments: Impairment charges 320.4$ -$ 269.2$ 19.6$ 29.5$ Acquisition and disposition-related (gain) loss (9.1) 1.2 (9.2) (76.0) (38.9) Long-term compensation charges 4.4 6.5 - 6.3 34.1 Loss on debt extinguishment - 15.6 - 7.2 - Legal and storm damage charges - - - - 5.7 Loss (gain) on exit of leased dealerships - - - - 1.5 Total pre-tax adjustments 315.7 23.3 260.0 (42.9) 31.9 Tax effect of above items (22.6) (5.9) (40.4) 14.2 (7.4) Total net income effect of adjustments 293.1 17.4 219.6 (28.7) 24.5 Adjusted net income (loss) from continuing operations 381.6$ 366.3$ 168.9$ 115.8$ 76.9$ Diluted weighted-average shares outstanding 39.7 43.3 43.9 43.7 43.0 Adjusted diluted earnings (loss) per share from continuing operations 9.61$ 8.46$ 3.85$ 2.65$ 1.79$ Reported SG&A expenses (1,555.1)$ (1,274.7)$ (1,028.7)$ (1,099.4)$ (1,145.3)$ Acquisition and disposition-related (gain) loss (9.1) 1.2 (9.2) (76.0) (38.9) Long-term compensation charges 4.4 6.5 - 6.3 34.1 Legal and storm damage charges - - - - 5.7 Loss (gain) on exit of leased dealerships - - - - 1.5 Adjusted SG&A expenses (1,559.8)$ (1,267.0)$ (1,037.9)$ (1,169.1)$ (1,142.9)$ Adjusted SG&A expenses as a percentage of gross profit 67.3% 66.2% 72.9% 76.9% 79.0% Reported net income (loss) (51.4)$ 88.5$ 348.9$ (51.4)$ 144.1$ 51.7$ Income tax (benefit) expense 56.2 101.5 109.3 15.6 55.0 22.6 Income (loss) before taxes 4.8 190.0 458.2 (35.8) 199.1 74.3 Non-floor plan interest 104.9 84.7 44.7 38.7 50.5 52.0 Depreciation and amortization 145.4 132.7 104.3 93.9 95.6 96.7 Stock-based compensation expense 20.9 16.0 15.0 11.7 10.8 11.9 Loss (gain) on exit of leased dealerships 4.3 - - - (0.2) 1.7 Impairment charges 383.0 320.4 0.1 270.0 20.8 29.5 Loss on debt extinguishment - - 15.6 - 6.7 - Long-term compensation charges 5.1 4.4 8.0 - - 32.5 Acquisition and disposition-related (gain) loss (29.6) (9.7) (0.4) (8.2) (74.8) (39.3) Adjusted EBITDA 650.7$ 738.5$ 645.5$ 370.3$ 308.5$ 259.3$ Long-term debt (including current portion) 1,732.5$ 1,751.7$ 1,561.2$ 720.1$ 706.9$ 945.1$ Cash and equivalents (34.6) (229.2) (299.4) (170.3) (29.1) (5.9) Floor plan deposit balance (300.0) (272.0) (99.8) (73.2) - - Net debt 1,397.9$ 1,250.5$ 1,162.0$ 476.6$ 677.8$ 939.2$ Net debt to adjusted EBITDA ratio 2.15 1.69 1.80 1.29 2.20 3.62 Long-term debt (including current portion) to adjusted EBITDA ratio 2.66 2.37 2.42 1.94 2.29 3.64
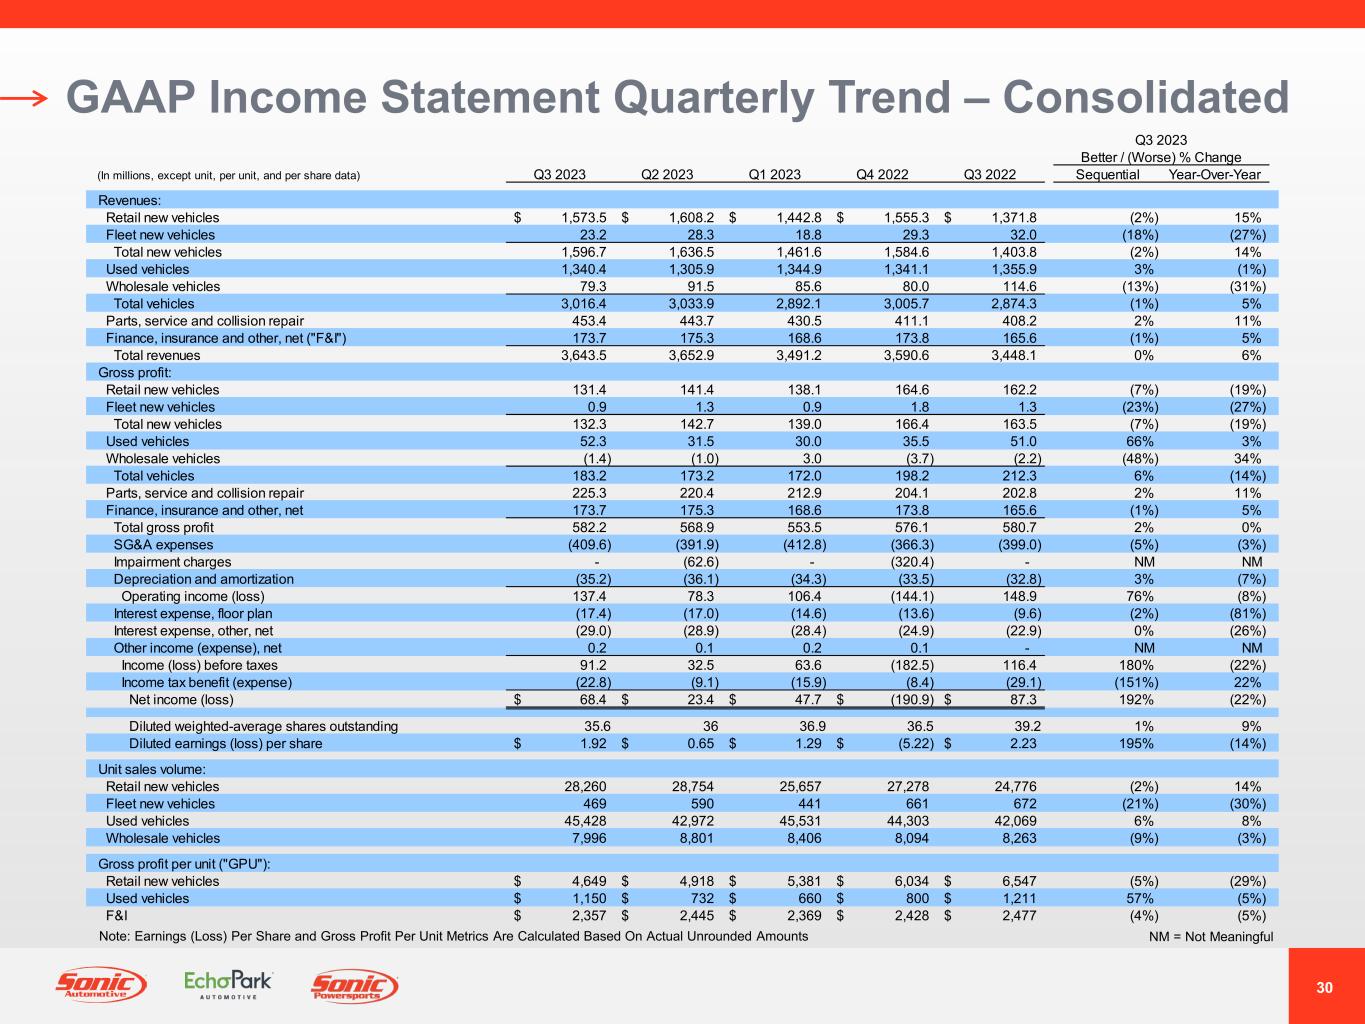
30 GAAP Income Statement Quarterly Trend – Consolidated NM = Not MeaningfulNote: Earnings (Loss) Per Share and Gross Profit Per Unit Metrics Are Calculated Based On Actual Unrounded Amounts Q3 2023 Better / (Worse) % Change (In millions, except unit, per unit, and per share data) Q3 2023 Q2 2023 Q1 2023 Q4 2022 Q3 2022 Sequential Year-Over-Year Revenues: Retail new vehicles 1,573.5$ 1,608.2$ 1,442.8$ 1,555.3$ 1,371.8$ (2%) 15% Fleet new vehicles 23.2 28.3 18.8 29.3 32.0 (18%) (27%) Total new vehicles 1,596.7 1,636.5 1,461.6 1,584.6 1,403.8 (2%) 14% Used vehicles 1,340.4 1,305.9 1,344.9 1,341.1 1,355.9 3% (1%) Wholesale vehicles 79.3 91.5 85.6 80.0 114.6 (13%) (31%) Total vehicles 3,016.4 3,033.9 2,892.1 3,005.7 2,874.3 (1%) 5% Parts, service and collision repair 453.4 443.7 430.5 411.1 408.2 2% 11% Finance, insurance and other, net ("F&I") 173.7 175.3 168.6 173.8 165.6 (1%) 5% Total revenues 3,643.5 3,652.9 3,491.2 3,590.6 3,448.1 0% 6% Gross profit: Retail new vehicles 131.4 141.4 138.1 164.6 162.2 (7%) (19%) Fleet new vehicles 0.9 1.3 0.9 1.8 1.3 (23%) (27%) Total new vehicles 132.3 142.7 139.0 166.4 163.5 (7%) (19%) Used vehicles 52.3 31.5 30.0 35.5 51.0 66% 3% Wholesale vehicles (1.4) (1.0) 3.0 (3.7) (2.2) (48%) 34% Total vehicles 183.2 173.2 172.0 198.2 212.3 6% (14%) Parts, service and collision repair 225.3 220.4 212.9 204.1 202.8 2% 11% Finance, insurance and other, net 173.7 175.3 168.6 173.8 165.6 (1%) 5% Total gross profit 582.2 568.9 553.5 576.1 580.7 2% 0% SG&A expenses (409.6) (391.9) (412.8) (366.3) (399.0) (5%) (3%) Impairment charges - (62.6) - (320.4) - NM NM Depreciation and amortization (35.2) (36.1) (34.3) (33.5) (32.8) 3% (7%) Operating income (loss) 137.4 78.3 106.4 (144.1) 148.9 76% (8%) Interest expense, floor plan (17.4) (17.0) (14.6) (13.6) (9.6) (2%) (81%) Interest expense, other, net (29.0) (28.9) (28.4) (24.9) (22.9) 0% (26%) Other income (expense), net 0.2 0.1 0.2 0.1 - NM NM Income (loss) before taxes 91.2 32.5 63.6 (182.5) 116.4 180% (22%) Income tax benefit (expense) (22.8) (9.1) (15.9) (8.4) (29.1) (151%) 22% Net income (loss) 68.4$ 23.4$ 47.7$ (190.9)$ 87.3$ 192% (22%) Diluted weighted-average shares outstanding 35.6 36 36.9 36.5 39.2 1% 9% Diluted earnings (loss) per share 1.92$ 0.65$ 1.29$ (5.22)$ 2.23$ 195% (14%) Unit sales volume: Retail new vehicles 28,260 28,754 25,657 27,278 24,776 (2%) 14% Fleet new vehicles 469 590 441 661 672 (21%) (30%) Used vehicles 45,428 42,972 45,531 44,303 42,069 6% 8% Wholesale vehicles 7,996 8,801 8,406 8,094 8,263 (9%) (3%) Gross profit per unit ("GPU"): Retail new vehicles 4,649$ 4,918$ 5,381$ 6,034$ 6,547$ (5%) (29%) Used vehicles 1,150$ 732$ 660$ 800$ 1,211$ 57% (5%) F&I 2,357$ 2,445$ 2,369$ 2,428$ 2,477$ (4%) (5%)
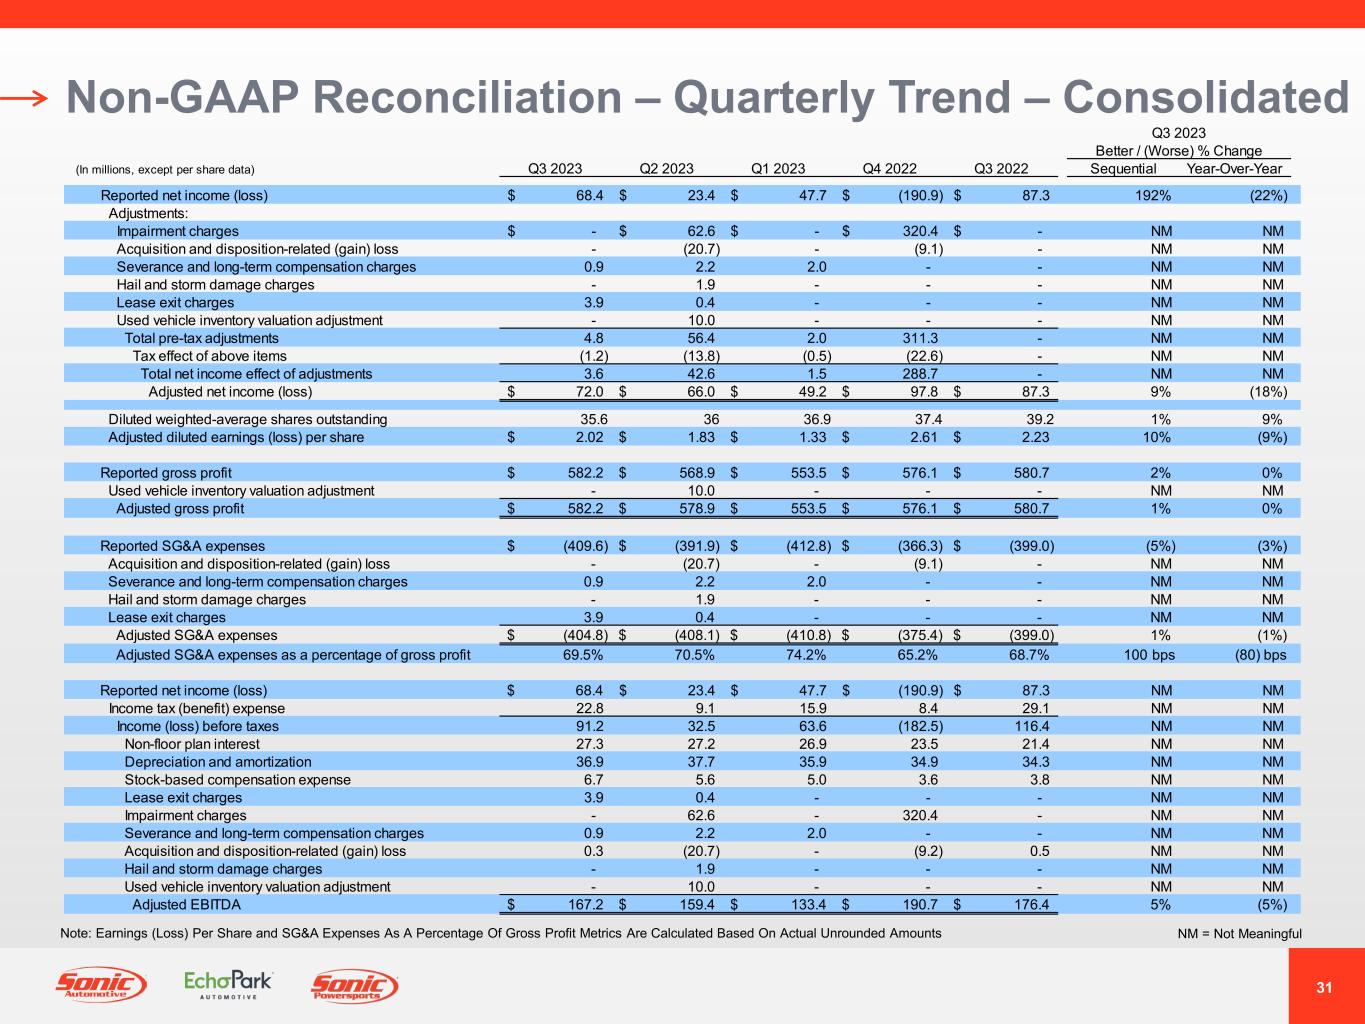
31 Non-GAAP Reconciliation – Quarterly Trend – Consolidated NM = Not MeaningfulNote: Earnings (Loss) Per Share and SG&A Expenses As A Percentage Of Gross Profit Metrics Are Calculated Based On Actual Unrounded Amounts Q3 2023 Better / (Worse) % Change (In millions, except per share data) Q3 2023 Q2 2023 Q1 2023 Q4 2022 Q3 2022 Sequential Year-Over-Year Reported net income (loss) 68.4$ 23.4$ 47.7$ (190.9)$ 87.3$ 192% (22%) Adjustments: Impairment charges -$ 62.6$ -$ 320.4$ -$ NM NM Acquisition and disposition-related (gain) loss - (20.7) - (9.1) - NM NM Severance and long-term compensation charges 0.9 2.2 2.0 - - NM NM Hail and storm damage charges - 1.9 - - - NM NM Lease exit charges 3.9 0.4 - - - NM NM Used vehicle inventory valuation adjustment - 10.0 - - - NM NM Total pre-tax adjustments 4.8 56.4 2.0 311.3 - NM NM Tax effect of above items (1.2) (13.8) (0.5) (22.6) - NM NM Total net income effect of adjustments 3.6 42.6 1.5 288.7 - NM NM Adjusted net income (loss) 72.0$ 66.0$ 49.2$ 97.8$ 87.3$ 9% (18%) Diluted weighted-average shares outstanding 35.6 36 36.9 37.4 39.2 1% 9% Adjusted diluted earnings (loss) per share 2.02$ 1.83$ 1.33$ 2.61$ 2.23$ 10% (9%) Reported gross profit 582.2$ 568.9$ 553.5$ 576.1$ 580.7$ 2% 0% Used vehicle inventory valuation adjustment - 10.0 - - - NM NM Adjusted gross profit 582.2$ 578.9$ 553.5$ 576.1$ 580.7$ 1% 0% Reported SG&A expenses (409.6)$ (391.9)$ (412.8)$ (366.3)$ (399.0)$ (5%) (3%) Acquisition and disposition-related (gain) loss - (20.7) - (9.1) - NM NM Severance and long-term compensation charges 0.9 2.2 2.0 - - NM NM Hail and storm damage charges - 1.9 - - - NM NM Lease exit charges 3.9 0.4 - - - NM NM Adjusted SG&A expenses (404.8)$ (408.1)$ (410.8)$ (375.4)$ (399.0)$ 1% (1%) Adjusted SG&A expenses as a percentage of gross profit 69.5% 70.5% 74.2% 65.2% 68.7% 100 bps (80) bps Reported net income (loss) 68.4$ 23.4$ 47.7$ (190.9)$ 87.3$ NM NM Income tax (benefit) expense 22.8 9.1 15.9 8.4 29.1 NM NM Income (loss) before taxes 91.2 32.5 63.6 (182.5) 116.4 NM NM Non-floor plan interest 27.3 27.2 26.9 23.5 21.4 NM NM Depreciation and amortization 36.9 37.7 35.9 34.9 34.3 NM NM Stock-based compensation expense 6.7 5.6 5.0 3.6 3.8 NM NM Lease exit charges 3.9 0.4 - - - NM NM Impairment charges - 62.6 - 320.4 - NM NM Severance and long-term compensation charges 0.9 2.2 2.0 - - NM NM Acquisition and disposition-related (gain) loss 0.3 (20.7) - (9.2) 0.5 NM NM Hail and storm damage charges - 1.9 - - - NM NM Used vehicle inventory valuation adjustment - 10.0 - - - NM NM Adjusted EBITDA 167.2$ 159.4$ 133.4$ 190.7$ 176.4$ 5% (5%)
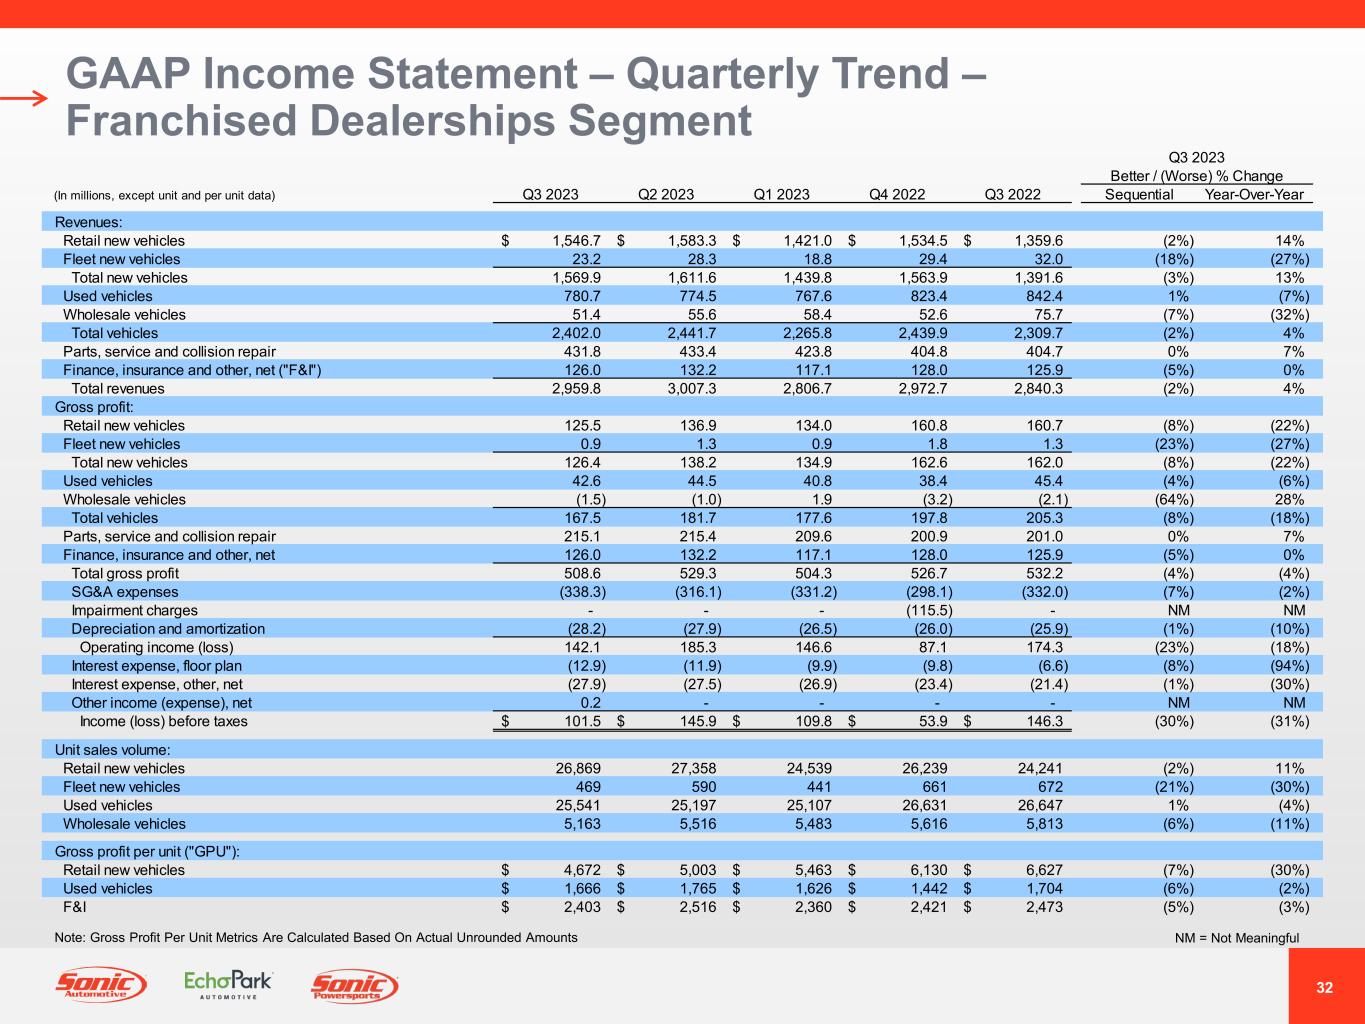
32 GAAP Income Statement – Quarterly Trend – Franchised Dealerships Segment NM = Not MeaningfulNote: Gross Profit Per Unit Metrics Are Calculated Based On Actual Unrounded Amounts Q3 2023 Better / (Worse) % Change (In millions, except unit and per unit data) Q3 2023 Q2 2023 Q1 2023 Q4 2022 Q3 2022 Sequential Year-Over-Year Revenues: Retail new vehicles 1,546.7$ 1,583.3$ 1,421.0$ 1,534.5$ 1,359.6$ (2%) 14% Fleet new vehicles 23.2 28.3 18.8 29.4 32.0 (18%) (27%) Total new vehicles 1,569.9 1,611.6 1,439.8 1,563.9 1,391.6 (3%) 13% Used vehicles 780.7 774.5 767.6 823.4 842.4 1% (7%) Wholesale vehicles 51.4 55.6 58.4 52.6 75.7 (7%) (32%) Total vehicles 2,402.0 2,441.7 2,265.8 2,439.9 2,309.7 (2%) 4% Parts, service and collision repair 431.8 433.4 423.8 404.8 404.7 0% 7% Finance, insurance and other, net ("F&I") 126.0 132.2 117.1 128.0 125.9 (5%) 0% Total revenues 2,959.8 3,007.3 2,806.7 2,972.7 2,840.3 (2%) 4% Gross profit: Retail new vehicles 125.5 136.9 134.0 160.8 160.7 (8%) (22%) Fleet new vehicles 0.9 1.3 0.9 1.8 1.3 (23%) (27%) Total new vehicles 126.4 138.2 134.9 162.6 162.0 (8%) (22%) Used vehicles 42.6 44.5 40.8 38.4 45.4 (4%) (6%) Wholesale vehicles (1.5) (1.0) 1.9 (3.2) (2.1) (64%) 28% Total vehicles 167.5 181.7 177.6 197.8 205.3 (8%) (18%) Parts, service and collision repair 215.1 215.4 209.6 200.9 201.0 0% 7% Finance, insurance and other, net 126.0 132.2 117.1 128.0 125.9 (5%) 0% Total gross profit 508.6 529.3 504.3 526.7 532.2 (4%) (4%) SG&A expenses (338.3) (316.1) (331.2) (298.1) (332.0) (7%) (2%) Impairment charges - - - (115.5) - NM NM Depreciation and amortization (28.2) (27.9) (26.5) (26.0) (25.9) (1%) (10%) Operating income (loss) 142.1 185.3 146.6 87.1 174.3 (23%) (18%) Interest expense, floor plan (12.9) (11.9) (9.9) (9.8) (6.6) (8%) (94%) Interest expense, other, net (27.9) (27.5) (26.9) (23.4) (21.4) (1%) (30%) Other income (expense), net 0.2 - - - - NM NM Income (loss) before taxes 101.5$ 145.9$ 109.8$ 53.9$ 146.3$ (30%) (31%) Unit sales volume: Retail new vehicles 26,869 27,358 24,539 26,239 24,241 (2%) 11% Fleet new vehicles 469 590 441 661 672 (21%) (30%) Used vehicles 25,541 25,197 25,107 26,631 26,647 1% (4%) Wholesale vehicles 5,163 5,516 5,483 5,616 5,813 (6%) (11%) Gross profit per unit ("GPU"): Retail new vehicles 4,672$ 5,003$ 5,463$ 6,130$ 6,627$ (7%) (30%) Used vehicles 1,666$ 1,765$ 1,626$ 1,442$ 1,704$ (6%) (2%) F&I 2,403$ 2,516$ 2,360$ 2,421$ 2,473$ (5%) (3%)
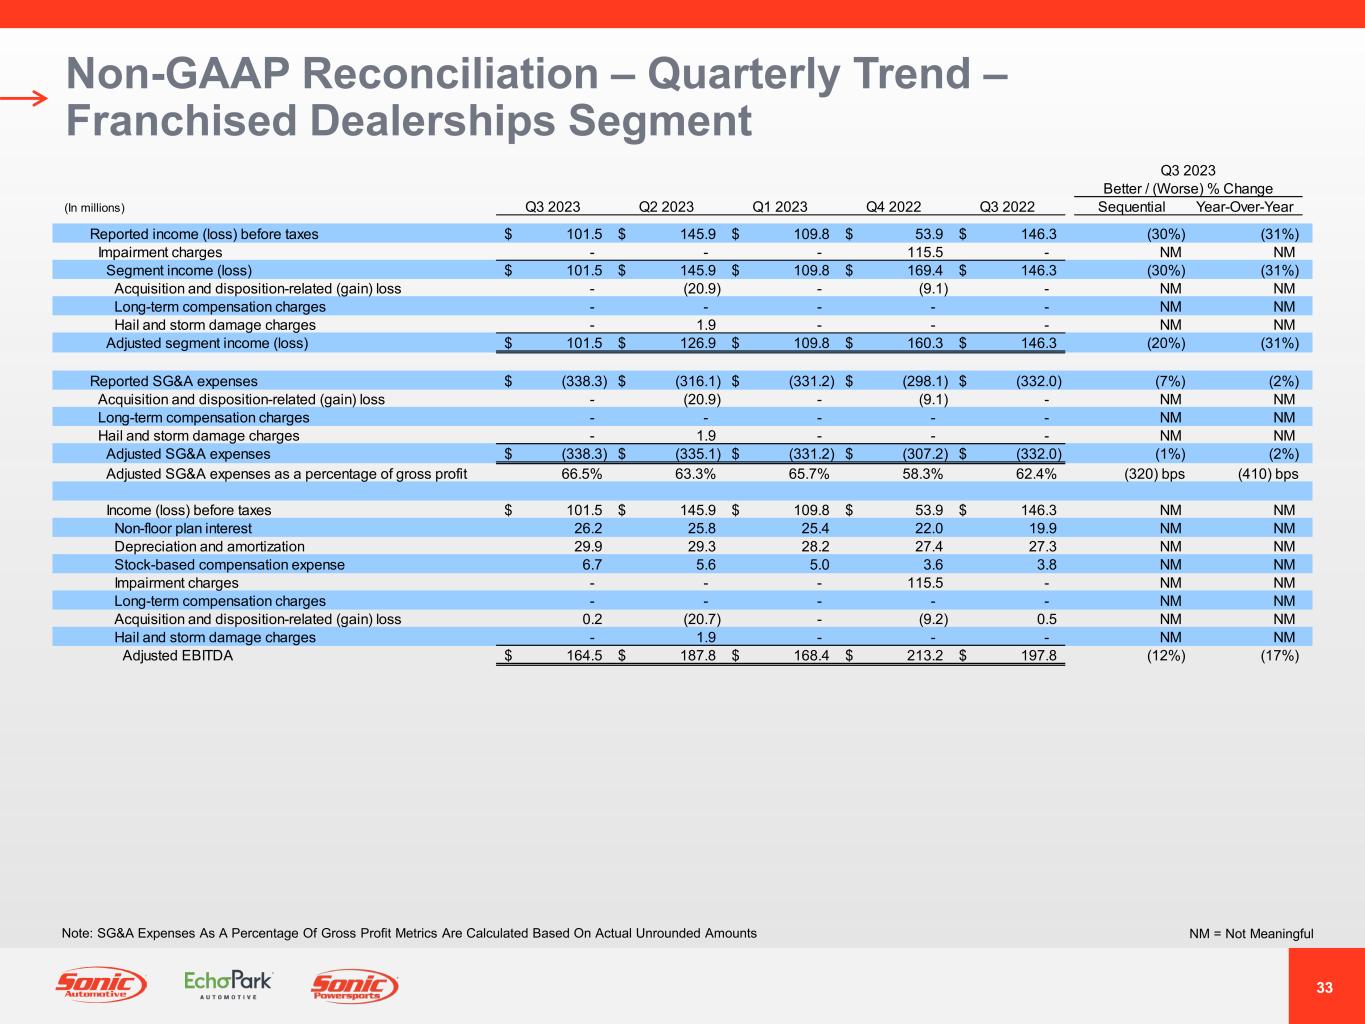
33 Non-GAAP Reconciliation – Quarterly Trend – Franchised Dealerships Segment NM = Not MeaningfulNote: SG&A Expenses As A Percentage Of Gross Profit Metrics Are Calculated Based On Actual Unrounded Amounts Q3 2023 Better / (Worse) % Change (In millions) Q3 2023 Q2 2023 Q1 2023 Q4 2022 Q3 2022 Sequential Year-Over-Year Reported income (loss) before taxes 101.5$ 145.9$ 109.8$ 53.9$ 146.3$ (30%) (31%) Impairment charges - - - 115.5 - NM NM Segment income (loss) 101.5$ 145.9$ 109.8$ 169.4$ 146.3$ (30%) (31%) Acquisition and disposition-related (gain) loss - (20.9) - (9.1) - NM NM Long-term compensation charges - - - - - NM NM Hail and storm damage charges - 1.9 - - - NM NM Adjusted segment income (loss) 101.5$ 126.9$ 109.8$ 160.3$ 146.3$ (20%) (31%) Reported SG&A expenses (338.3)$ (316.1)$ (331.2)$ (298.1)$ (332.0)$ (7%) (2%) Acquisition and disposition-related (gain) loss - (20.9) - (9.1) - NM NM Long-term compensation charges - - - - - NM NM Hail and storm damage charges - 1.9 - - - NM NM Adjusted SG&A expenses (338.3)$ (335.1)$ (331.2)$ (307.2)$ (332.0)$ (1%) (2%) Adjusted SG&A expenses as a percentage of gross profit 66.5% 63.3% 65.7% 58.3% 62.4% (320) bps (410) bps Income (loss) before taxes 101.5$ 145.9$ 109.8$ 53.9$ 146.3$ NM NM Non-floor plan interest 26.2 25.8 25.4 22.0 19.9 NM NM Depreciation and amortization 29.9 29.3 28.2 27.4 27.3 NM NM Stock-based compensation expense 6.7 5.6 5.0 3.6 3.8 NM NM Impairment charges - - - 115.5 - NM NM Long-term compensation charges - - - - - NM NM Acquisition and disposition-related (gain) loss 0.2 (20.7) - (9.2) 0.5 NM NM Hail and storm damage charges - 1.9 - - - NM NM Adjusted EBITDA 164.5$ 187.8$ 168.4$ 213.2$ 197.8$ (12%) (17%)
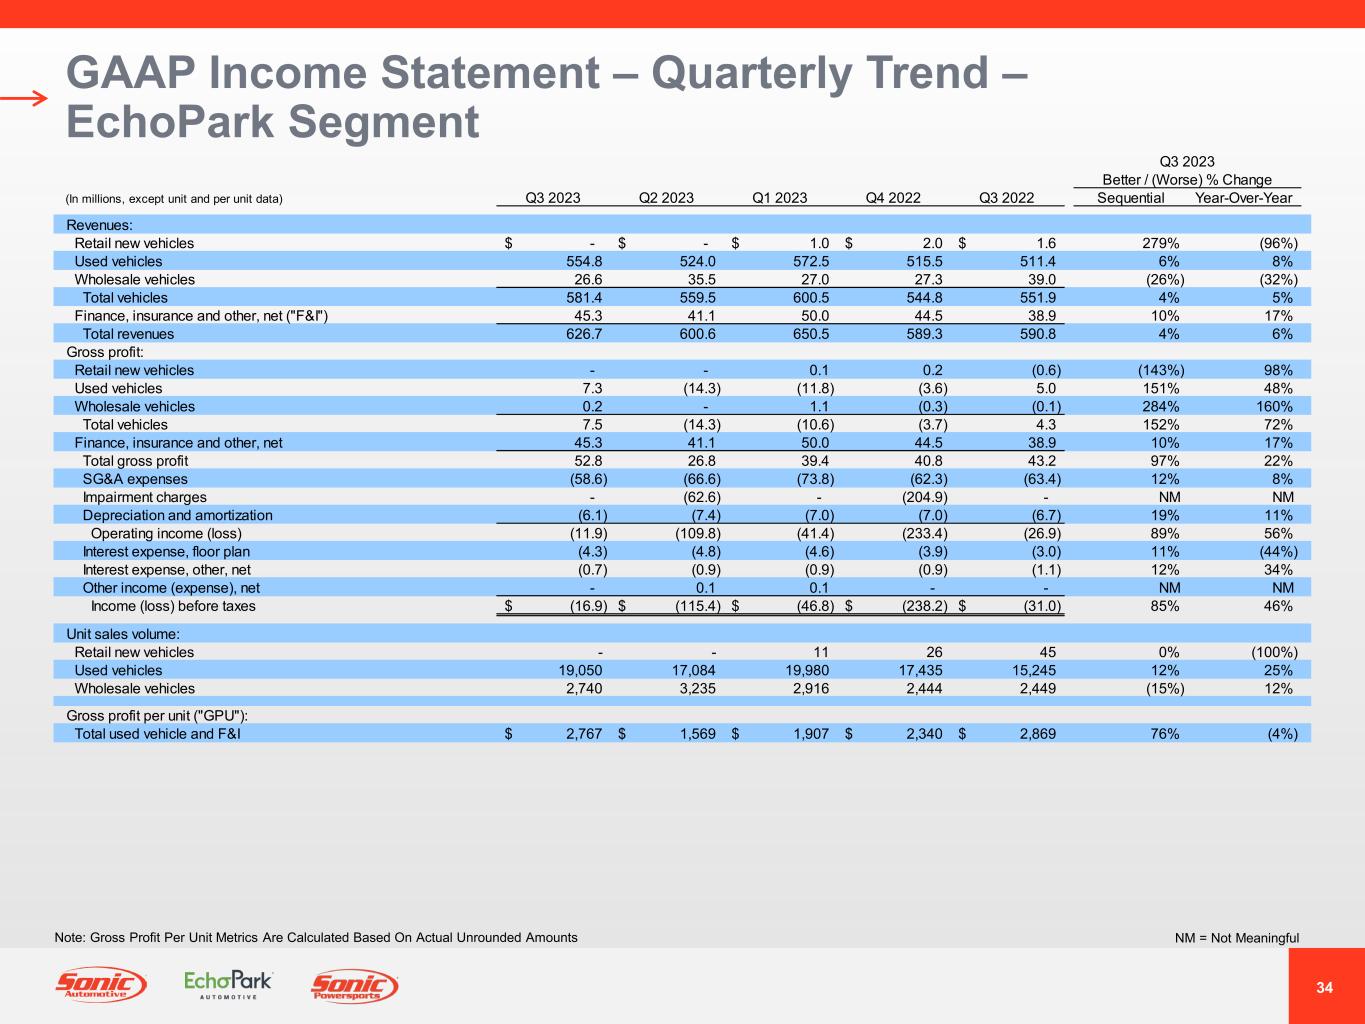
34 GAAP Income Statement – Quarterly Trend – EchoPark Segment NM = Not MeaningfulNote: Gross Profit Per Unit Metrics Are Calculated Based On Actual Unrounded Amounts Q3 2023 Better / (Worse) % Change (In millions, except unit and per unit data) Q3 2023 Q2 2023 Q1 2023 Q4 2022 Q3 2022 Sequential Year-Over-Year Revenues: Retail new vehicles -$ -$ 1.0$ 2.0$ 1.6$ 279% (96%) Used vehicles 554.8 524.0 572.5 515.5 511.4 6% 8% Wholesale vehicles 26.6 35.5 27.0 27.3 39.0 (26%) (32%) Total vehicles 581.4 559.5 600.5 544.8 551.9 4% 5% Finance, insurance and other, net ("F&I") 45.3 41.1 50.0 44.5 38.9 10% 17% Total revenues 626.7 600.6 650.5 589.3 590.8 4% 6% Gross profit: Retail new vehicles - - 0.1 0.2 (0.6) (143%) 98% Used vehicles 7.3 (14.3) (11.8) (3.6) 5.0 151% 48% Wholesale vehicles 0.2 - 1.1 (0.3) (0.1) 284% 160% Total vehicles 7.5 (14.3) (10.6) (3.7) 4.3 152% 72% Finance, insurance and other, net 45.3 41.1 50.0 44.5 38.9 10% 17% Total gross profit 52.8 26.8 39.4 40.8 43.2 97% 22% SG&A expenses (58.6) (66.6) (73.8) (62.3) (63.4) 12% 8% Impairment charges - (62.6) - (204.9) - NM NM Depreciation and amortization (6.1) (7.4) (7.0) (7.0) (6.7) 19% 11% Operating income (loss) (11.9) (109.8) (41.4) (233.4) (26.9) 89% 56% Interest expense, floor plan (4.3) (4.8) (4.6) (3.9) (3.0) 11% (44%) Interest expense, other, net (0.7) (0.9) (0.9) (0.9) (1.1) 12% 34% Other income (expense), net - 0.1 0.1 - - NM NM Income (loss) before taxes (16.9)$ (115.4)$ (46.8)$ (238.2)$ (31.0)$ 85% 46% Unit sales volume: Retail new vehicles - - 11 26 45 0% (100%) Used vehicles 19,050 17,084 19,980 17,435 15,245 12% 25% Wholesale vehicles 2,740 3,235 2,916 2,444 2,449 (15%) 12% Gross profit per unit ("GPU"): Total used vehicle and F&I 2,767$ 1,569$ 1,907$ 2,340$ 2,869$ 76% (4%)
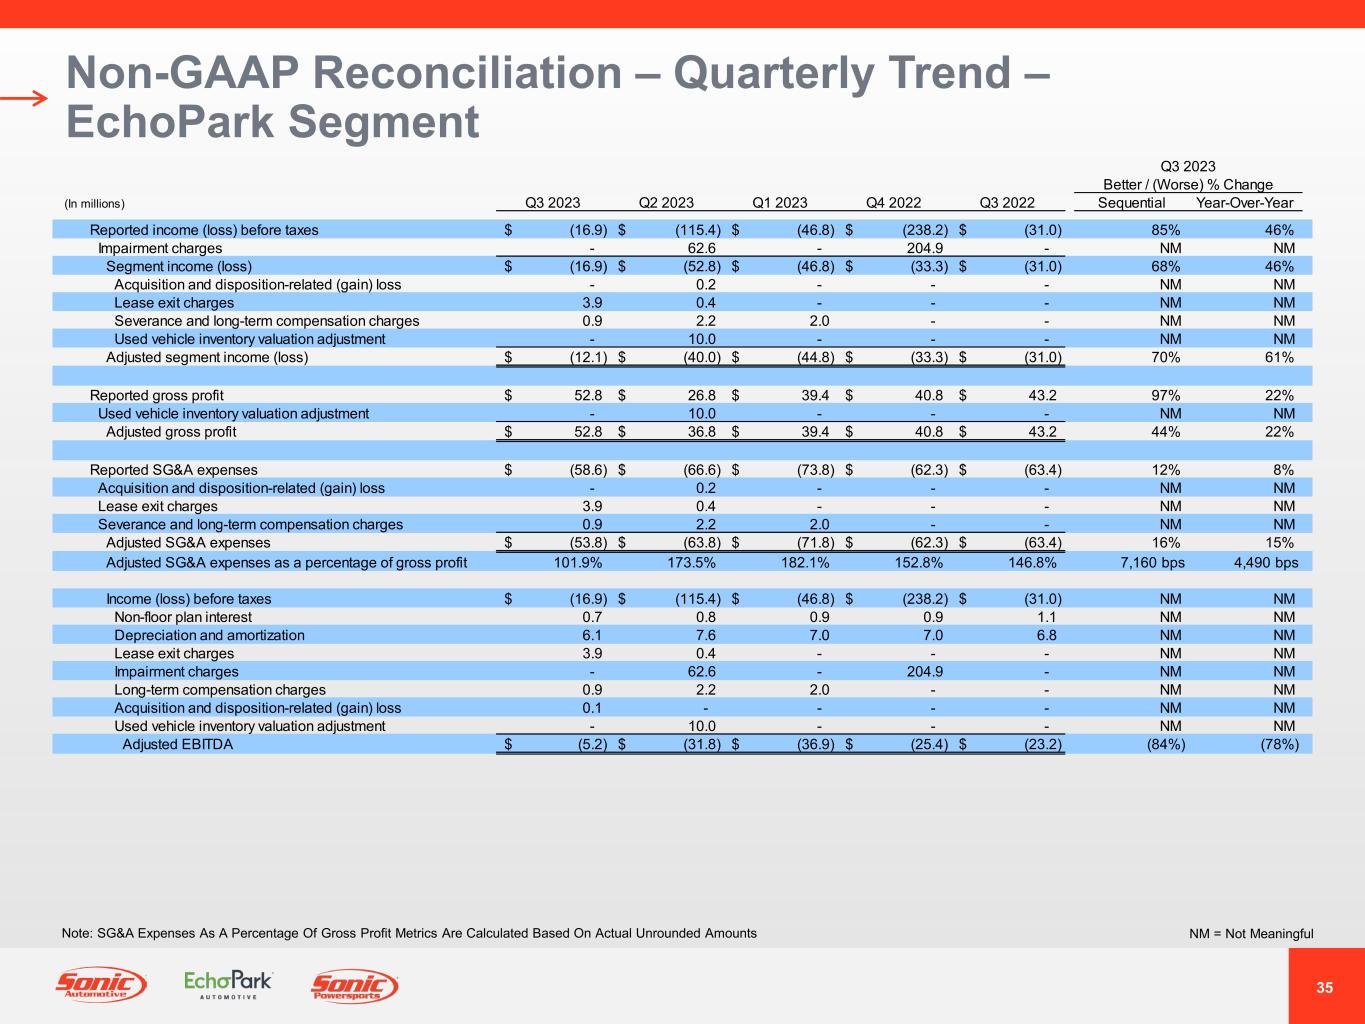
35 Non-GAAP Reconciliation – Quarterly Trend – EchoPark Segment NM = Not MeaningfulNote: SG&A Expenses As A Percentage Of Gross Profit Metrics Are Calculated Based On Actual Unrounded Amounts Q3 2023 Better / (Worse) % Change (In millions) Q3 2023 Q2 2023 Q1 2023 Q4 2022 Q3 2022 Sequential Year-Over-Year Reported income (loss) before taxes (16.9)$ (115.4)$ (46.8)$ (238.2)$ (31.0)$ 85% 46% Impairment charges - 62.6 - 204.9 - NM NM Segment income (loss) (16.9)$ (52.8)$ (46.8)$ (33.3)$ (31.0)$ 68% 46% Acquisition and disposition-related (gain) loss - 0.2 - - - NM NM Lease exit charges 3.9 0.4 - - - NM NM Severance and long-term compensation charges 0.9 2.2 2.0 - - NM NM Used vehicle inventory valuation adjustment - 10.0 - - - NM NM Adjusted segment income (loss) (12.1)$ (40.0)$ (44.8)$ (33.3)$ (31.0)$ 70% 61% Reported gross profit 52.8$ 26.8$ 39.4$ 40.8$ 43.2$ 97% 22% Used vehicle inventory valuation adjustment - 10.0 - - - NM NM Adjusted gross profit 52.8$ 36.8$ 39.4$ 40.8$ 43.2$ 44% 22% Reported SG&A expenses (58.6)$ (66.6)$ (73.8)$ (62.3)$ (63.4)$ 12% 8% Acquisition and disposition-related (gain) loss - 0.2 - - - NM NM Lease exit charges 3.9 0.4 - - - NM NM Severance and long-term compensation charges 0.9 2.2 2.0 - - NM NM Adjusted SG&A expenses (53.8)$ (63.8)$ (71.8)$ (62.3)$ (63.4)$ 16% 15% Adjusted SG&A expenses as a percentage of gross profit 101.9% 173.5% 182.1% 152.8% 146.8% 7,160 bps 4,490 bps Income (loss) before taxes (16.9)$ (115.4)$ (46.8)$ (238.2)$ (31.0)$ NM NM Non-floor plan interest 0.7 0.8 0.9 0.9 1.1 NM NM Depreciation and amortization 6.1 7.6 7.0 7.0 6.8 NM NM Lease exit charges 3.9 0.4 - - - NM NM Impairment charges - 62.6 - 204.9 - NM NM Long-term compensation charges 0.9 2.2 2.0 - - NM NM Acquisition and disposition-related (gain) loss 0.1 - - - - NM NM Used vehicle inventory valuation adjustment - 10.0 - - - NM NM Adjusted EBITDA (5.2)$ (31.8)$ (36.9)$ (25.4)$ (23.2)$ (84%) (78%)
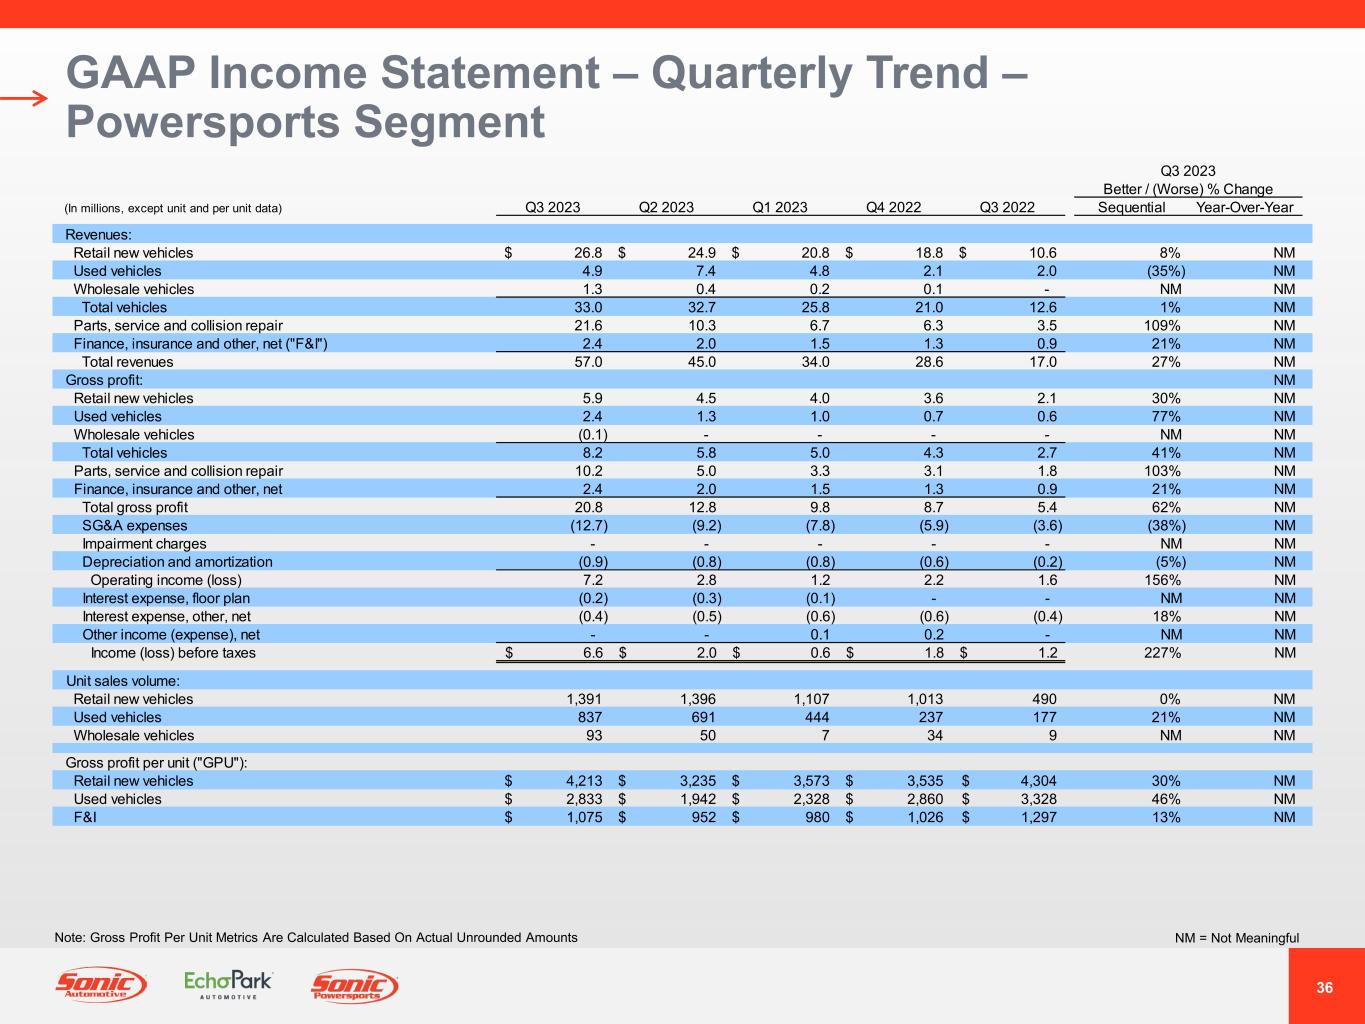
36 GAAP Income Statement – Quarterly Trend – Powersports Segment NM = Not MeaningfulNote: Gross Profit Per Unit Metrics Are Calculated Based On Actual Unrounded Amounts Q3 2023 Better / (Worse) % Change (In millions, except unit and per unit data) Q3 2023 Q2 2023 Q1 2023 Q4 2022 Q3 2022 Sequential Year-Over-Year Revenues: Retail new vehicles 26.8$ 24.9$ 20.8$ 18.8$ 10.6$ 8% NM Used vehicles 4.9 7.4 4.8 2.1 2.0 (35%) NM Wholesale vehicles 1.3 0.4 0.2 0.1 - NM NM Total vehicles 33.0 32.7 25.8 21.0 12.6 1% NM Parts, service and collision repair 21.6 10.3 6.7 6.3 3.5 109% NM Finance, insurance and other, net ("F&I") 2.4 2.0 1.5 1.3 0.9 21% NM Total revenues 57.0 45.0 34.0 28.6 17.0 27% NM Gross profit: NM Retail new vehicles 5.9 4.5 4.0 3.6 2.1 30% NM Used vehicles 2.4 1.3 1.0 0.7 0.6 77% NM Wholesale vehicles (0.1) - - - - NM NM Total vehicles 8.2 5.8 5.0 4.3 2.7 41% NM Parts, service and collision repair 10.2 5.0 3.3 3.1 1.8 103% NM Finance, insurance and other, net 2.4 2.0 1.5 1.3 0.9 21% NM Total gross profit 20.8 12.8 9.8 8.7 5.4 62% NM SG&A expenses (12.7) (9.2) (7.8) (5.9) (3.6) (38%) NM Impairment charges - - - - - NM NM Depreciation and amortization (0.9) (0.8) (0.8) (0.6) (0.2) (5%) NM Operating income (loss) 7.2 2.8 1.2 2.2 1.6 156% NM Interest expense, floor plan (0.2) (0.3) (0.1) - - NM NM Interest expense, other, net (0.4) (0.5) (0.6) (0.6) (0.4) 18% NM Other income (expense), net - - 0.1 0.2 - NM NM Income (loss) before taxes 6.6$ 2.0$ 0.6$ 1.8$ 1.2$ 227% NM Unit sales volume: Retail new vehicles 1,391 1,396 1,107 1,013 490 0% NM Used vehicles 837 691 444 237 177 21% NM Wholesale vehicles 93 50 7 34 9 NM NM Gross profit per unit ("GPU"): Retail new vehicles 4,213$ 3,235$ 3,573$ 3,535$ 4,304$ 30% NM Used vehicles 2,833$ 1,942$ 2,328$ 2,860$ 3,328$ 46% NM F&I 1,075$ 952$ 980$ 1,026$ 1,297$ 13% NM
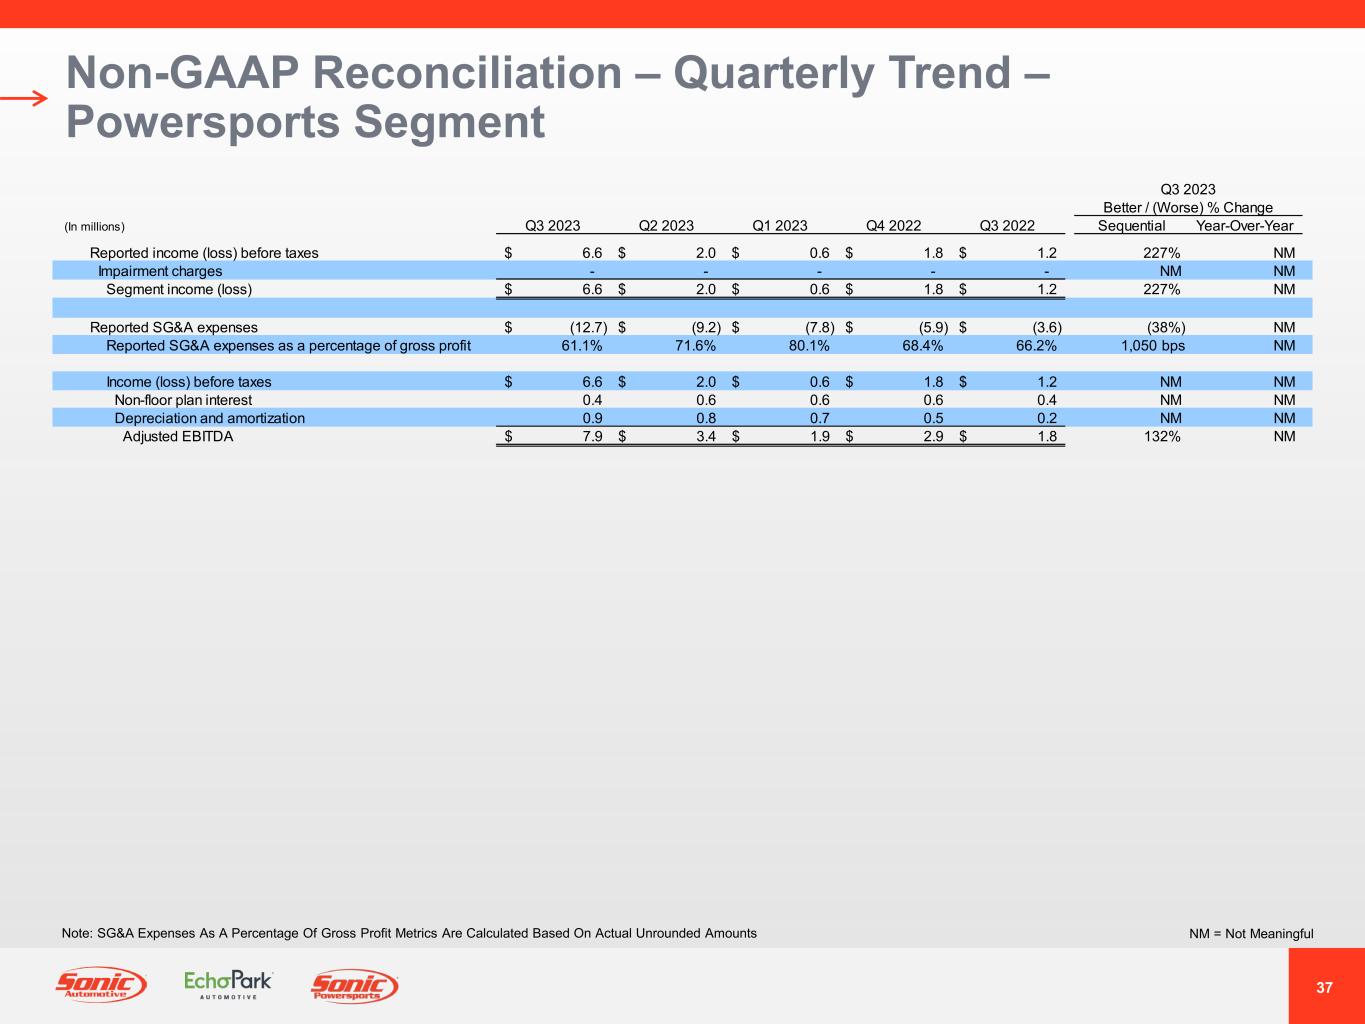
37 Non-GAAP Reconciliation – Quarterly Trend – Powersports Segment NM = Not MeaningfulNote: SG&A Expenses As A Percentage Of Gross Profit Metrics Are Calculated Based On Actual Unrounded Amounts Q3 2023 Better / (Worse) % Change (In millions) Q3 2023 Q2 2023 Q1 2023 Q4 2022 Q3 2022 Sequential Year-Over-Year Reported income (loss) before taxes 6.6$ 2.0$ 0.6$ 1.8$ 1.2$ 227% NM Impairment charges - - - - - NM NM Segment income (loss) 6.6$ 2.0$ 0.6$ 1.8$ 1.2$ 227% NM Reported SG&A expenses (12.7)$ (9.2)$ (7.8)$ (5.9)$ (3.6)$ (38%) NM Reported SG&A expenses as a percentage of gross profit 61.1% 71.6% 80.1% 68.4% 66.2% 1,050 bps NM Income (loss) before taxes 6.6$ 2.0$ 0.6$ 1.8$ 1.2$ NM NM Non-floor plan interest 0.4 0.6 0.6 0.6 0.4 NM NM Depreciation and amortization 0.9 0.8 0.7 0.5 0.2 NM NM Adjusted EBITDA 7.9$ 3.4$ 1.9$ 2.9$ 1.8$ 132% NM
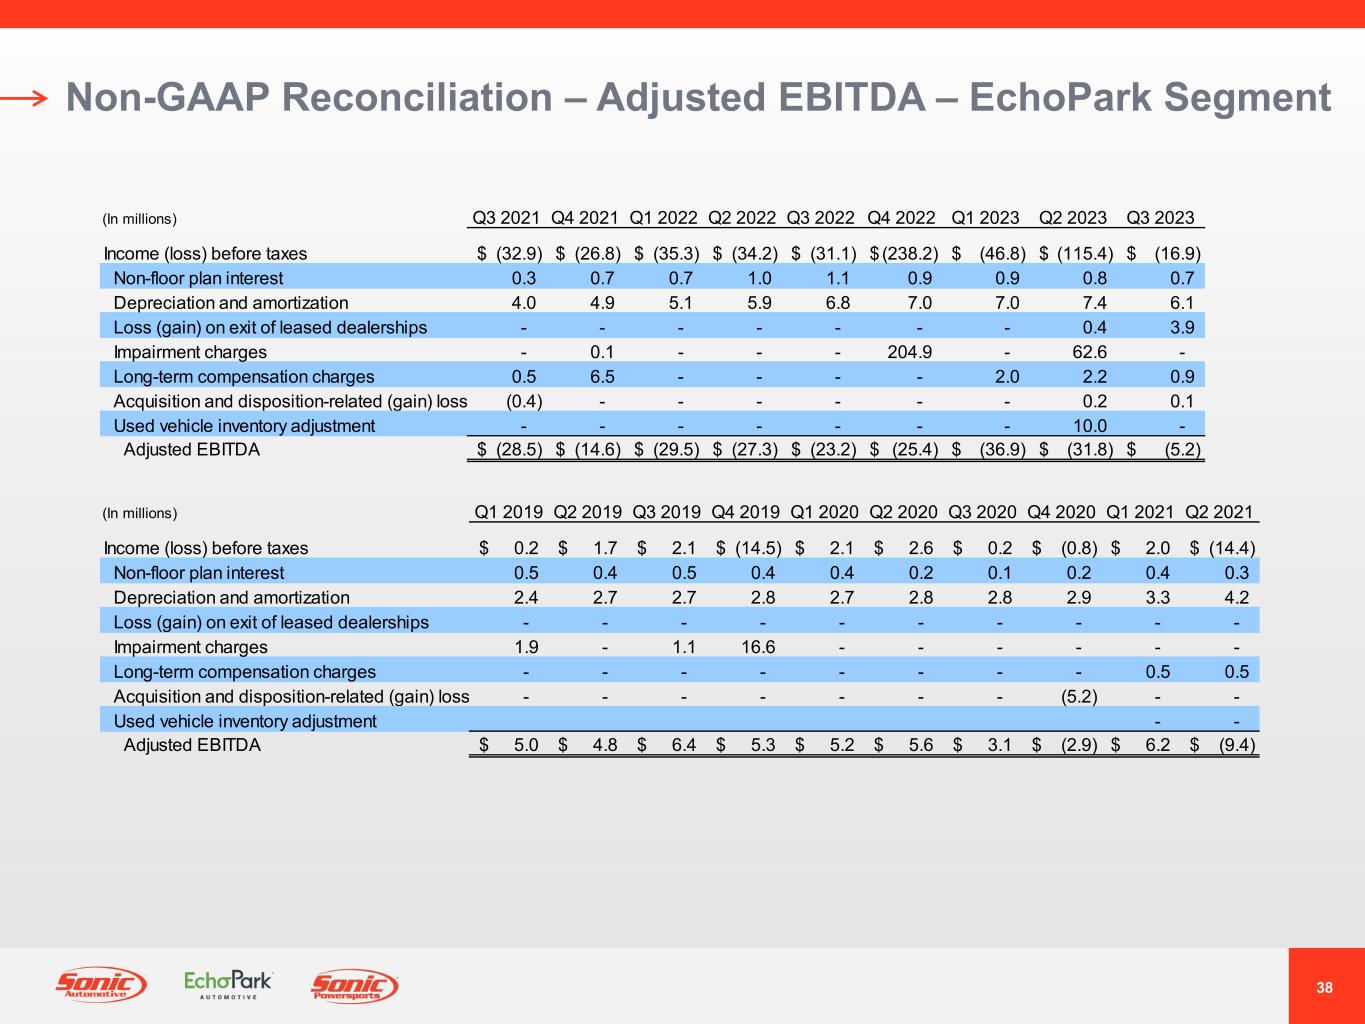
38 Non-GAAP Reconciliation – Adjusted EBITDA – EchoPark Segment (In millions) Q1 2019 Q2 2019 Q3 2019 Q4 2019 Q1 2020 Q2 2020 Q3 2020 Q4 2020 Q1 2021 Q2 2021 Income (loss) before taxes 0.2$ 1.7$ 2.1$ (14.5)$ 2.1$ 2.6$ 0.2$ (0.8)$ 2.0$ (14.4)$ Non-floor plan interest 0.5 0.4 0.5 0.4 0.4 0.2 0.1 0.2 0.4 0.3 Depreciation and amortization 2.4 2.7 2.7 2.8 2.7 2.8 2.8 2.9 3.3 4.2 Loss (gain) on exit of leased dealerships - - - - - - - - - - Impairment charges 1.9 - 1.1 16.6 - - - - - - Long-term compensation charges - - - - - - - - 0.5 0.5 Acquisition and disposition-related (gain) loss - - - - - - - (5.2) - - Used vehicle inventory adjustment - - Adjusted EBITDA 5.0$ 4.8$ 6.4$ 5.3$ 5.2$ 5.6$ 3.1$ (2.9)$ 6.2$ (9.4)$ (In millions) Q3 2021 Q4 2021 Q1 2022 Q2 2022 Q3 2022 Q4 2022 Q1 2023 Q2 2023 Q3 2023 Income (loss) before taxes (32.9)$ (26.8)$ (35.3)$ (34.2)$ (31.1)$ (238.2)$ (46.8)$ (115.4)$ (16.9)$ Non-floor plan interest 0.3 0.7 0.7 1.0 1.1 0.9 0.9 0.8 0.7 Depreciation and amortization 4.0 4.9 5.1 5.9 6.8 7.0 7.0 7.4 6.1 Loss (gain) on exit of leased dealerships - - - - - - - 0.4 3.9 Impairment charges - 0.1 - - - 204.9 - 62.6 - Long-term compensation charges 0.5 6.5 - - - - 2.0 2.2 0.9 Acquisition and disposition-related (gain) loss (0.4) - - - - - - 0.2 0.1 Used vehicle inventory adjustment - - - - - - - 10.0 - Adjusted EBITDA (28.5)$ (14.6)$ (29.5)$ (27.3)$ (23.2)$ (25.4)$ (36.9)$ (31.8)$ (5.2)$

® Investor Relations Contact: Danny Wieland, Vice President, Investor Relations & Financial Reporting Sonic Automotive Inc. (NYSE: SAH) Email: ir@sonicautomotive.com Investor Relations Website: ir.sonicautomotive.com