Exhibit 99.2
| Exhibit 99.2 |
 Cautionary Notice Regarding Forward-Looking Statements • This presentation contains statements that constitute
“forward-looking statements” within the meaning of Section 27A of the Securities Act of 1933 and Section 21E of the Securities Exchange Act of 1934. • These forward-looking statements are not historical facts, but only
predictions by our company and/or our company’s
management. • These statements generally can be identified by lead-in words such as
“believe,” “except” “anticipate,” “intend,” “plan,” “foresee” and other similar words. Similarly, statements that describe our company’s objectives, plans or
goals are also forward-looking statements. • You are cautioned that these forward-looking statements are not
guarantees of future performance and involve risks and
uncertainties, and that actual results may differ materially from those projected in the forward-looking
statements as a results of various factors. Among others,
factors that could materially adversely affect actual results
and performance include those risk factors that are listed in
Sonic Automotive’s Form 10-K for the year ended December 31, 2005. |
 Sonic Automotive First Quarter 2006 Earnings Review April 25, 2006 |
 The Quarter in Review • Net income of $21.8 million from continuing operations, up 9% from year ago. Improvement driven by revenue growth and cost reductions. Continuing operations diluted EPS of $0.50 includes $0.02 charge for stock options. • Operating profit was up 19% to $59.7 million, and was 3.3% of revenue (up 20 basis points from 2005) • SG&A as a percent of gross was 77.8% -- 90 basis points better than Q1 2005 • Continued portfolio enrichment strategy – Luxury volume now 51% of total; Combined Luxury & Import total of 80% • Used car initiatives beginning to take hold • Strong performance – more to come 1 |
 Financial Performance 2 O/(U) (amounts in millions, except per share data) Q1 2006 Q1 2005 Revenue $1,836 $240 Gross Profit $291 $40 Operating Profit $60 $10 Net Income – Continuing Operations $21.8 $1.8 – Total Operations 17.1 - EPS – Continuing Operations $0.50 * $0.03 – Total Operations 0.39 (0.01) * Includes stock option expense of $0.02 |
 Same Store Results • Strong revenue and profit growth across all business lines despite a
challenging industry environment • Gross profit margin improved to 15.9%, up from 15.7% last year • Sonic’s new vehicle same store results outperformed the industry
3 First Quarter 2006 Over Prior Year Revenue Gross Profit New 5.4% 7.6% Used 9.0% 9.1% Parts & Service 7.4% 7.6% F&I 6.4% 6.4% Total 6.5% 7.5% |
 Used Vehicles • Implementing used vehicle best practices and inventory management technology • Focus on market at both ends Certified Pre-Owned Value Vehicles 4 March MTD Used Retail Volume chg. 2006 vs. 2005 Used/New Ratio 2006 Used/New Ratio 2005 Champion Stores 22.3% 0.61 0.47 Other Same Store 9.9% 0.48 0.45 Memo: Full year Sector leaders 0.62 |
 Portfolio Enrichment • Portfolio enrichment continues, driven by our acquisition strategy and
strong growth in luxury and import demand. • Acquire to enrich portfolio mix and replace lost revenue • Focus on stable dealerships with upside 5 Q1 2006 Q1 2005 % of Total Revenues Luxury and Import 70% 67% Cadillac 10% 11% Subtotal 80% 78% Other Domestic 19% 21% Non-Franchised 1% 1% Total 100% 100% Memo: Luxury Including Cadillac 51% 48% |
 Discontinued Operations • We are in the second year of our portfolio enrichment strategy • Proceeds from the sale of discontinued operations will be reinvested in
new, higher-margin import and luxury stores • Acquisition revenue for 2006 projected at $400-$700 million 6 Q1 2006 Q1 2005 (amounts in millions except per share data) After-tax Loss EPS After-tax Loss EPS Loss from Operations (2.0) $ (0.04) $ (2.4) $ (0.05) $ Other Impacts: Loss on Sale (0.1) - (0.6) (0.02) Impairment / lease terminations (2.6) (0.07) - - Loss from Discontinued Operations, as Reported (4.7) $ (0.11) $ (3.0) $ (0.07) $ |
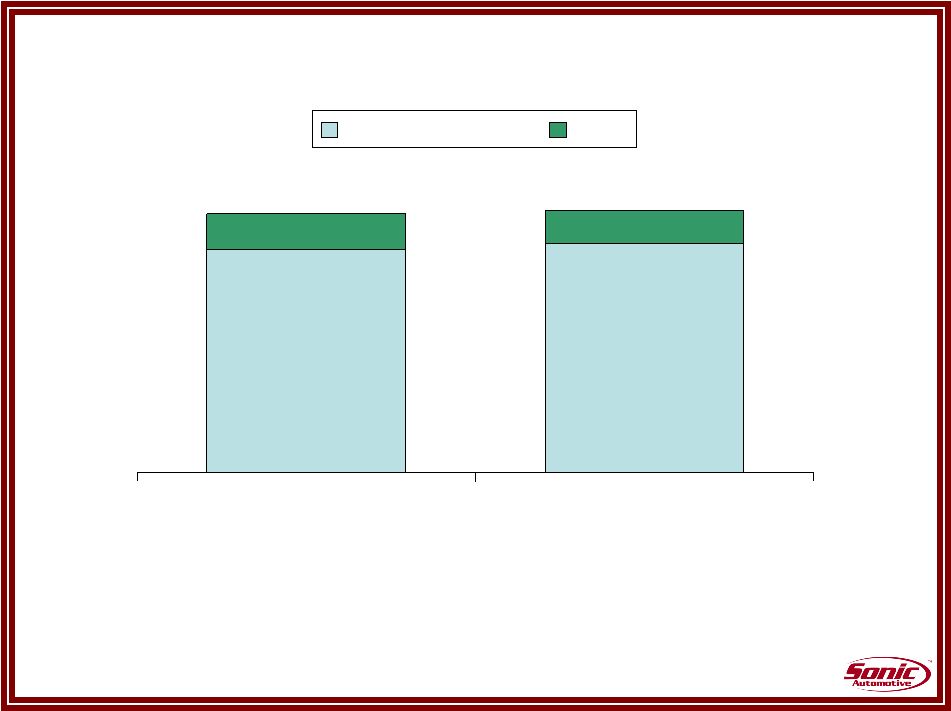 SG&A Expenses as % of Gross Profit • Reduced SG&A as a percentage of gross profit by 90 basis points
– worth $3 million • Improvements made in advertising, compensation and other operating
expenses 77.8% 78.7% 7 69.9% 71.2% 7.9% 7.5% Q1 2006 Q1 2005 All Other SG&A Rent |
 Interest • Higher rates have increased interest costs. • A further 25bps increase is assumed in our earnings guidance. 8 Q1 Q1 2006 2005 Change $ Millions Floorplan Interest Expense 12.1 $ 7.4 $ (4.7) $ Other Interest Expense 11.7 $ 10.6 $ (1.1) $ |
 Inventory Management Days Supply Mar-06 Mar-05 Dec-05 Mar-06 Industry New Vehicles Domestic (excluding Cadillac) 69 58 63 80 Luxury (including Cadillac) 48 41 48 53 Import 44 38 47 51 Overall 56 48 53 67 Used Vehicles 39 40 40 Parts 35 36 35 9 |
 Summary • Strong results posted for the quarter • Improvements achieved in volume, mix of business and cost structure • Further opportunity in portfolio enrichment, SG&A expenses and used vehicle sales; interest cost remains a drag on earnings • We have a clear strategy and we are executing 2006 Continuing Operations Diluted EPS Guidance $2.40 - $2.50 (excluding stock option expense) $2.32 – $2.42 (including stock option expense) 10 |
 |