Exhibit 99.2
| Exhibit 99.2 |
 Cautionary Notice Regarding Forward-Looking Statements • This presentation contains statements that constitute
“forward-looking statements” within the meaning of Section 27A of the Securities Act of 1933 and Section 21E of the Securities Exchange Act of 1934. • These forward-looking statements are not historical facts, but only
predictions by our company and/or our company’s
management. • These statements generally can be identified by lead-in words such as
“believe,” “except” “anticipate,” “intend,” “plan,” “foresee” and other similar words. Similarly, statements that describe our company’s objectives, plans or
goals are also forward-looking statements. • You are cautioned that these forward-looking statements are not
guarantees of future performance and involve risks and
uncertainties, and that actual results may differ materially from those projected in the forward-looking
statements as a results of various factors. Among others,
factors that could materially adversely affect actual results
and performance include those risk factors that are listed in
Sonic Automotive’s Form 10-Q for the quarter ended March 31, 2006. |
 Sonic Automotive Second Quarter 2006 Earnings Review August 2, 2006 |
 The Quarter in Review • Total revenue increased $181 million, or 9.8%, for the quarter. Total same store revenue increased 3.7% driven by used vehicles increase of 15% and fixed operations growth of 5.5% • Brand mix continues to drive results – Luxury was 49.4% of total revenues – Combined luxury and import brands were 81.7% – Operating profit before Q2 charges was 3.8% • SG&A as a percent of gross profit improved 130 basis points before considering Q2 charges • Debt to cap declined 210 basis points to end the quarter at 42.3% 1 |
 Financial Performance 2 Better/(Worse) Better/(Worse) (amounts in millions, except per share data) 2006 Than 2005 2006 Than 2005 Revenue $2,034 $181 $3,881 $424 Gross Profit $308 $29 $600 $70 Operating Profit $59 $(6) $118 4 Net Income – Continuing Operations $18.6 $(9.7) $40.3 $(7.6) – Total Operations 12.2 (14.8) 29.3 (14.8) EPS – Continuing Operations $0.42 * $(0.22) $0.92 * $(0.19) – Total Operations 0.29 (0.33) 0.68 (0.34) * Includes stock option expense of $0.01 for the quarter and $0.03 YTD Q2 YTD Note: Q2 2006 results include $27.6 million ($0.27 per share
continuing operations and $0.11 per share discontinued
operations) of charges related primarily to the Company’s decision to exit various facility leases and cancel certain facility improvement projects. |
 Same Store Results • Solid results overall driven by strong used vehicle and fixed operations
performance • Sonic’s new vehicle same store results continue to outperform the
industry • F&I same store revenue and gross profit growth without the Q2
reserve adjustment was 10.1% Second Quarter 2006 vs Prior Year Revenue Gross Profit New 2.0% 3.3% Used 15.0% 13.6% Fixed Operations 5.5% 6.6% F&I (2.5)% (2.5)% Total 3.7% 4.3% 3 |
 Used Vehicles • Growth at our Champion stores continues to outperform our other stores • Certified pre-owned sales were 34.7% of our overall unit sales
Overall Same Store Revenue Growth (vs Q2 2005) 20.9% 15.0% % of total revenue 16.6% 16.8% Gross Profit Growth (vs Q2 2005) 21.4% 13.6% Gross Margin 10.4% 10.4% 4 |
 Fixed Operations Q2 2006 Revenue Growth Overall 13.5% Same Store 5.5% Gross Profit Growth Overall 14.8% Same Store 6.6% Dealership level fixed absorption 88.2% 5 |
 Portfolio Enrichment • Portfolio enrichment continues, driven by our acquisition strategy and
strong growth in luxury and import sales. 6 Q2 2006 Q2 2005 % of Total Revenues Luxury and Import 74% 69% Cadillac 8% 11% Subtotal 82% 80% Other Domestic 17% 19% Non-Franchised 1% 1% Total 100% 100% Memo: Luxury Including Cadillac 49% 48% |
 Large Adjustments 7 F&I Per Unit Gross Margin SG&A to Gross Continuing Operations Discontinued Operations $ Impact BP Impact BP Impact Real estate and other asset impairments/writeoffs and lease exit accruals - - 280 0.14 $ 0.10 $ Finance chargeback reserves 121 $ 30 160 0.08 - Legal accruals - - 20 0.03 0.01 Effective income tax rate adjustment - - - 0.02 - Total 121 $ 30 460 0.27 $ 0.11 $ EPS Impact |
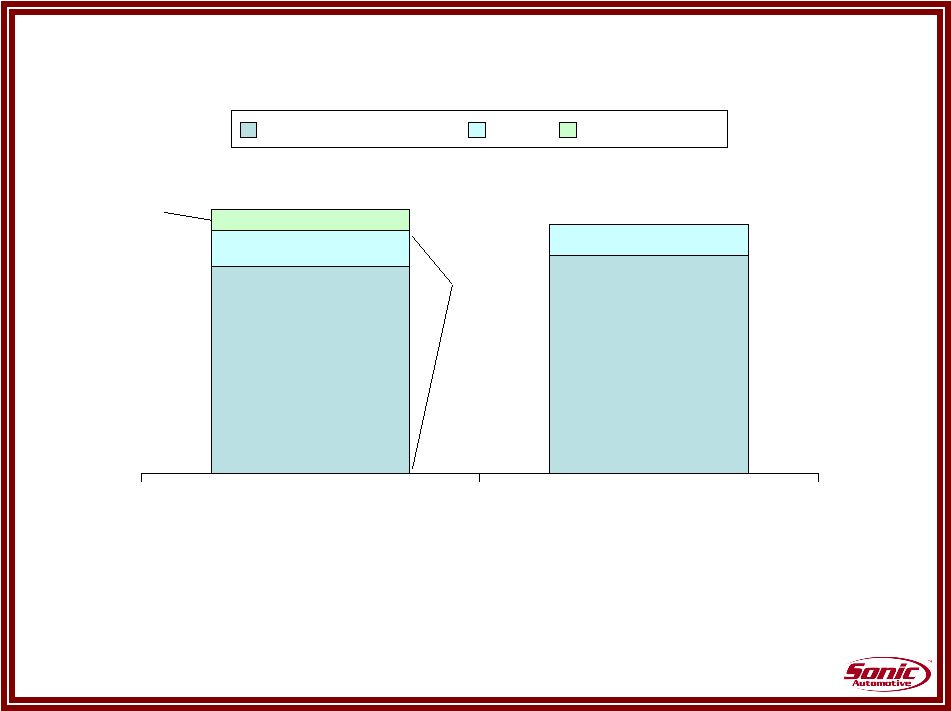 SG&A Expenses as % of Gross Profit Q2 2006 Q2 2005 All Other SG&A Rent Q2 Charges 78.7% 75.4% 8 4.6% 8.0% 66.1% 7.0% 68.4% •Continued improvements in variable compensation and other operating expenses •Favorable brand mix should continue to improve this metric 74.1% |
 Inventory Management Days Supply 9 Jun-06 Jun-05 Dec-05 Jun-06 Industry New Vehicles Domestic (excluding Cadillac) 54 58 58 80 Luxury (including Cadillac) 43 41 49 51 Import 41 38 43 47 Overall 47 48 50 65 Used Vehicles 40 40 37 Parts 36 36 35 |
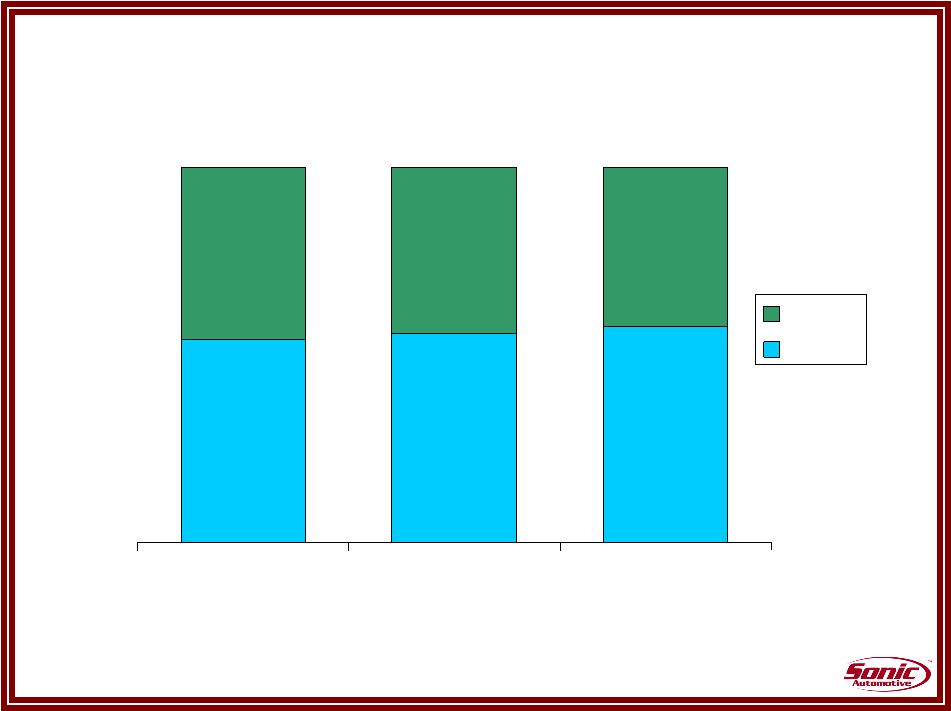 Capitalization 54.0% 55.6% 57.7% 46.0% 44.4% 42.3% Q4 2005 Q1 2006 Q2 2006 Debt Equity 10 100% 100% 100% |
 Summary • Core operating trends remain strong – Continue our used vehicle sales initiative – Stall capacity and best practices should drive fixed operations
growth • Brand mix continues to drive improvements, especially in the higher margin segments of the business • Expense reduction trends continue, driven by brand mix and process improvement • Continued progress on leverage goals 11 |
 |