 Exhibit 99.2 |
| Exhibit 99.2 |
 Cautionary Notice Regarding Forward-Looking Statements • This presentation contains statements that constitute
“forward-looking statements” within the meaning of Section 27A of the Securities Act of 1933 and Section 21E of the Securities Exchange Act of 1934. • These forward-looking statements are not historical facts, but only
predictions by our company and/or our company’s
management. • These statements generally can be identified by lead-in words such as
“believe,” “expect,” “anticipate,” “intend,” “plan,” “foresee” and other similar words. Similarly, statements that describe our company’s objectives, plans or
goals are also forward-looking statements. • You are cautioned that these forward-looking statements are not
guarantees of future performance and involve risks and
uncertainties, and that actual results may differ materially from those projected in the forward-looking
statements as a results of various factors. Among others,
factors that could materially adversely affect actual results
and performance include those risk factors that are listed in
Sonic Automotive’s Form 10-Q for the quarter ended June 30, 2006. |
 Sonic Automotive Third Quarter 2006 Earnings Review October 31, 2006 |
 The Quarter in Review • Total revenue increased $144 million, or 7.5%. Same store revenue increased 2.8% driven by a used vehicle sales increase of 4.7% and fixed operations growth of 5.1% • Brand mix continues to drive results – Luxury near 50% of total revenues – Combined luxury and import brands were 82% – Operating profit margin was 3.6% • SG&A as a percent of gross profit improved 90 basis points to 74.7% • Debt-to-capital ratio declined 600 basis points from year end 2005 to end the quarter at 40.0% 1 |
 Financial Performance Better/(Worse) (amounts in millions, except per share data) 2006 Than 2005 Revenue $2,068 $144 Gross Profit $317 $26 Operating Profit $75 $8 Net Income – Continuing Operations $29.1 $0.5 – Total Operations 28.6 1.8 EPS – Continuing Operations $0.66 * $0.01 – Total Operations 0.65 0.04 * Includes stock option expense of $0.01 for the quarter Q3 2 |
 Financial Performance Better/(Worse) (amounts in millions) 2006 Than 2005 Revenue $2,068 7.5% Gross Profit $317 8.9% - Margin 15.3% 20 bps Operating Profit $75 11.8% - Margin 3.6% 10 bps Interest Expense $26 (27.6%) Net Income - Continuing Operations $29 1.8% Q3 • Operating performance is very strong Revenue up nearly 8% Gross profit and operating profit up even more; margins improved Fixed operations and cost control are big drivers • Higher interest cost driven by rates • Net income up nearly 2% Up $5.6M Up $7.8M 3 |
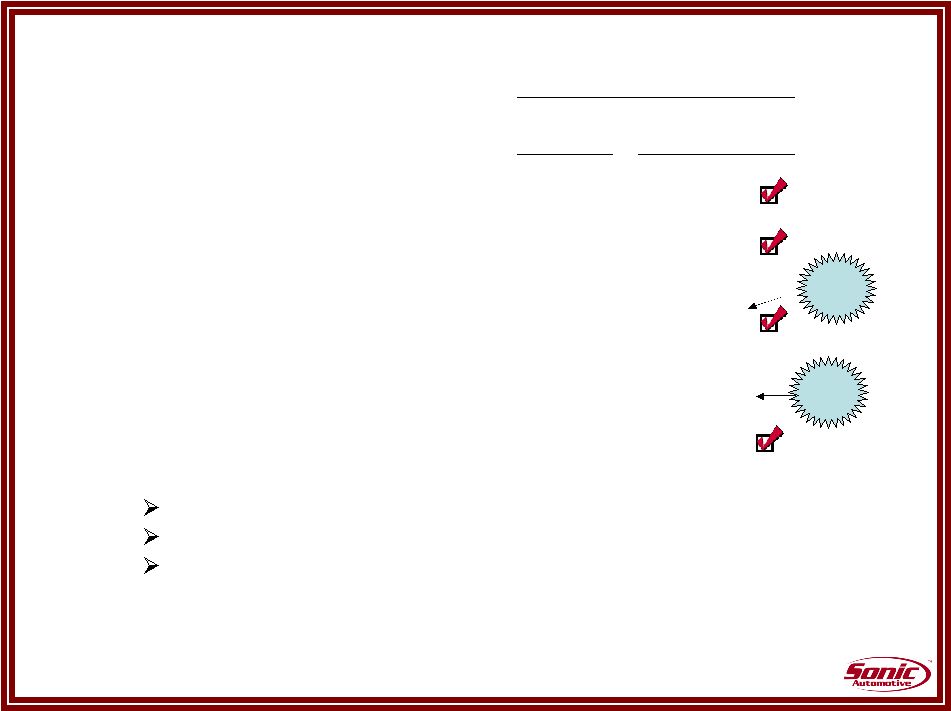
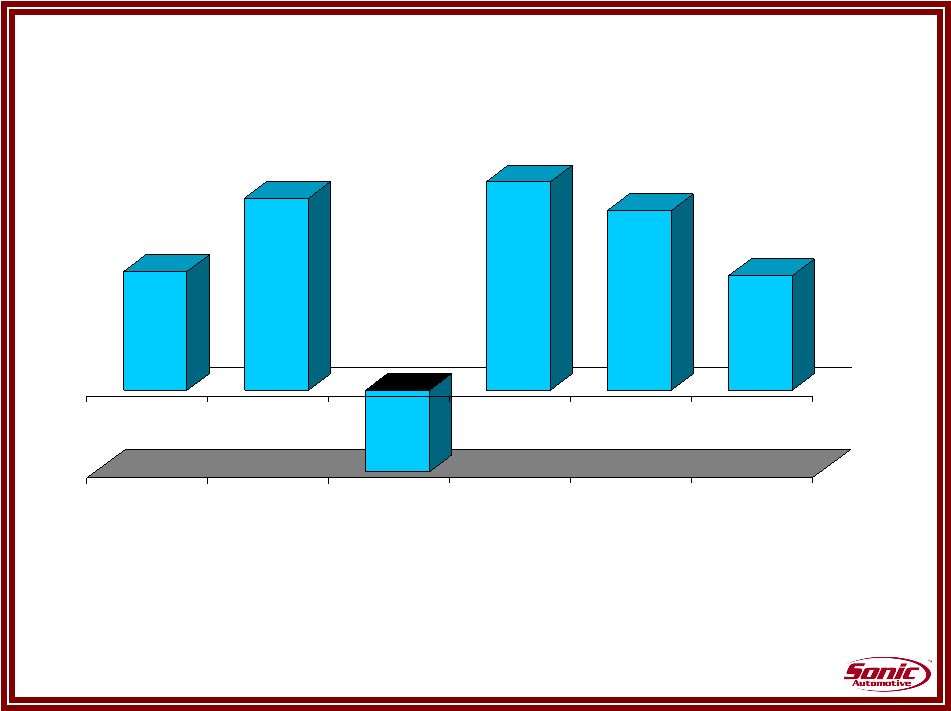 Same Store Revenue Growth • Solid results overall driven by strong used vehicle and fixed operations
performance • Sonic’s new vehicle same store results continue to outperform the
industry 2.9% 4.7% (8.7%) 5.1% 4.4% 2.8% New Used Wholesale Fixed Operations F&I Total 4 |
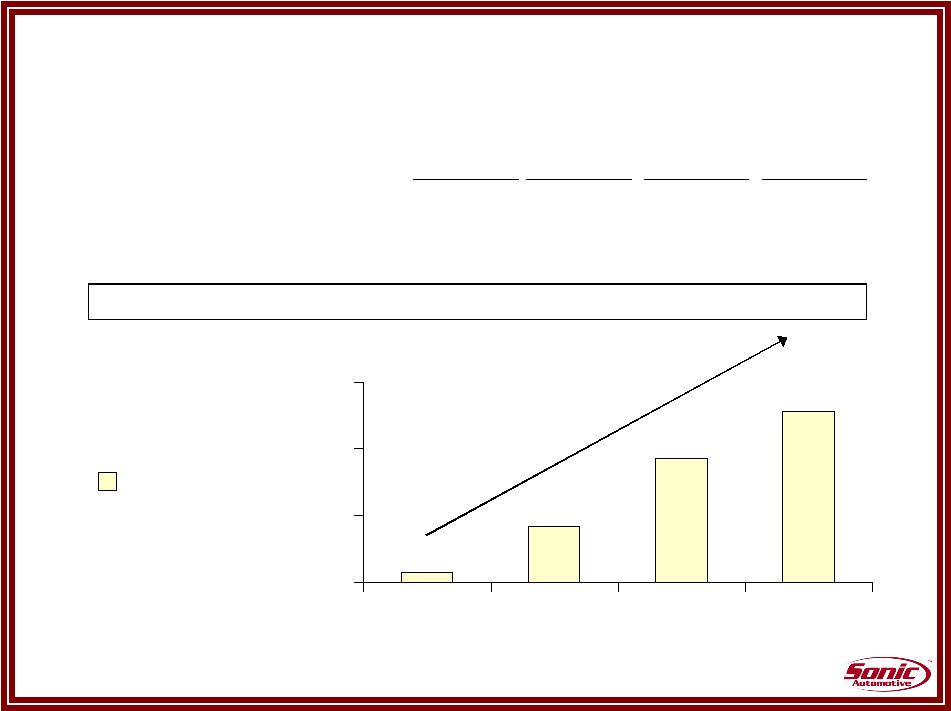 Used Vehicles Sonic vs. Franchised 1.4Pts 8.4Pts 18.7Pts 25.6Pts 0.0 10.0 20.0 30.0 2005 Q1 06 Q2 06 Q3 06 Sonic vs. Franchised Industry data provided by CNW Market Research Year over Year Retail Volume Change 2005 Q1 Q2 Q3 Same Store - Program n/a 22.7% 25.2% 6.0% Total Same Store 4.5% 3.8% 12.2% 2.2% Nat'l Franchised Dealers 3.1% -4.6% -6.5% -23.4% Sonic vs. Franchised 1.4Pts 8.4Pts 18.7Pts 25.6Pts 5 |
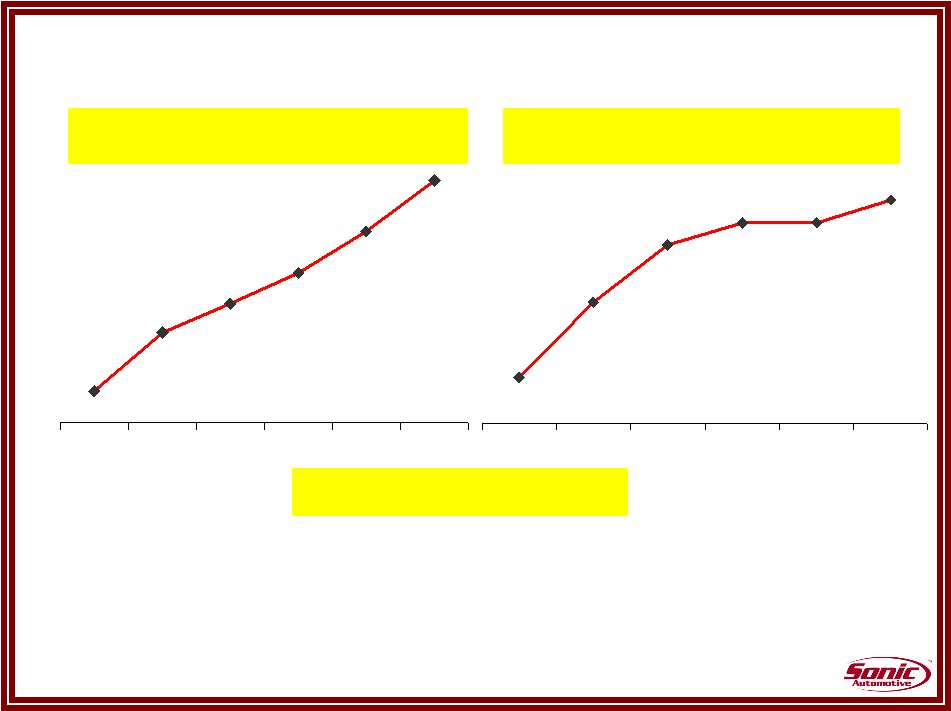 $728 $830 $413 $585 $646 $528 2001 2002 2003 2004 2005 2006 46.8% 49.9% 49.5% 49.1% 49.5% 48.1% 2001 2002 2003 2004 2005 2006 REVENUE ($ in millions) 9 Months Ended Each Year GROSS MARGIN RATE 9 Months Ended Each Year Parts, Service and Collision Repair • Consistent and improving performance • Grow service capacity in high margin brands • Continue to expand service stall capacity •Fixed Absorption was 89.6% in the third quarter Operating Initiatives * Q3 - 50.0% 6 |
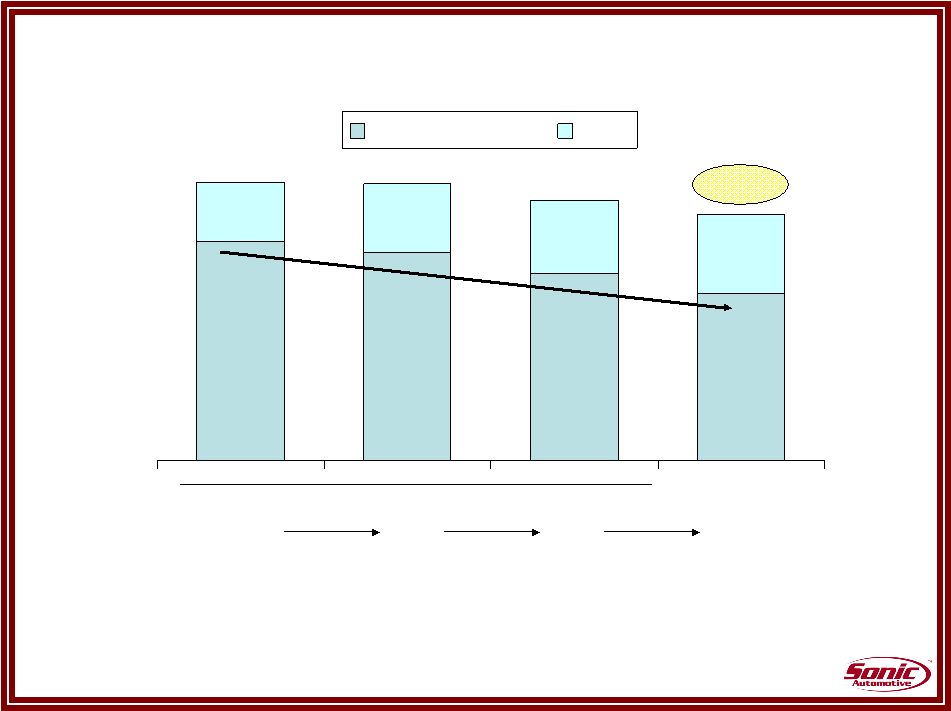 SG&A Expenses as % of Gross Profit 2003 2004 2005 2006 All Other SG&A Rent 6.0% 71.9% 7.9% •Continued improvements in compensation and other operating
expenses •Favorable brand mix should continue to improve
this metric •Continue to reduce our controllable expense – Operating improvements are gaining traction 6.9% 7.3% 70.9% 68.8% 66.8% 12 Months Ended December 31, Q3 77.9% 77.8% 76.1% 74.7% Fixed Absorption - 82.1% 83.8% 86.2% 89.6% 7 |
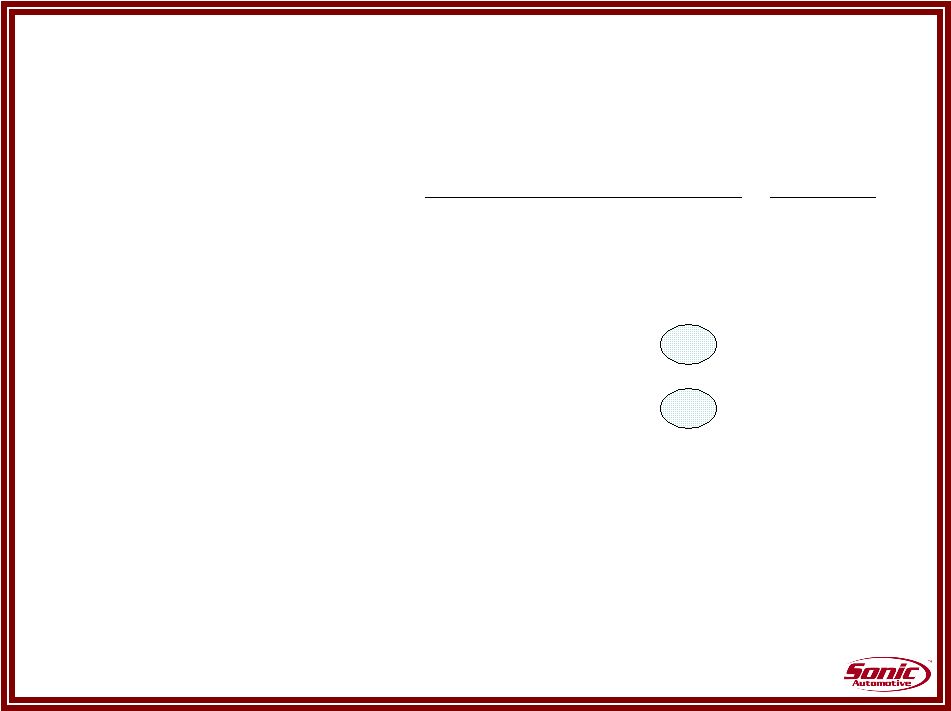 Inventory Management Days Supply Sep-06 Sep-05 Dec-05 Sep-06 Industry New Vehicles Domestic (excluding Cadillac) 50 59 55 77 Luxury (including Cadillac) 37 41 46 47 Import 31 38 37 43 Overall 39 48 44 61 Used Vehicles 37 40 33 Parts 35 36 34 8 |
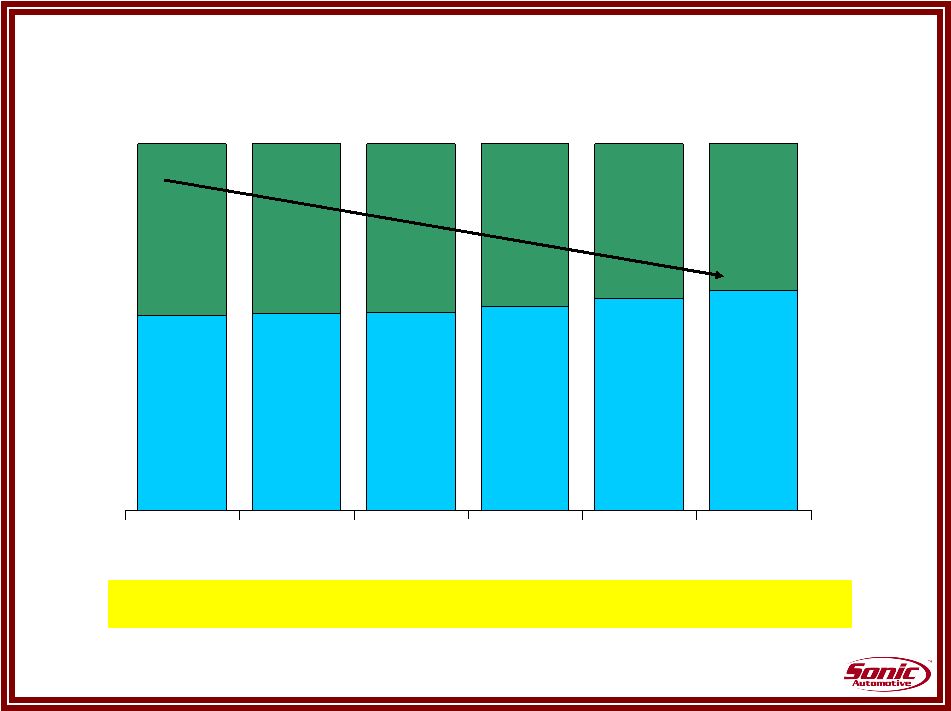 Capitalization 57.7% 55.6% 54.0% 53.8% 53.2% 60.0% 46.8% 46.2% 46.0% 44.4% 42.3% 40.0% 2003 2004 2005 Q1 2006 Q2 2006 Q3 2006 100% 100% 100% 100% 100% 100% Debt Equity ****Achieved 40% Target For Debt-To-Capital**** 9 |
 Portfolio Enrichment • Portfolio enrichment continues, driven by our acquisition strategy and
strong growth in luxury and import sales. YTD Sept 2005 YTD Sept 2006 % of Total Revenues Luxury and Import 69% 72% Cadillac 10% 10% Subtotal 79% 82% Other Domestic 20% 17% Non-Franchised 1% 1% Total 100% 100% Memo: Luxury Including Cadillac 48% 50% 10 |
 Summary • Core operating trends remain strong – Continue our used vehicle sales initiative – Stall capacity and best practices should drive fixed operations
growth • Brand mix continues to drive improvements, especially in the higher margin segments of the business • Expense reduction trends continue, driven by process improvement and brand mix • Continued progress on strengthening our balance sheet 11 |
 |