 1 Exhibit 99.2 |
 1 Exhibit 99.2 |
 Cautionary Notice Regarding Forward-Looking Statements • This presentation contains statements that constitute
“forward-looking statements” within the meaning of Section 27A of the Securities Act of 1933 and Section 21E of the Securities Exchange Act of 1934. • These forward-looking statements are not historical facts, but only
predictions by our company and/or our company’s
management. • These statements generally can be identified by lead-in words such as
“believe,” “expect” “anticipate,” “intend,” “plan,” “foresee” and other similar words. Similarly, statements that describe our company’s objectives, plans or
goals are also forward-looking statements. • You are cautioned that these forward-looking statements are not
guarantees of future performance and involve risks and
uncertainties, and that actual results may differ materially from those projected in the forward-looking
statements as a results of various factors. Among others,
factors that could materially adversely affect actual results
and performance include those risk factors that are listed in
Sonic Automotive’s Form 10-Q for the quarter ended September 30, 2006. |
 Sonic Automotive Fourth Quarter 2006 Earnings Review February 27, 2007 |
 1 The Quarter in Review • Total revenue increased $119 million, or 6.5%. Same store revenue increased 2.7% driven by improvement in all retail lines • Combined luxury and import brands were 84% of total revenue. Luxury brands comprised a record 54% of total revenue • SG&A as a percent of gross profit improved 80 basis points to 73.9% • Operating margin hit 3.8%. • Achieved financial targets with fewer-than-expected acquisitions |
 2 Financial Performance (amounts in millions, except per share data) 2006 2005 Better/ (Worse) Revenue $1,958 $1,839 $119 Gross Profit $305 $286 $19 Operating Profit – Amount $74 $66 $8 – Margin 3.8% 3.6% Net Income – Continuing Operations $28.4 $26.7 $1.7 – Total Operations 23.2 20.9 2.3 EPS – Continuing Operations $0.63 $0.61 $0.02 – Total Operations 0.52 0.48 0.04 Q4 Up 6.6% Up 6.5% Up 12.5% Up 6.3% |
 3 2006 Earnings Perspective Strong financial performance, despite headwinds – Rising interest rates – Limited acquisitions Earnings per Share Original Guidance $2.40 - $2.50 Mid-Point $2.45 Less Stock Options Expense (0.08) Total $2.37 Actual Earnings $2.22 Second Quarter Charges 0.27 Total $2.49 |
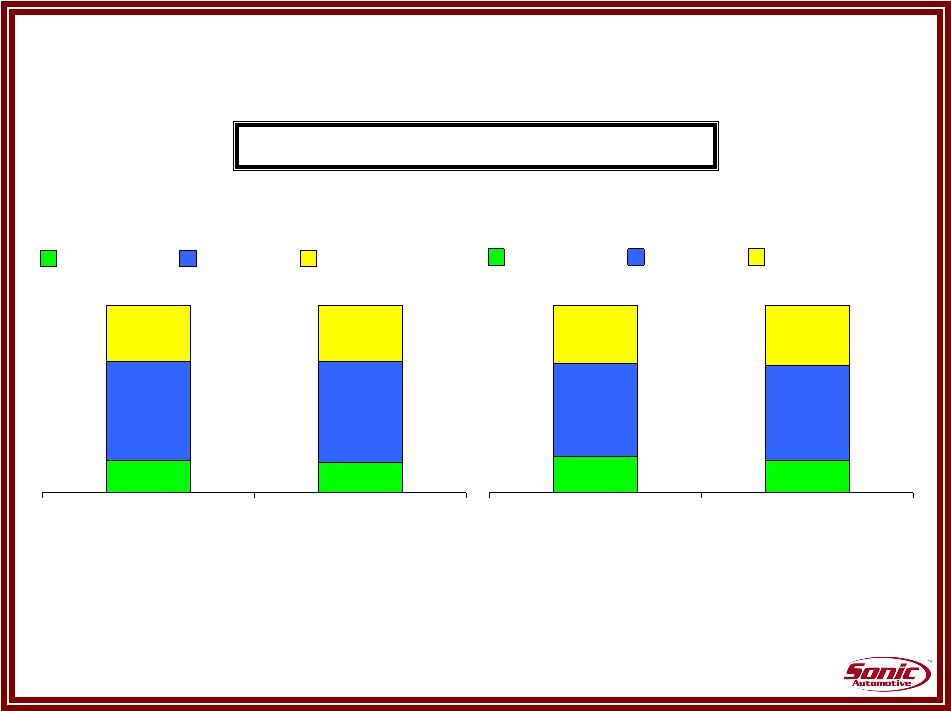 4 Portfolio Enrichment 19% 17% 50% 51% 31% 32% YTD 2005 YTD 2006 Domestic Luxury Import Percent of Total Revenue 17% 16% 53% 54% 30% 30% Q4 2005 Q4 2006 Domestic Luxury Import |
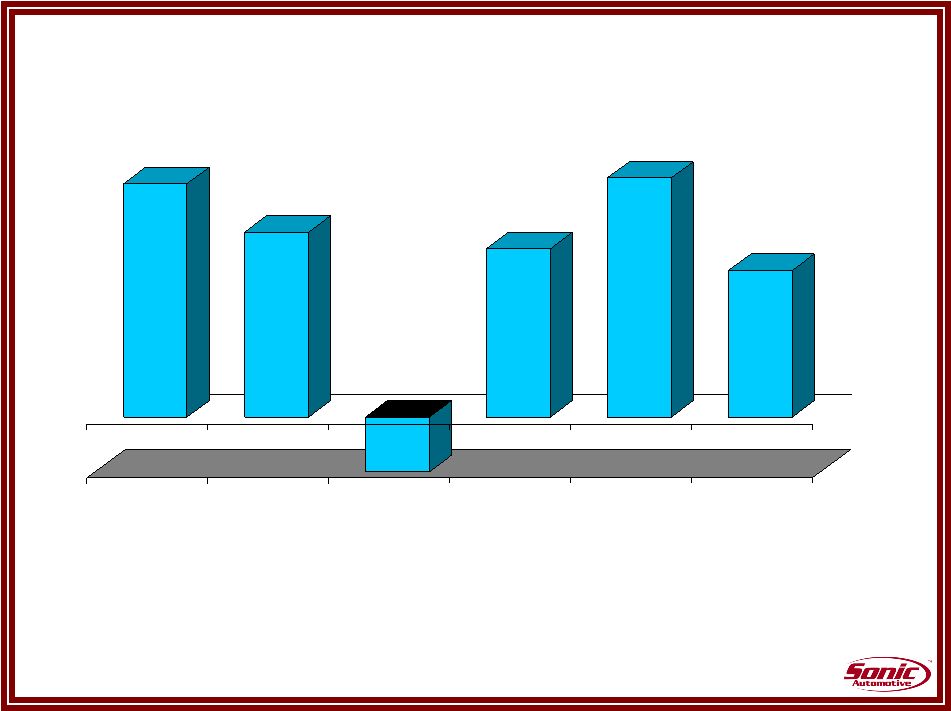 5 Same Store Revenue Growth • Solid performance across all business units • Vehicle sales continue to outpace the industry 4.3% 3.4% (15.9%) 3.1% 4.4% 2.7% New Retail Used Wholesale Fixed Operations F&I Total |
 6 Same Store Used Car Comparison 4 th Quarter 2006 Domestic Luxury (incl. Cadillac) Imports Margin 11.5% 8.3% 12.2% Used to New Ratio 0.78 0.43 0.38 Gross Per Unit $1,725 $2,228 $1,757 California All Other Stores Margin 8.3% 10.6% Used to New Ratio 0.28 0.56 Process Total Same Store Retail Volume Change 7.7% 1.3% YOY Used to New Ratio Change 40bps Flat YOY GPU Change 0.7% -0.7% Geographical - Continuing Process Stores - Same Store Brand - Continuing |
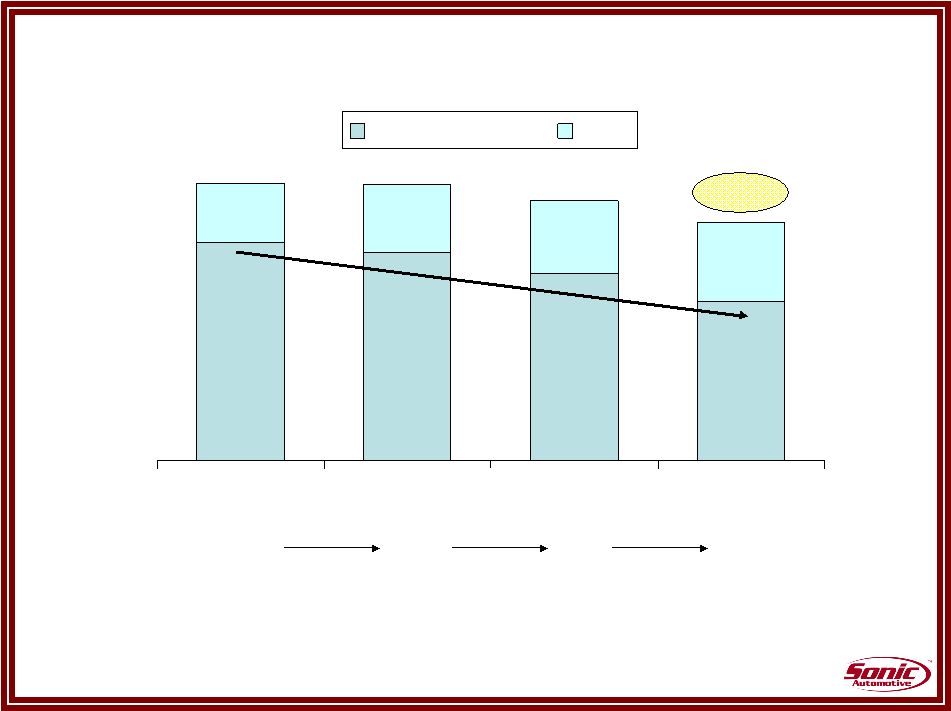 7 SG&A Expenses as % of Gross Profit FY 2003 FY 2004 FY 2005 Q4 2006 All Other SG&A Rent 6.0% 71.9% 8.0% 6.9% 7.3% 70.9% 68.8% 65.9% 77.9% 77.8% 76.1% 73.9% Fixed Absorption - 81.6% 83.2% 85.0% 91.1% |
 8 Inventory Management Days Supply Dec-06 Dec-05 Dec-06 Industry New Vehicles Domestic (excluding Cadillac) 59 57 76 Luxury (including Cadillac) 41 42 39 Import 38 42 51 Overall 48 48 62 Used Vehicles 40 37 Parts 36 35 |
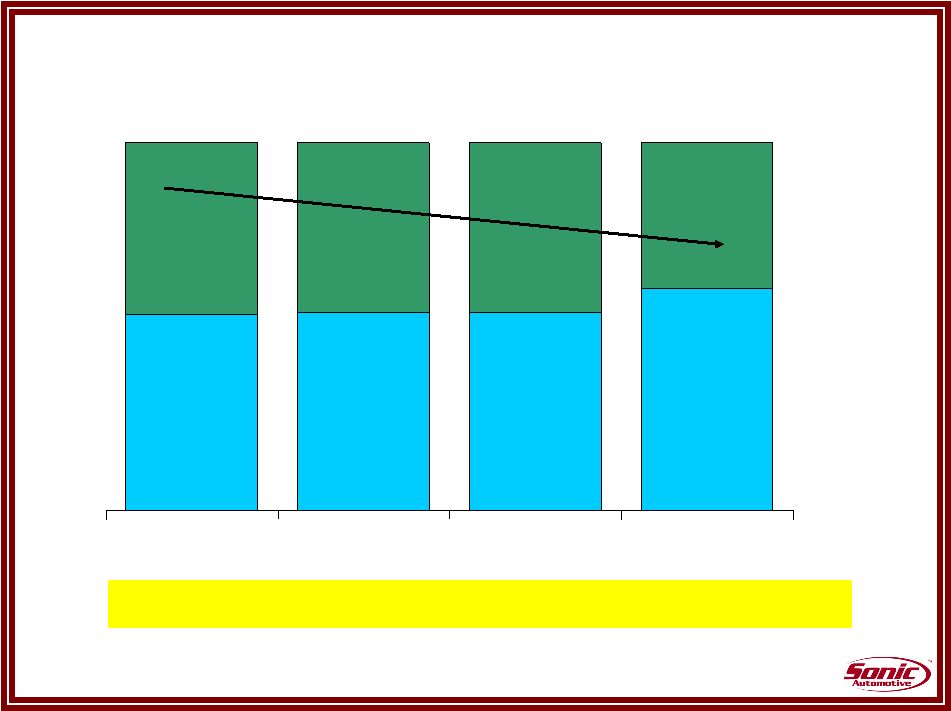 9 Capitalization 60.5% 54.0% 53.8% 53.2% 46.8% 46.2% 46.0% 39.5% 2003 2004 2005 2006 100% Debt Equity ****Achieved 40% Target For Debt-To-Capital**** 100% 100% 100% |
 10 • Same store sales growth – Low single digits across most business lines – Slightly higher in fixed operations • Gross margins – New vehicle margins relatively stable – Used vehicle margins stabilizing to up slightly – Fixed operations margins continuing improvement • Expense levels – Operating improvements offset partially by rent increases • Interest Rates – Stable rates – Carryover increase on variable rate debt • Acquisition growth – $0* • Share count increasing – Primarily due to accounting effect of 2005 convertible notes Projection Assumptions Projection Assumptions 2007 EPS from continuing operations target of $2.48 - $2.58 (excl. Acquisitions) *targeting 10-15% of revenue, not included in assumptions |
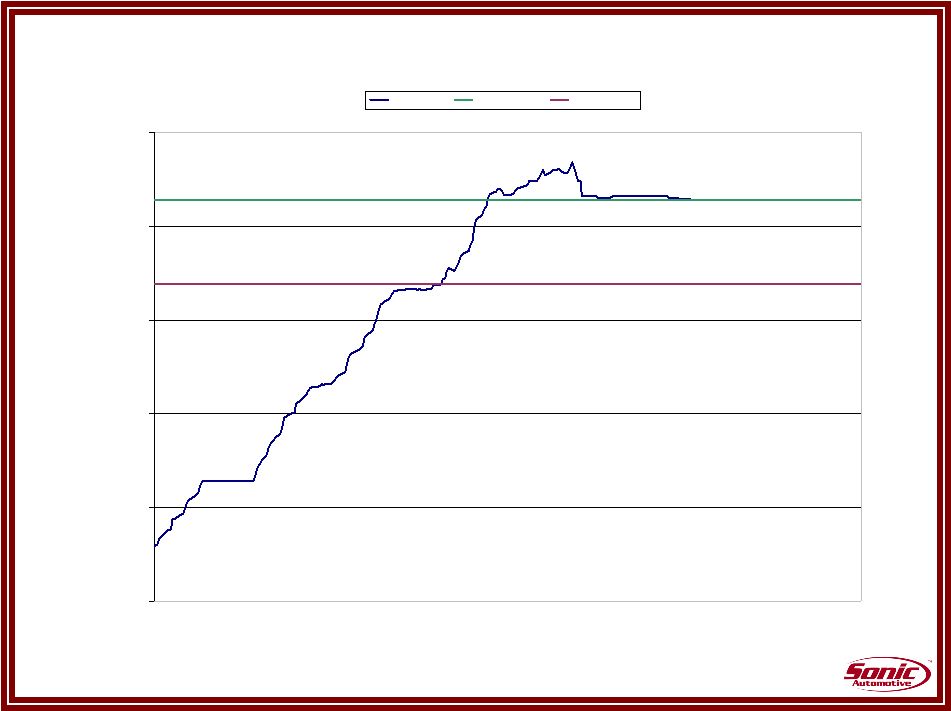 11 LIBOR Rate Comparison 4.25 4.50 4.75 5.00 5.25 5.50 2006 Actual 2007 Estimate Average 2006 March June December September January 2007 Projection Average 2006 |
 12 Share Count 2006 Actual 2007 Forecast * Basic Weighted Average Shares 42,336 43,144 Stock Option Plans 851 876 2002 Convertibles 2,776 2,776 2005 Convertibles 302 1,604 Fully Diluted Weighted Average Shares 46,265 48,400 * 2007 Forecast assumes average price of $31.88 compared to an average
price of $24.83 in 2006.
|
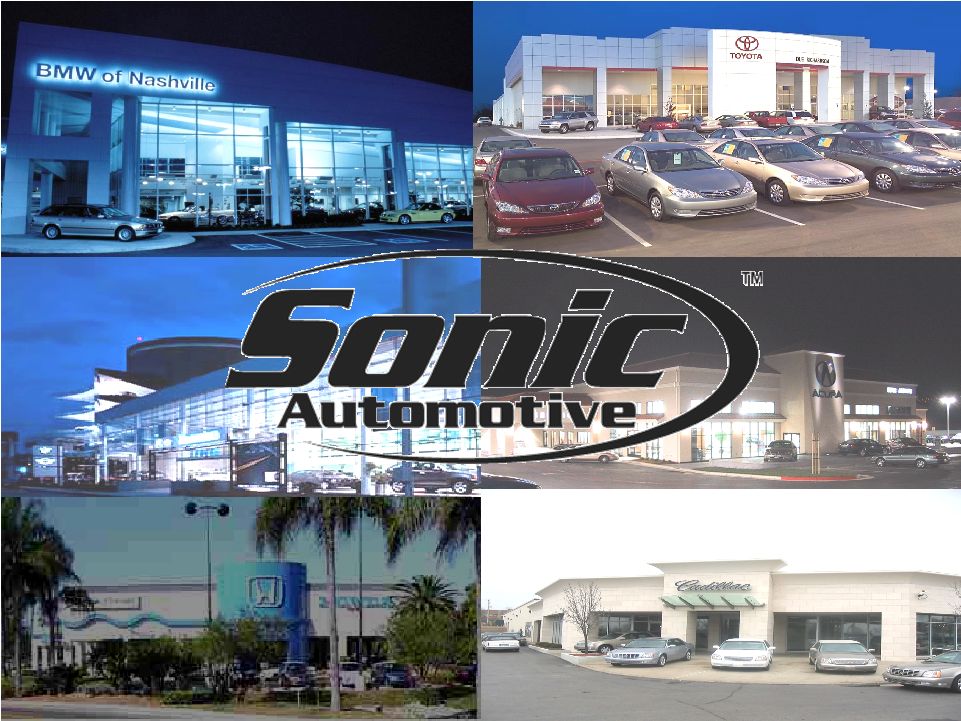
 13 • BMW of Fairfax Service Center • Lexus of Rockville • BMW of Chattanooga • Mercedes Benz of Fort Myers • Rockville Porsche/Audi • Momentum Porsche • Concord Toyota Facility Investments Facility Investments Spend money where you make money Focus on High Margin Business – Service Capacity and Luxury/Highline Imports |
 14 2007 Earnings Outlook - Perspective (Continuing Operations) - Continued strong operational performance - Investment in High-Margin Business segments - Actual Share count up slightly; fully diluted share count up nearly 5% Earnings per Share 2006 Actual $2.22 Second Quarter Charges 0.27 Subtotal $2.49 2007 Considerations: Operating Improvement 0.19 - 0.33 Rent Expense (0.12) - (0.16) Share Dilution (2005 Convertible notes) (0.08) Acquisitions 0.00 Total $2.48 - $2.58 |
 15 Summary • Strong operating and financial performance in 2006 • Execution of key initiatives continues • Used vehicles, fixed operations, and F&I are growth opportunities • Disciplined and prudent acquisitions – targeting 10%-15% of revenue • Strategy is sound; team focused on delivering results • Top priority: Improved profits and cash flow |
 19 |