 Exhibit 99.2 |
| Exhibit 99.2 |
 Cautionary Notice Regarding Forward-Looking Statements • This presentation contains statements that constitute
“forward-looking statements” within the meaning of Section 27A of the Securities Act of 1933 and Section 21E of the Securities Exchange Act of 1934. • These forward-looking statements are not historical facts, but only
predictions by our company and/or our company’s
management. • These statements generally can be identified by lead-in words such as
“believe,” “expect” “anticipate,” “intend,” “plan,” “foresee” and other similar words. Similarly, statements that describe our company’s objectives, plans or
goals are also forward-looking statements. • You are cautioned that these forward-looking statements are not
guarantees of future performance and involve risks and
uncertainties, and that actual results may differ materially from those projected in the forward-looking
statements as a results of various factors. Among others,
factors that could materially adversely affect actual results
and performance include those risk factors that are listed in
Sonic Automotive’s Form 10-K for the year ended December 31, 2006. |
 Sonic Automotive First Quarter 2007 Earnings Review May 1, 2007 |
 The Quarter in Review • Earnings from Continuing Operations up 10.0% • Fixed Operations, Used Vehicles and F&I driving top line and profit improvements • SG&A as a percent of gross profit improved 90 basis points to 77.4% • Operating margin improved 10bps to 3.3%. 1 |
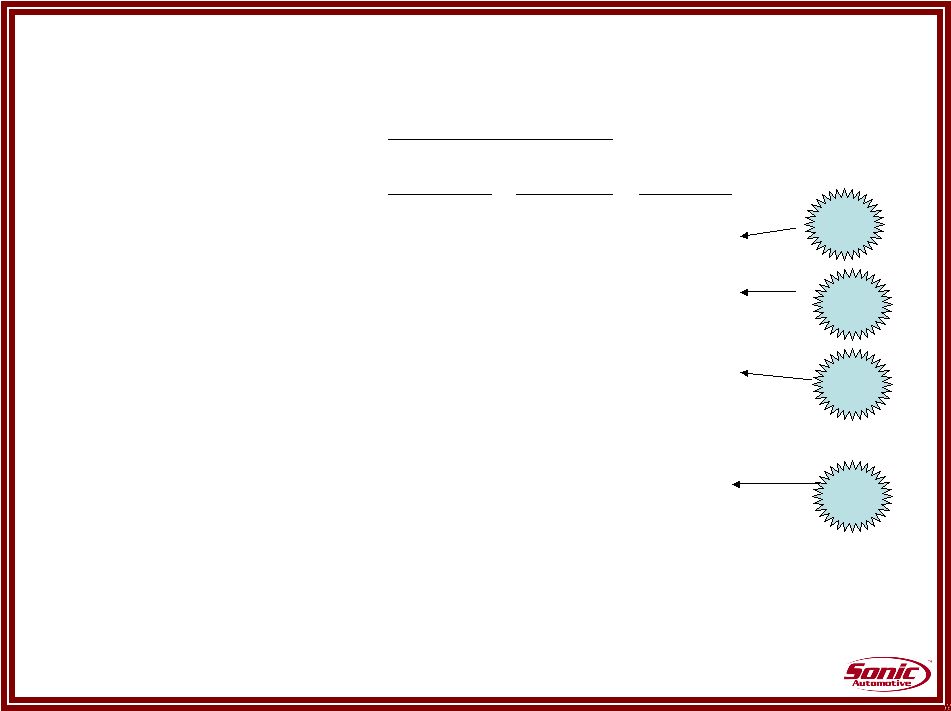
 Strategy in Motion • Used Vehicle (Champion) process • Standard F&I menu • Fixed Operations • Single DMS • Digital Marketing • Growth through prudent acquisitions • ASI + CSI + MSI = ROI 2 |
 Financial Performance (amounts in millions, except per share data) 2007 2006 Better/ (Worse) Revenue $1,954 $1,886 $68 Gross Profit $310 $298 $12 Operating Profit – Amount $64 $60 $4 – Margin 3.3% 3.2% Net Income – Continuing Operations $23.7 $21.5 $2.2 – Total Operations 20.0 17.1 2.9 EPS – Continuing Operations $0.52 $0.49 $0.03 – Total Operations 0.44 0.39 0.05 Q1 Up 4.2% Up 3.6% Up 7.7% Up 10.0% 3 |
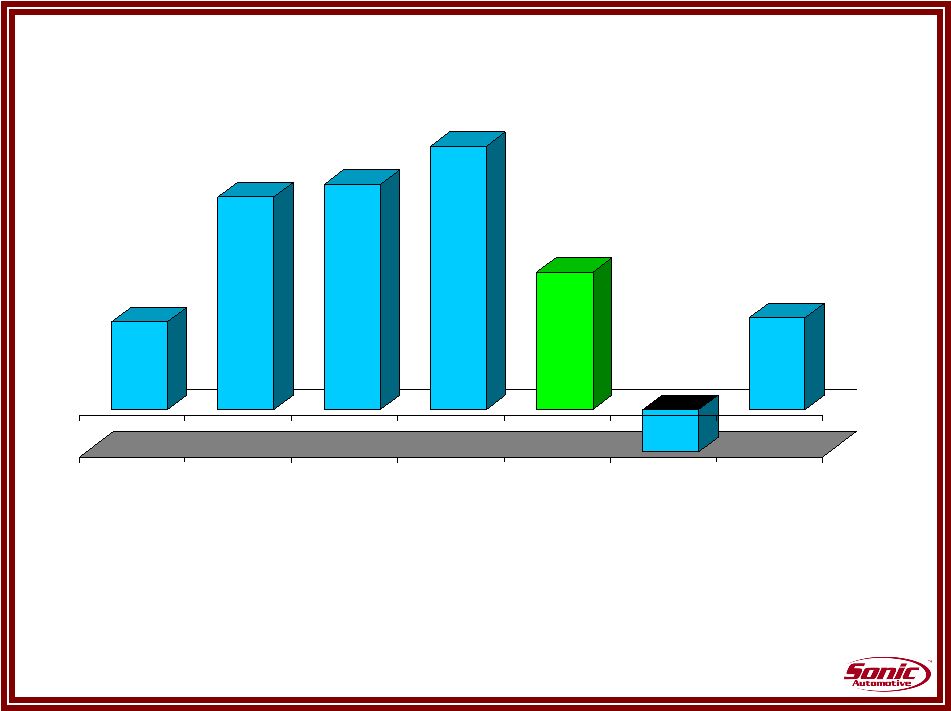 Same Store Revenue Growth • Solid performance across all business segments • Used and F&I processes driving improved performance in both areas
• Service Capacity investment contributing to growth 2.1% 5.1% 5.4% 6.3% 3.3% (13.8%) 2.2% New Used Fixed Operations F&I Sub Total Wholesale Total 4 |
 Used Vehicles Process in Motion 5 Q1 07 Q1 06 Change Champion Stores Used to new ratio 0.53 0.49 0.04 Used retail volume 12,405 11,355 9.2% Total Sonic Used to new ratio 0.53 0.51 0.02 Used retail volume 17,008 16,144 5.4% Memo: Used to New Ratio California 0.33 0.32 0.01 Total Luxury 0.56 0.50 0.06 Progress |
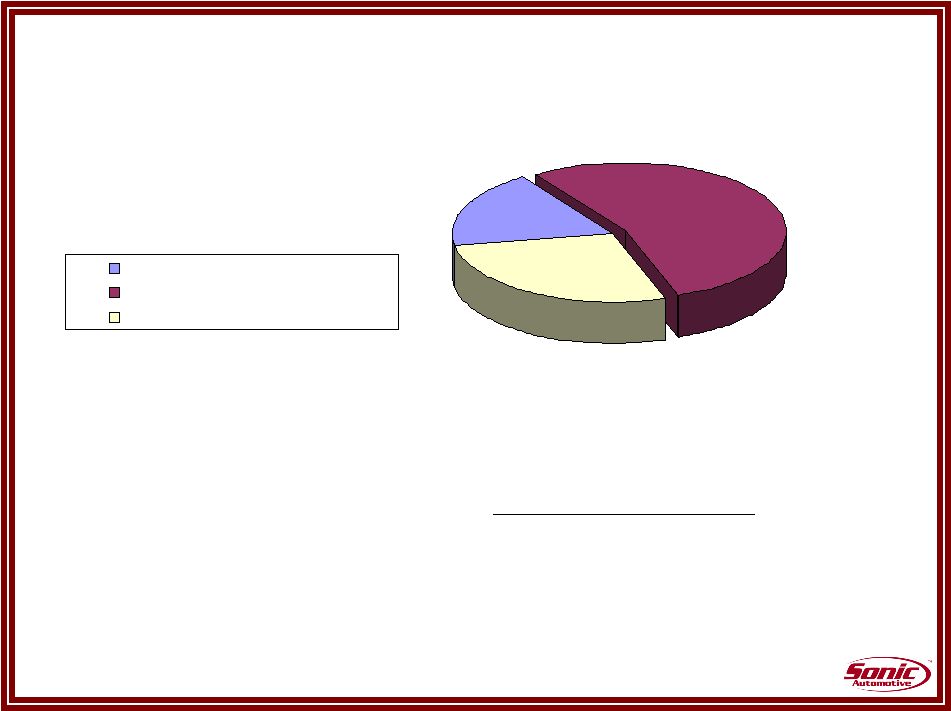 Used Vehicles 6 Margin Gross Per Unit Domestic (excl. Cadillac) 11.9% $1,846 Luxury Imports (incl. Cadillac) 8.6% $2,311 Other Imports 12.5% $1,772 Total 10.3% $1,995 Brand Mix - Used Revenue 18.4% 54.1% 27.5% Domestic (excl. Cadillac) Luxury Imports (incl. Cadillac) Other Imports |
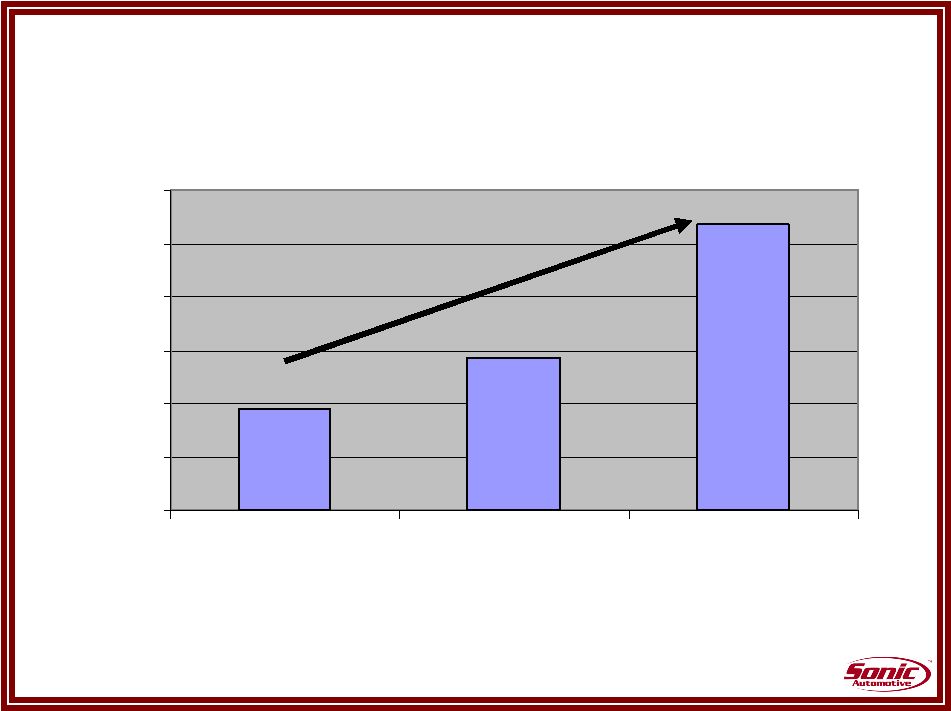 F&I Process in Motion 7 F&I Per Unit $959 $969 $994 $940 $950 $960 $970 $980 $990 $1,000 Q1 2006 Q4 2006 Q1 2007 $35 |
 Fixed Operations Process in Motion • Revenue from Fixed Operations reached a sector leading 15.1% of Total Revenue in Q1. • Total Customer Pay revenue grew over 11%; Gross Profit increased nearly 12%. • A total of 102 incremental stalls were added in 2006; 138 more are planned for 2007. 8 Spend money where you make money |
 SG&A Expenses as % of Gross Profit 8.0% 70.3% 69.0% 8.4% Q1 2007 Q1 2006 All Other SG&A Rent 78.3% 77.4% 40 bps 130 bps 9 87.9% 86.8% Fixed Absorption |
 Inventory Management Days Supply Mar-07 Mar-06 Industry New Vehicles Domestic (excluding Cadillac) 61 61 80 Luxury (including Cadillac) 49 48 53 Other Imports 53 48 51 Overall 54 53 67 Used Vehicles 37 40 Parts 34 35 10 |
 Debt to Capital Ratio* 39.4% 38.9% Q1 2007 Q4 2006 50 bps *Net of cash and excludes impact of FIN 48 11 |
 Portfolio Enrichment Percent of Total Revenue 18% 17% 51% 52% 31% 31% Q1 2006 Q1 2007 Domestic Luxury Other Imports 12 100% 100% Luxury and Import at 83% |
 Summary • Execution of key initiatives continues – Used vehicles, fixed operations, and F&I • Executing disciplined and prudent acquisition strategy – targeting 10%-15% of revenue • Strategy is sound; team focused on delivering results • Top priority: Improved profits and cash flow 13 Re-affirming Full Year Guidance $2.48 - $2.58 |
 |