 Exhibit 99.2 |
| Exhibit 99.2 |
 Cautionary Notice Regarding Forward-Looking Statements • This presentation contains statements that constitute “forward-looking statements” within the meaning of Section 27A of the Securities Act of 1933 and Section 21E of the Securities Exchange Act of 1934. • These forward-looking statements are not historical facts, but only predictions by our company and/or our company’s management. • These statements generally can be identified by lead-in words such as “believe,” “expect” “anticipate,” “intend,” “plan,” “foresee” and other similar words. Similarly, statements that describe our company’s objectives, plans or goals are also forward-looking statements. • You are cautioned that these forward-looking statements are not guarantees of future performance and involve risks and uncertainties, and that actual results may differ materially from those projected in the forward-looking statements as a results of various factors. Among others, factors that could materially adversely affect actual results and performance include those risk factors that are listed in Sonic Automotive’s
Form 10-Q for the quarter ended June 30, 2007.
|
 Sonic Automotive Third Quarter 2007 Earnings Review October 30, 2007 |
 The Quarter in Review • Profit from continuing operations up 9.4% • Total revenue up 5.7%; Gross up 6.0% – Same store used vehicle revenue up 11.1% – F&I per unit up 5.0% • Operating margin improved 10bps to 3.7% • SG&A 74.4% - down 40bps from Q3 06 1 EXECUTION OF KEY INTIATIVES CONTINUES Used vehicles, F&I, fixed operations, cost management
|
 2007 2006 Better/ (Worse) (amounts in millions, except per share data) Revenue $2,186 $2,068 $118 Gross Profit $335 $316 $19 – Margin 15.3% 15.3% Operating Profit – Amount $80 $74 $6 – Margin 3.7% 3.6% Net Income – Continuing Operations $31.8 $29.0 $2.8 – Total Operations 26.1 28.6 (2.5) EPS – Continuing Operations $0.70 $0.66 $0.04 – Total Operations 0.58 0.65 (0.07) Q3 Performance Overview 2 5.7% 6.0% 8.5% 10bps 9.4% (8.7%) 6.0% (10.8%) |
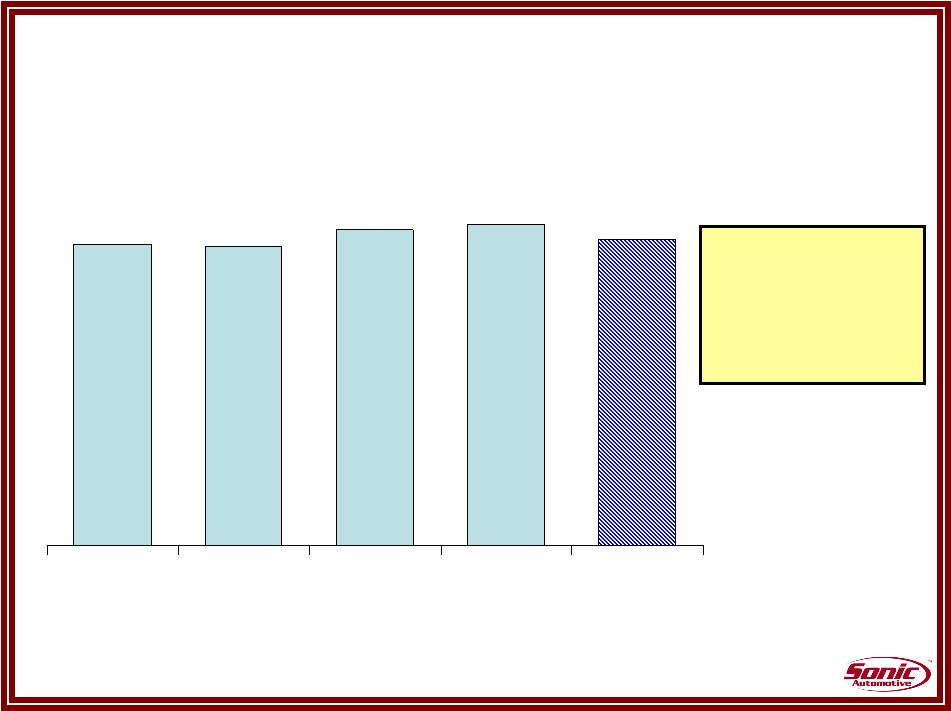
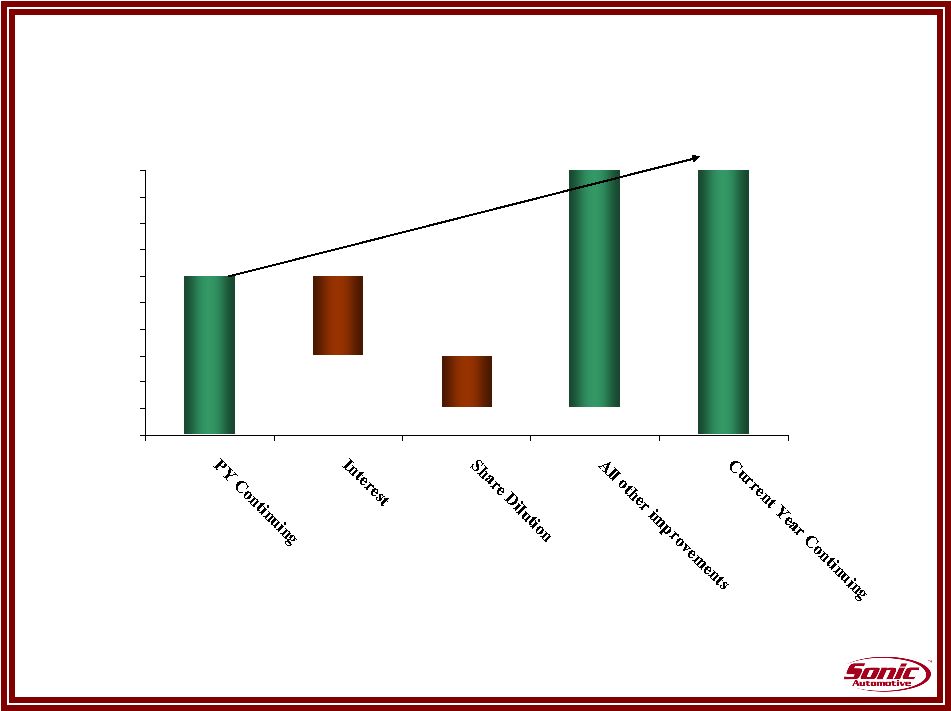 $0.60 $0.61 $0.62 $0.63 $0.64 $0.65 $0.66 $0.67 $0.68 $0.69 $0.70 ($0.03) $0.66 $0.70 ($0.02) $0.09 Performance Overview EPS 3 |
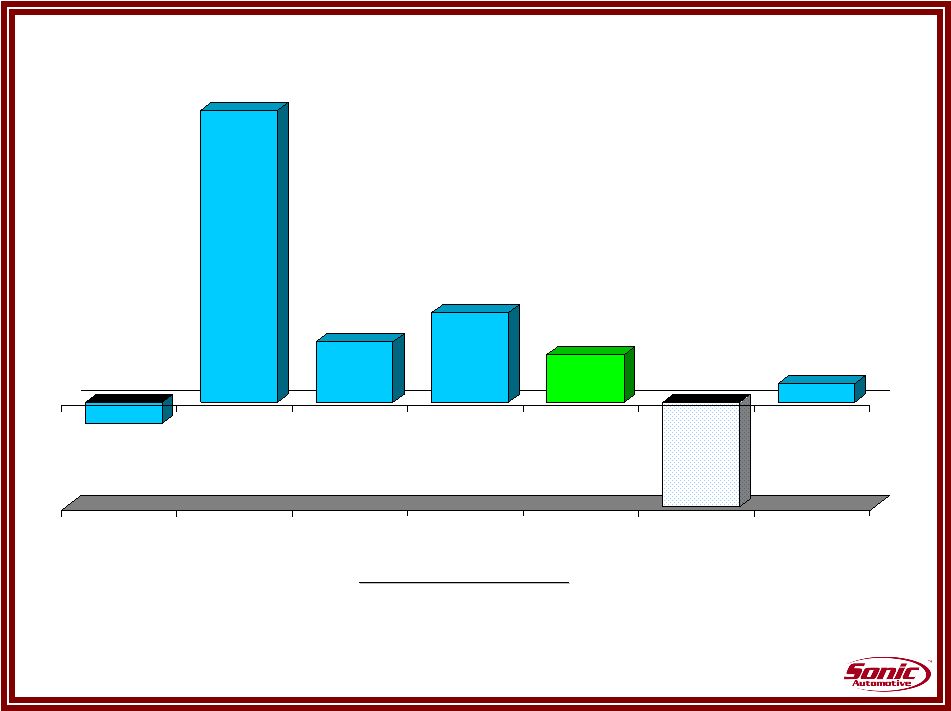 Performance Overview Same Store Revenue Growth Execution in Motion Execution in Motion Same store retail used volume up 5.4% Fixed Operations same store customer pay revenue up 5.4% (up 9.8% in
total) F&I per unit up $51 on a same store basis (0.8%) 11.1% 2.3% 3.4% 1.8% (15.8%) 0.7% New Used Fixed Operations F&I Sub Total Wholesale Total 4 |
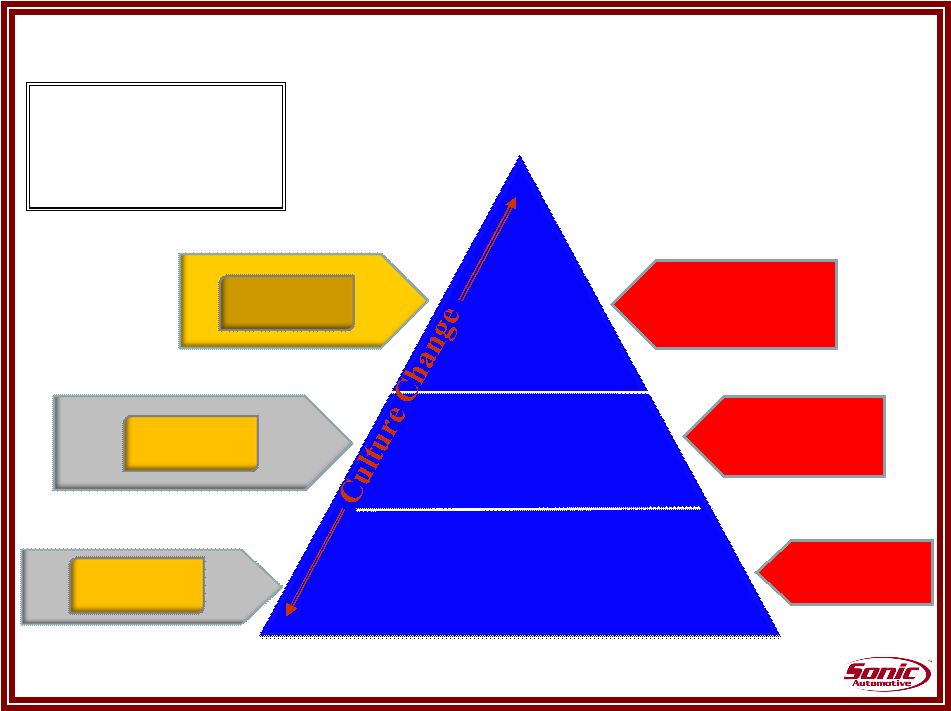 Used Vehicle Performance Execution in Motion Trade Desk Phase II Phase III Web-Tail Maximize Margin Volume Growth Increased Profitability Right inventory, Right Location, Right Price On-line Branding Virtual Lot Sonic “Auto Pilot” Optimizing Inventory Market Shift to Consumer Control •7 Quarters of Same store volume improvement •Net Margin up •CPO % stable Basic Process rollout (best practices) Less Wholesale/Keep more trades Common Technology (S.I.M.S) 5 Inventory Control Technology Introduction Phase I |
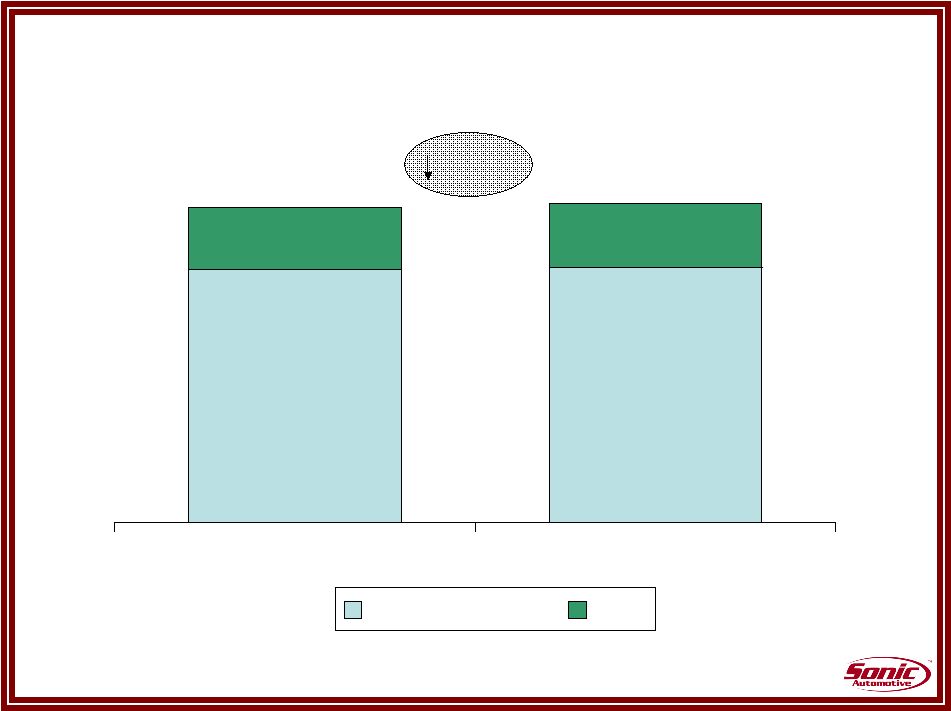   SG&A Expenses Execution in Motion 7.9% 66.9% 66.6% 7.8% Q3 2007 Q3 2006 All Other SG&A Rent 74.4% 74.8% 40 bps 6 |
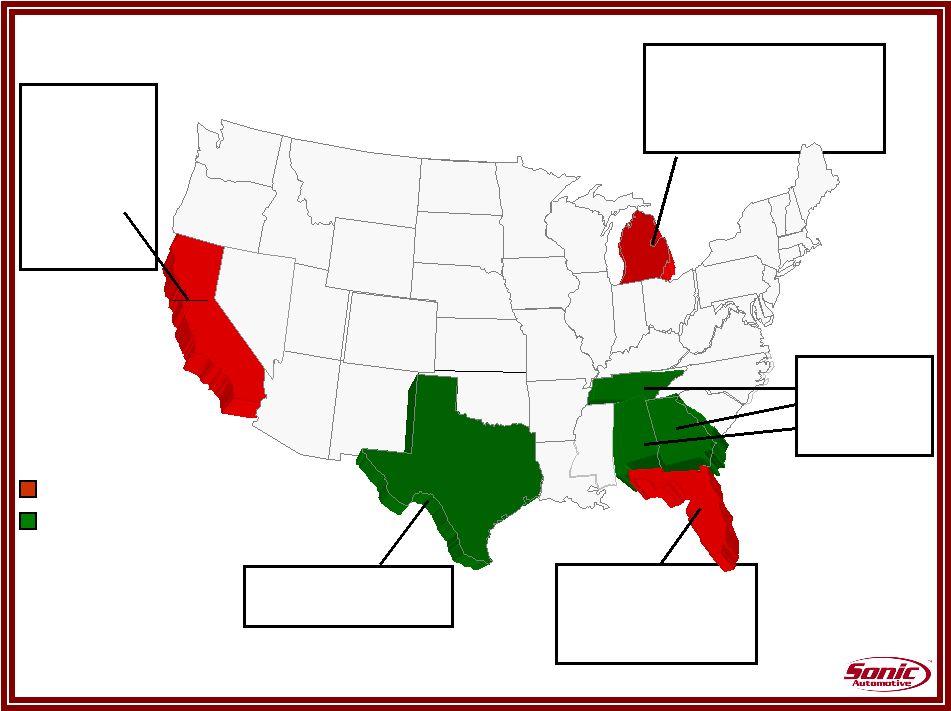 28.6% of Total Revenue Same store used, F&I up New Margin compression remains a concern 7.4% of Total Revenue Impacted by construction at our large Toyota dealership 2.6% Total Revenue Unemployment Rate (as of Sep) 7.5% Excluding Michigan, Sonic Cadillac new unit volume performed better than the Industry Geographic Review 24.9% of Total Revenue Overall good performance 14.8% of Total Revenue Improvement in all areas Difficult Sales Environment Stable Sales Environment 7 |
 Inventory Management Days Supply Sep-07 Sep 07 Industry New Vehicles Domestic (excluding Cadillac) 51.9 70.3 Luxury ( including Cadillac) 41.3 40.6 Import 40.9 45.6 Overall 43.6 57.3 Used Vehicles 37.0 8 |
 Debt to Capital Ratio (1) (1) – Net of Cash 35 -40% 39.1% 39.4% 41.2% 41.9% Q4 2006 Q1 2007 Q2 2007 Q3 2007 Target 9 •Long Beach BMW/Mini •Two mortgages in place; Two more to close in Q4 •CAC sale •Share repurchases |
 Q4 Outlook • Generally stable operating environment – New vehicle softness offset by other opportunities – Stable margins and expense levels – Strength in certain markets and brands will be offset by softness in
others • Reaffirming EPS target to $2.50 – $2.60 – Includes impact of closed acquisitions – Continued execution of key initiatives and expense control • Increased share repurchase authorization by $40 million – $33 million repurchased in the quarter; $43 million year to date – Prudent and opportunistic purchases; continue to pick away at
dilution 10 |
 Summary • Top priority - Execution of key initiatives • Executing disciplined and prudent acquisition strategy • Strategy is sound; team focused on delivering results 11 Reaffirming Full Year
Guidance $2.50 - $2.60 |
 |