UNITED STATES
SECURITIES AND EXCHANGE COMMISSION
WASHINGTON, D.C. 20549
FORM 10-K
| x | ANNUAL REPORT PURSUANT TO SECTION 13 OR 15(d) OF THE SECURITIES EXCHANGE ACT OF 1934 |
For the fiscal year ended December 31, 2007
OR
| .¨ | TRANSITION REPORT PURSUANT TO SECTION 13 OR 15(d) OF THE SECURITIES EXCHANGE ACT OF 1934 |
For the transition period from to
Commission file number 1-13395
SONIC AUTOMOTIVE, INC.
(Exact Name of Registrant as Specified in its Charter)
| DELAWARE | 56-2010790 | |
| (State or Other Jurisdiction of Incorporation or Organization) |
(I.R.S. Employer Identification No.) | |
| 6415 IDLEWILD ROAD, SUITE 109 | ||
| CHARLOTTE, NORTH CAROLINA | 28212 | |
| (Address of Principle Executive Offices) | (Zip Code) |
(704) 566-2400
(Registrant’s telephone number, including area code)
SECURITIES REGISTERED PURSUANT TO SECTION 12(b) OF THE ACT:
| TITLE OF EACH CLASS |
NAME OF EACH EXCHANGE ON WHICH REGISTERED | |
| Class A Common Stock, $.01 Par Value | New York Stock Exchange |
SECURITIES REGISTERED PURSUANT TO SECTION 12(g) OF THE ACT:
(Title of class)
Indicate by check mark if the registrant is a well-known seasoned issuer, as defined in Rule 405 of the Securities Act. Yes ¨ No x
Indicate by check mark if the registrant is not required to file reports pursuant to Section 13 or Section 15(d) of the Act. Yes ¨ No x
Indicate by check mark whether the registrant: (1) has filed all reports required to be filed by Section 13 or 15(d) of the Securities Exchange Act of 1934 during the preceding 12 months (or for such shorter period that the registrant was required to file such reports), and (2) has been subject to such filing requirements for the past 90 days. Yes x No ¨
Indicate by check mark if disclosure of delinquent filers pursuant to Item 405 of Regulation S-K is not contained herein, and will not be contained, to the best of registrant’s knowledge, in definitive proxy or information statements incorporated by reference in Part III of this Form 10-K or any amendment to this Form 10-K. x
Indicate by check mark whether the registrant is a large accelerated filer, an accelerated filer, a non-accelerated filer, or a smaller reporting company. See definitions of “large accelerated filer,” “accelerated filer” and “smaller reporting company” in Rule 12b-2 of the Exchange Act.
Large accelerated filer x Accelerated filer ¨ Non-accelerated filer ¨ smaller reporting company ¨
Indicate by a check mark whether the registrant is a shell company (as defined in Rule 12b-2 of the Exchange Act.) Yes ¨ No x
The aggregate market value of the voting common stock held by non-affiliates of the registrant was approximately $887,956,979 based upon the closing sales price of the registrant’s Class A common stock on June 30, 2007 of $28.97 per share. As of February 20, 2008 there were 28,837,932 shares of Class A common stock, par value $.01 per share, and 12,029,375 shares of Class B common stock, par value $.01 per share, outstanding.
Documents incorporated by reference. Portions of the registrant’s Proxy Statement for the Annual Meeting of Stockholders to be held April 24, 2008 are incorporated by reference into Part III of this Form 10-K.
FORM 10-K TABLE OF CONTENTS
| PAGE | ||||
| PART I |
||||
| Item 1. |
2 | |||
| Item 1A. |
2 | |||
| Item 1B. |
8 | |||
| Item 2. |
21 | |||
| Item 3. |
22 | |||
| Item 4. |
22 | |||
| PART II |
||||
| Item 5. |
23 | |||
| Item 6. |
24 | |||
| Item 7. |
Management’s Discussion and Analysis of Financial Condition and Results of Operations |
25 | ||
| Item 7A. |
51 | |||
| Item 8. |
52 | |||
| Item 9. |
Changes in and Disagreements With Accountants on Accounting and Financial Disclosure |
52 | ||
| Item 9A. |
52 | |||
| Item 9B. |
56 | |||
| PART III |
||||
| Item 10. |
56 | |||
| Item 11. |
56 | |||
| Item 12. |
Security Ownership of Certain Beneficial Owners and Management and Related Stockholder Matters |
56 | ||
| Item 13. |
Certain Relationships and Related Transactions, and Director Independence |
56 | ||
| Item 14. |
56 | |||
| PART IV |
||||
| Item 15. |
57 | |||
| 61 | ||||
| F-1 | ||||
This Annual Report on Form 10-K contains numerous “forward-looking statements” within the meaning of the Private Securities Litigation Reform Act of 1995. These forward-looking statements address our future objectives, plans and goals, as well as our intent, beliefs and current expectations regarding future operating performance, and can generally be identified by words such as “may,” “will,” “should,” “believe,” “expect,” “anticipate,” “intend,” “plan,” “foresee” and other similar words or phrases. Specific events addressed by these forward-looking statements include, but are not limited to:
| • | future acquisitions or dispositions; |
| • | industry trends; |
| • | general economic trends, including employment rates and consumer confidence levels; |
| • | vehicle sales rates and same store sales growth; |
| • | our financing plans; and |
| • | our business and growth strategies. |
These forward-looking statements are based on our current estimates and assumptions and involve various risks and uncertainties. As a result, you are cautioned that these forward-looking statements are not guarantees of future performance, and that actual results could differ materially from those projected in these forward-looking statements. Factors which may cause actual results to differ materially from our projections include those risks described in Item 1A of this Form 10-K and elsewhere in this report, as well as:
| • | our ability to generate sufficient cash flows or obtain additional financing to support acquisitions, capital expenditures, our share repurchase program, dividends on our Common Stock and general operating activities; |
| • | the reputation and financial condition of vehicle manufacturers whose brands we represent, the financial incentives they offer and their ability to design, manufacture, deliver and market their vehicles successfully; |
| • | our relationships with manufacturers, which may affect our ability to complete additional acquisitions; |
| • | changes in laws and regulations governing the operation of automobile franchises, accounting standards, taxation requirements, and environmental laws; |
| • | general economic conditions in the markets in which we operate, including fluctuations in interest rates, employment levels, the level of consumer spending and consumer credit availability; |
| • | high competition in the automotive retailing industry, which not only creates pricing pressures on the products and services we offer, but also on businesses we seek to acquire; and |
| • | the timing of and our ability to successfully integrate recent and potential future acquisitions. |
1
PART I
| Item 1. | Business. |
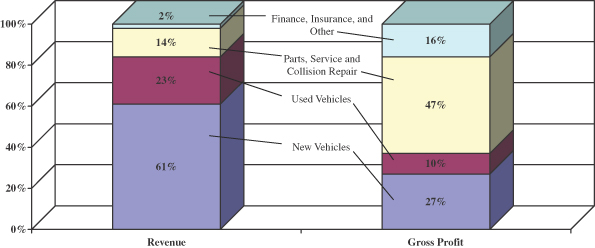
Sonic Automotive, Inc. was incorporated in Delaware in 1997. We are one of the largest automotive retailers in the United States. As of February 22, 2008, we operated 169 dealership franchises at 144 dealership locations, representing 33 different brands of cars and light trucks, and 34 collision repair centers in 15 states. Each of our dealerships provides comprehensive services including (1) sales of both new and used cars and light trucks; (2) sales of replacement parts and performance of vehicle maintenance, warranty, paint and repair services (collectively, “Fixed Operations”); and (3) arrangement of extended service contracts, financing and insurance and other aftermarket products (collectively, “F&I”) for our automotive customers.
The following chart depicts the multiple sources of revenue and gross profit for the year ended December 31, 2007:
Our dealership network resides in various geographic markets. As of December 31, 2007, we operated dealerships in the following markets:
| Market |
Number of Dealerships |
Number of Franchises |
Percent of 2007 Total Revenue |
||||
| Houston |
15 | 18 | 17.0 | % | |||
| Alabama/Tennessee |
16 | 20 | 10.5 | % | |||
| North/South Carolina/Georgia |
18 | 21 | 10.2 | % | |||
| Florida |
14 | 18 | 7.9 | % | |||
| North Bay (San Francisco) |
11 | 12 | 7.8 | % | |||
| Dallas |
7 | 9 | 7.6 | % | |||
| South Bay (San Francisco) |
13 | 14 | 6.8 | % | |||
| Los Angeles South |
7 | 8 | 6.8 | % | |||
| Mid-Atlantic |
6 | 7 | 5.3 | % | |||
| Los Angeles North |
10 | 12 | 5.2 | % | |||
| Oklahoma |
7 | 7 | 4.5 | % | |||
| Michigan |
6 | 6 | 2.7 | % | |||
| Las Vegas |
4 | 4 | 2.2 | % | |||
| Ohio |
6 | 9 | 1.9 | % | |||
| Colorado |
2 | 2 | 1.9 | % | |||
| San Diego |
2 | 2 | 1.7 | % | |||
| Total |
144 | 169 | 100.0 | % | |||
2
During 2007, we acquired or were awarded by manufacturers, ten franchises (at four dealership locations) and disposed of 12 franchises (at eight dealership locations). We plan to continue to purchase franchises that enrich our franchise portfolio and divest franchises which we believe will not yield acceptable returns over the long-term.
The automotive retailing industry remains highly fragmented, and we believe that further consolidation is likely. We believe that attractive acquisition opportunities continue to exist for dealership groups with the capital and experience to identify, acquire and professionally manage dealerships.
Business Strategy
Further Develop Strategic Markets and Brands. Our growth strategy is focused on large metropolitan markets, predominantly in the Southeast, Southwest, Midwest and California. We also seek to acquire stable franchises that we believe have above average sales prospects. A majority of our dealerships are either luxury or mid-line import brands. For the year ended December 31, 2007, 84.1% of our total revenue was generated by import and luxury dealerships, which generally have higher operating margins, more stable fixed operations departments, lower associate turnover and lower inventory levels. We expect this trend toward acquiring more luxury and mid-line import dealerships to continue in the near future.
The following table depicts the breakdown of our new vehicle revenues by brand:
| Brand (1) |
Percentage of New Vehicle Revenue |
||||||||
| Year Ended December 31, | |||||||||
| 2005 | 2006 | 2007 | |||||||
| BMW |
14.5 | % | 13.7 | % | 16.2 | % | |||
| Honda |
15.3 | % | 15.2 | % | 14.0 | % | |||
| Toyota |
11.4 | % | 12.4 | % | 12.5 | % | |||
| Mercedes |
6.5 | % | 9.5 | % | 10.0 | % | |||
| General Motors (2) |
9.3 | % | 8.5 | % | 8.5 | % | |||
| Cadillac |
9.8 | % | 9.2 | % | 8.4 | % | |||
| Ford |
8.0 | % | 7.6 | % | 6.9 | % | |||
| Lexus |
7.4 | % | 6.8 | % | 6.7 | % | |||
| Volvo |
3.1 | % | 2.5 | % | 2.1 | % | |||
| Audi |
1.6 | % | 1.4 | % | 1.6 | % | |||
| Nissan |
2.1 | % | 1.8 | % | 1.5 | % | |||
| Land Rover |
0.8 | % | 0.9 | % | 1.5 | % | |||
| Hyundai |
1.4 | % | 1.5 | % | 1.4 | % | |||
| Volkswagen |
1.4 | % | 1.5 | % | 1.3 | % | |||
| Porsche |
1.1 | % | 1.3 | % | 1.3 | % | |||
| Acura |
1.6 | % | 1.2 | % | 1.2 | % | |||
| Infiniti |
0.7 | % | 1.1 | % | 1.2 | % | |||
| Chrysler (3) |
0.6 | % | 0.5 | % | 0.5 | % | |||
| Other Luxury (4) |
1.0 | % | 1.2 | % | 1.1 | % | |||
| Other (5) |
2.4 | % | 2.2 | % | 2.1 | % | |||
| Total |
100.0 | % | 100.0 | % | 100.0 | % | |||
| (1) | In accordance with the provisions of SFAS No. 144, prior years’ income statement data reflect reclassifications to exclude franchises sold, identified for sale, or terminated subsequent to December 31, 2006 which had not been previously included in discontinued operations. See Notes 1 and 2 to our accompanying Consolidated Financial Statements which discusses these and other factors that affect the comparability of the information for the periods presented. |
3
| (2) | Includes Buick, Chevrolet, GMC, Pontiac and Saturn |
| (3) | Includes Chrysler, Dodge and Jeep |
| (4) | Includes Hummer, Jaguar, and Saab |
| (5) | Includes Isuzu, KIA, Mini, Scion and Subaru |
Increase Sales of Higher Margin Products and Services. We continue to pursue opportunities to increase our sales of higher-margin products and services by expanding the following:
Finance, Insurance and Other Aftermarket Products (“F&I”): Each sale of a new or used vehicle provides us with an opportunity to earn financing fees and insurance commissions and to sell extended service contracts and other aftermarket products. We currently offer a wide range of nonrecourse financing, leasing, other aftermarket products, service contracts and insurance products to our customers. We are continuing to emphasize menu-selling techniques and other best practices to increase our sales of F&I products at both newly acquired and existing dealerships.
Parts, Service & Repair: Each of our dealerships offers a fully integrated service and parts department. Manufacturers permit warranty work to be performed only at franchised dealerships. As a result, franchised dealerships are uniquely qualified to perform work covered by manufacturer warranties on increasingly complex vehicles. We believe we can continue to grow our profitable parts and service business by using our access to capital to increase service capacity, investing in sophisticated equipment and well trained technicians, using variable rate pricing structures, focusing on customer service and efficiently managing our parts inventory. In addition, we believe our emphasis on selling extended service contracts will drive further service and parts business in our dealerships as we increase the potential to retain current customers beyond the term of the standard manufacturer warranty period.
Certified Pre-Owned Vehicles. Various manufacturers provide franchised dealers the opportunity to sell certified pre-owned (“CPO”) vehicles. This certification process extends the standard manufacturer warranty on the particular vehicle. We typically earn higher revenues and gross margins on CPO vehicles compared to non-certified pre-owned vehicles. We also believe the extended manufacturer warranty increases our potential to retain the pre-owned purchaser as a future parts and service customer. Since CPO warranty work can only be performed at franchised dealerships, we believe the used vehicle business will become more clearly segmented and CPO sales and similar products will increase in volume.
“Value” Used Vehicles. Due to our luxury and import brand mix, our used vehicle strategy has historically been focused on CPO vehicles and higher cost of sale vehicles. A market segment that drives used vehicle volume that we historically participated in on only a limited basis is vehicles with retail prices below $10,000. Until recent years, if we received a trade-in which did not meet our then existing internal criteria for used vehicles (in many instances these would be “value” vehicles), we would wholesale the vehicle. We believe the market for these “value” vehicles is deep and not as sensitive to market fluctuations as higher priced used vehicles. We have begun to more aggressively market and retail these vehicles.
Emphasize Expense Control. We continually focus on controlling expenses and expanding margins at the dealerships we acquire and integrate into our organization. We manage these costs, such as advertising and variable compensation expenses, so that they are generally related to vehicle sales and can be adjusted in response to changes in vehicle sales volume. The majority of our non-clerical dealership personnel are paid either a commission or a modest salary plus commissions. In addition, dealership management compensation is tied to individual dealership profitability. We believe we can further manage these types of costs through best practices, standardization of compensation plans, controlled oversight and accountability, reducing associate turnover and centralizing and standardizing processes and systems such as a single dealership management system, accounting office consolidation, payroll system consolidation and inventory management technology.
Achieve High Levels of Customer Satisfaction. We focus on maintaining high levels of customer satisfaction. Our personalized sales process is designed to satisfy customers by providing high-quality vehicles in
4
a positive, “consumer friendly” buying environment. Several manufacturers offer specific financial incentives on a per vehicle basis if certain Customer Satisfaction Index (“CSI”) levels (which vary by manufacturer) are achieved by a dealership. In addition, all manufacturers consider CSI scores in approving acquisitions. In order to keep management focused on customer satisfaction, we include CSI results as a component of our incentive-based compensation programs.
Train and Develop Associates. We believe that our well-trained dealership personnel are key to our long-term prospects. We require all of our employees, from service technicians to regional vice presidents, to participate in our in-house training programs each year. We believe that our comprehensive training of all employees and professional, multi-tiered management structure provide us with a competitive advantage over other dealership groups. This training and organizational structure provide high-level supervision over the dealerships, accurate financial reporting and the ability to maintain effective controls.
Manage Leverage. We believe it prudent over time to maintain our long-term-debt to total capital ratio at between 35% and 40%. At December 31, 2007, our long-term debt to total capital ratio, net of cash and cash equivalents, was 42.4%, exceeding our target primarily as a result of recent acquisitions, recent mortgage financing and 2007 stock repurchases.
Relationships with Manufacturers
Each of our dealerships operates under a separate franchise or dealer agreement that governs the relationship between the dealership and the manufacturer. In general, each dealer agreement specifies the location of the dealership for the sale of vehicles and for the performance of certain approved services in a specified market area. The designation of such areas generally does not guarantee exclusivity within a specified territory. In addition, most manufacturers allocate vehicles on a “turn and earn” basis that rewards high volume. A dealer agreement requires the dealer to meet specified standards regarding showrooms, facilities and equipment for servicing vehicles, inventories, minimum net working capital, personnel training and other aspects of the business. Each dealer agreement also gives the related manufacturer the right to approve the dealer operator and any material change in management or ownership of the dealership. Each manufacturer may terminate a dealer agreement under certain circumstances, such as a change in control of the dealership without manufacturer approval, the impairment of the reputation or financial condition of the dealership, the death, removal or withdrawal of the dealer operator, the conviction of the dealership or the dealership’s owner or dealer operator of certain crimes, the failure to adequately operate the dealership or maintain new vehicle financing arrangements, insolvency or bankruptcy of the dealership or a material breach of other provisions of the dealer agreement.
Many automobile manufacturers have developed policies regarding public ownership of dealerships. Policies implemented by manufacturers include the following restrictions:
| • | The ability to force the sale of their respective franchises upon a change in control of our company or a material change in the composition of our Board of Directors; |
| • | The ability to force the sale of their respective franchises if an automobile manufacturer or distributor acquires more than 5% of the voting power of our securities; and |
| • | The ability to force the sale of their respective franchises if an individual or entity (other than an automobile manufacturer or distributor) acquires more than 20% of the voting power of our securities, and the manufacturer disapproves of such individual’s or entity’s ownership interest. |
To the extent that new or amended manufacturer policies restrict the number of dealerships which may be owned by a dealership group, or the transferability of our common stock, such policies could have a material adverse effect on us. We believe that we will be able to renew at expiration all of our existing franchise and dealer agreements.
5
Many states have placed limitations upon manufacturers’ and distributors’ ability to sell new motor vehicles directly to customers in their respective states in an effort to protect dealers from practices they believe constitute unfair competition. In general, these statutes make it unlawful for a manufacturer or distributor to compete with a new motor vehicle dealer in the same brand operating under an agreement or franchise from the manufacturer or distributor in the relevant market area. Certain states, such as Florida, Georgia, Oklahoma, South Carolina, North Carolina and Virginia, limit the amount of time that a manufacturer may temporarily operate a dealership.
In addition, all of the states in which our dealerships currently do business require manufacturers to show “good cause” for terminating or failing to renew a dealer’s franchise agreement. Further, each of the states provides some method for dealers to challenge manufacturer attempts to establish dealerships of the same brand in their relevant market area.
Competition
The retail automotive industry is highly competitive. Depending on the geographic market, we compete both with dealers offering the same brands and product lines as ours and dealers offering other manufacturers’ vehicles. We also compete for vehicle sales with auto brokers, leasing companies and services offered on the Internet that provide customer referrals to other dealerships or who broker vehicle sales between customers and other dealerships. We compete with small, local dealerships and with large multi-franchise auto dealerships.
We believe that the principal competitive factors in vehicle sales are the location of dealerships, the marketing campaigns conducted by manufacturers, the ability of dealerships to offer an attractive selection of the most popular vehicles, pricing (including manufacturer rebates and other special offers) and the quality of customer service. Other competitive factors include customer preference for makes of automobiles and manufacturer warranties.
In addition to competition for vehicle sales, we also compete with other auto dealers, service stores, auto parts retailers and independent mechanics in providing parts and service. We believe that the principal competitive factors in parts and service sales are price, the use of factory-approved replacement parts, factory-trained technicians, the familiarity with a dealer’s makes and models and the quality of customer service. A number of regional and national chains offer selected parts and services at prices that may be lower than our prices.
In arranging or providing financing for our customers’ vehicle purchases, we compete with a broad range of financial institutions. In addition, financial institutions are now offering F&I products through the Internet, which may reduce our profits on these items. We believe that the principal competitive factors in providing financing are convenience, interest rates and contract terms.
Our success depends, in part, on national and regional automobile-buying trends, local and regional economic factors and other regional competitive pressures. Conditions and competitive pressures affecting the markets in which we operate, such as price-cutting by dealers in these areas, or in any new markets we enter, could adversely affect us, although the retail automobile industry as a whole might not be affected.
Governmental Regulations and Environmental Matters
Numerous federal and state regulations govern our business of marketing, selling, financing and servicing automobiles. We are also subject to laws and regulations relating to business corporations generally.
Under the laws of the states in which we currently operate as well as the laws of other states into which we may expand, we must obtain a license in order to establish, operate or relocate a dealership or operate an automotive repair service. These laws also regulate our conduct of business, including our sales, operating, advertising, financing and employment practices. These laws also include federal and state wage-hour, anti-discrimination and other employment practices laws.
6
Our financing activities with customers are subject to federal truth-in-lending, consumer privacy, consumer leasing and equal credit opportunity regulations as well as state and local motor vehicle finance laws, installment finance laws, usury laws and other installment sales laws. Some states regulate finance fees that may be paid as a result of vehicle sales.
Federal, state and local environmental regulations, including regulations governing air and water quality, the clean-up of contaminated property and the use, storage, handling, recycling and disposal of gasoline, oil and other materials, also apply to us and our dealership properties.
We believe that we comply in all material respects with the laws affecting our business. However, claims arising out of actual or alleged violations of laws may be asserted against us or our dealerships by individuals or governmental entities, and may expose us to significant damages or other penalties, including possible suspension or revocation of our licenses to conduct dealership operations and fines.
As with automobile dealerships generally, and service, parts and body shop operations in particular, our business involves the use, storage, handling and contracting for recycling or disposal of hazardous or toxic substances or wastes and other environmentally sensitive materials. Our business also involves the past and current operation and/or removal of above ground and underground storage tanks containing such substances or wastes. Accordingly, we are subject to regulation by federal, state and local authorities that establish health and environmental quality standards, provide for liability related to those standards, and in certain circumstances provide penalties for violations of those standards. We are also subject to laws, ordinances and regulations governing remediation of contamination at facilities we own or operate or to which we send hazardous or toxic substances or wastes for treatment, recycling or disposal.
We do not have any known material environmental liabilities and we believe that compliance with environmental laws and regulations will not, individually or in the aggregate, have a material adverse effect on our results of operations, financial condition and cash flows. However, soil and groundwater contamination is known to exist at certain properties used by us. Further, environmental laws and regulations are complex and subject to frequent change. In addition, in connection with our acquisitions, it is possible that we will assume or become subject to new or unforeseen environmental costs or liabilities, some of which may be material. We cannot assure you that compliance with current or amended, or new or more stringent, laws or regulations, stricter interpretations of existing laws or the future discovery of environmental conditions will not require additional expenditures by us, or that such expenditures will not be material.
Executive Officers of the Registrant
Our executive officers as of the date of this Form 10-K, are as follows:
| Name |
Age | Position(s) with Sonic | ||
| O. Bruton Smith |
81 | Chairman, Chief Executive Officer and Director | ||
| B. Scott Smith. |
40 | President, Chief Strategic Officer and Director | ||
| David P. Cosper |
53 | Vice Chairman, Chief Financial Officer |
O. Bruton Smith, 81, is our Founder, Chairman, Chief Executive Officer and a director and has served as such since our organization in January 1997, and he currently is a director and executive officer of many of our subsidiaries. Mr. Smith has worked in the retail automobile industry since 1966. Mr. Smith is also the Chairman and Chief Executive Officer, a director and controlling stockholder of Speedway Motorsports, Inc. (“SMI”). SMI is a public company traded on the New York Stock Exchange (the “NYSE”). Among other things, SMI owns and operates the following NASCAR racetracks: Atlanta Motor Speedway, Bristol Motor Speedway, Lowe’s Motor Speedway, Infineon Raceway, Las Vegas Motor Speedway, New Hampshire Motor Speedway and Texas Motor Speedway. He is also an executive officer or a director of most of SMI’s operating subsidiaries.
7
B. Scott Smith, 40, is our Co-Founder, President and Chief Strategic Officer. Prior to his appointment as President in March 2007, Mr. Smith served as our Vice Chairman and Chief Strategic Officer since October 2002. He held the position of President and Chief Operating Officer from April 1997 to October 2002. Mr. Smith has been a director of our company since our organization was formed in January 1997. Mr. Smith also serves as a director and executive officer of many of our subsidiaries. Mr. Smith, who is the son of O. Bruton Smith, has been an executive officer of Town & Country Ford since 1993, and was a minority owner of both Town & Country Ford and Fort Mill Ford before our acquisition of these dealerships in 1997. Mr. Smith became the General Manager of Town & Country Ford in November 1992 where he remained until his appointment as President and Chief Operating Officer in April 1997. Mr. Smith has over twenty years experience in the automobile dealership industry.
David P. Cosper, 53, is our Vice Chairman and Chief Financial Officer. In March 2007, Mr. Cosper was appointed to Vice Chairman after serving as Executive Vice President since March 2006. He joined Sonic Automotive on March 1, 2006 as an Executive Vice President and became our Chief Financial Officer and Treasurer on March 16, 2006. Mr. Cosper served as Treasurer through the end of 2006 and relinquished the position in February 2007. Prior to joining Sonic, he was Vice Chairman and Chief Financial Officer of Ford Motor Credit Company, a position held since 2003. From 1979, when he joined Ford Motor Company, Mr. Cosper served in a variety of positions in Ford Motor Company and Ford Motor Credit Company, including Vice President and Treasurer of Ford Motor Credit Company and Executive Director of Corporate Finance at Ford Motor Company. In such positions, he was responsible for worldwide profit analysis and treasury matters, risk management, business planning, and competitive and strategic analysis.
Employees
As of February 22, 2008, we employed approximately 11,400 people. We believe that our relationships with our employees are good. Approximately 185 of our employees, primarily service technicians in our Northern California markets, are represented by a labor union. Because of our dependence on the manufacturers, however, we may be affected by labor strikes, work slowdowns and walkouts at the manufacturers’ manufacturing facilities.
Company Information
Our website is located at www.sonicautomotive.com. Our annual report on Form 10-K, quarterly reports on Form 10-Q, current reports on Form 8-K and all amendments to those reports filed or furnished pursuant to Section 13(a) or 15(d) of the Securities Exchange Act of 1934, as amended, as well as proxy statements and other information we file with, or furnish to, the Securities and Exchange Commission (“SEC”) are available free of charge on our website. We make these documents available as soon as reasonably practicable after we electronically file them with, or furnish them to, the SEC. Except as otherwise stated in these documents, the information contained on our website or available by hyperlink from our website is not incorporated into this Annual Report on Form 10-K or other documents we file with, or furnish to, the SEC.
| Item 1A: | Risk Factors. |
Risks Related to Our Indebtedness
Our significant indebtedness could materially adversely affect our financial health, limit our ability to finance future acquisitions and capital expenditures and prevent us from fulfilling our financial obligations.
As of December 31, 2007, our total outstanding indebtedness was $1,876.3 million, including the following:
| • | $70.0 million under the 2006 Revolving Credit Sub-Facility (as defined below); |
8
| • | $1,174.3 million under the secured new and used inventory floor plan facilities, including $48.6 million classified as liabilities associated with assets held for sale; |
| • | $129.2 million in 5.25% convertible senior subordinated notes due 2009 (the “5.25% Convertibles”) representing $130.1 million in aggregate principal amount outstanding less unamortized discount of approximately $0.9 million; |
| • | $157.6 million in 4.25% convertible senior subordinated notes due 2015, redeemable on or after November 30, 2010, (the “4.25% Convertibles”) representing $160.0 million in aggregate principal amount outstanding less unamortized discount of approximately $2.4 million; |
| • | $272.8 million in 8.625% senior subordinated notes due 2013 (the “8.625% Notes”) representing $275.0 million in aggregate principal amount outstanding less unamortized net discount of approximately $2.2 million; and |
| • | $72.4 million of other secured debt, representing $67.7 million in aggregate principal amount plus unamortized premium of approximately $4.0 million and plus $0.7 million for the fair value of fixed to variable interest rate swaps. |
As of December 31, 2007, we had $205.2 million available for additional borrowings under the 2006 Revolving Credit Sub-Facility. We also have significant additional capacity under new and used floor plan facilities. In addition, the indentures relating to our 8.625% Notes, 5.25% Convertibles, 4.25% Convertibles and our other debt instruments allow us to incur additional indebtedness, including secured indebtedness. We refer to the $350 million of availability under a revolving credit facility (“2006 Revolving Credit Sub-Facility”), up to $700 million in borrowing availability for new vehicle inventory floor plan financing and up to $150 million in borrowing availability for used vehicle inventory floor plan financing collectively as our “2006 Credit Facility”.
In addition, the majority of our dealership properties are leased under long-term operating lease arrangements that generally have initial terms of fifteen to twenty years with one or two five-year renewal options. These operating leases require monthly payments of rent that may fluctuate based on interest rates and local consumer price indices. The total future minimum lease payments related to these operating leases and certain equipment leases are significant and are disclosed in the notes to our financial statements under the heading “Commitments and Contingencies” in this Annual Report on Form 10-K.
The degree to which we are leveraged could have important consequences to the holders of our securities, including the following:
| • | our ability to obtain additional financing for acquisitions, capital expenditures, working capital or general corporate purposes may be impaired in the future; |
| • | a substantial portion of our current cash flow from operations must be dedicated to the payment of principal and interest on our indebtedness, thereby reducing the funds available to us for our operations and other purposes; |
| • | some of our borrowings and facility leases are and will continue to be at variable rates of interest, which exposes us to the risk of increasing interest rates; |
| • | the indebtedness outstanding under our 2006 Credit Facility and other floor plan facilities are secured by a pledge of substantially all the assets of our dealerships; and |
| • | we may be substantially more leveraged than some of our competitors, which may place us at a relative competitive disadvantage and make us more vulnerable to changing market conditions and regulations. |
In addition, our debt agreements contain numerous covenants that limit our discretion with respect to business matters, including mergers or acquisitions, paying dividends, incurring additional debt, making capital expenditures or disposing of assets.
9
An acceleration of our obligation to repay all or a substantial portion of our outstanding indebtedness or lease obligations would have a material adverse effect on our business, financial condition or results of operations.
Our 2006 Credit Facility, the indenture governing our 8.625% Notes and many of our facility operating leases contain numerous financial and operating covenants. A breach of any of these covenants could result in a default under the applicable agreement or indenture. If a default were to occur, we may be unable to adequately finance our operations and the value of our common stock would be materially adversely affected. In addition, a default under one agreement or indenture could result in a default and acceleration of our repayment obligations under the other agreements or indentures, including the indentures governing our outstanding 5.25% Convertibles, 4.25% Convertibles and the 8.625% Notes, under the cross default provisions in those agreements or indentures. If a cross default were to occur, we may not be able to pay our debts or borrow sufficient funds to refinance them. Even if new financing were available, it may not be on terms acceptable to us. As a result of this risk, we could be forced to take actions that we otherwise would not take, or not take actions that we otherwise might take, in order to comply with the covenants in these agreements and indentures.
Our ability to make interest and principal payments when due to holders of our debt securities depends upon the receipt of sufficient funds from our subsidiaries.
Substantially all of our consolidated assets are held by our subsidiaries and substantially all of our consolidated cash flow and net income are generated by our subsidiaries. Accordingly, our cash flow and ability to service debt depends to a substantial degree on the results of operations of our subsidiaries and upon the ability of our subsidiaries to provide us with cash. We may receive cash from our subsidiaries in the form of dividends, loans or otherwise. We may use this cash to service our debt obligations or for working capital. Our subsidiaries are separate and distinct legal entities and have no obligation, contingent or otherwise, to distribute cash to us or to make funds available to service debt. In addition, the ability of our subsidiaries to pay dividends or make loans to us are subject to contractual limitations under the floor plan facilities, minimum net capital requirements under manufacturer franchise agreements and laws of the state in which a subsidiary is organized and depend to a significant degree on the results of operations of our subsidiaries and other business considerations.
Risks Related to Our Relationships with Vehicle Manufacturers
Our operations may be adversely affected if one or more of our manufacturer franchise agreements is terminated or not renewed.
Each of our dealerships operates under a franchise agreement with the applicable automobile manufacturer or distributor. Without a franchise agreement, we cannot obtain new vehicles from a manufacturer. As a result, we are significantly dependent on our relationships with these manufacturers.
Manufacturers exercise a great degree of control over the operations of our dealerships through the franchise agreements. The franchise agreements govern, among other things, our ability to purchase vehicles from the manufacturer and to sell vehicles to customers. Each of our franchise agreements provides for termination or non-renewal for a variety of causes, including any unapproved change of ownership or management. Manufacturers may also have a right of first refusal if we seek to sell dealerships.
Actions taken by manufacturers to exploit their superior bargaining position in negotiating the terms of franchise agreements or renewals of these agreements or otherwise could also have a material adverse effect on our results of operations, financial condition and cash flows. We cannot guarantee you that any of our existing franchise agreements will be renewed or that the terms and conditions of such renewals will be favorable to us.
10
Our sales volume and profit margin on each sale may be materially adversely affected if manufacturers discontinue or change their incentive programs.
Our dealerships depend on the manufacturers for certain sales incentives, warranties and other programs that are intended to promote and support dealership new vehicle sales. Manufacturers routinely modify their incentive programs in response to changing market conditions. Some of the key incentive programs include:
| • | customer rebates or below market financing on new vehicles; |
| • | employee pricing; |
| • | dealer incentives on new vehicles; |
| • | manufacturer floor plan interest and advertising assistance; |
| • | warranties on new and used vehicles; and |
| • | sponsorship of used vehicle sales by authorized new vehicle dealers. |
Manufacturers frequently offer incentives to potential customers. A reduction or discontinuation of a manufacturer’s incentive programs may materially adversely impact vehicle demand and affect our profitability.
We depend on manufacturers to supply us with sufficient numbers of popular and profitable new models.
Manufacturers typically allocate their vehicles among dealerships based on the sales history of each dealership. Supplies of popular new vehicles may be limited by the applicable manufacturer’s production capabilities. Popular new vehicles that are in limited supply typically produce the highest profit margins. We depend on manufacturers to provide us with a desirable mix of popular new vehicles. Our operating results may be materially adversely affected if we do not obtain a sufficient supply of these vehicles.
Adverse conditions affecting one or more key manufacturers may negatively impact our profitability.
During the year ended December 31, 2007, approximately 90.9% of our new vehicle revenue was derived from the sale of new vehicles manufactured by BMW, Honda (including Acura), Toyota (including Lexus), Mercedes, General Motors (including Cadillac) and Ford. Our success depends to a great extent on these manufacturers’:
| • | financial condition; |
| • | marketing; |
| • | vehicle design; |
| • | publicity concerning a particular manufacturer or vehicle model; |
| • | production capabilities; |
| • | management; |
| • | reputation; and |
| • | labor relations. |
Events such as labor strikes that may adversely affect a manufacturer may also adversely affect us. In particular, labor strikes at a manufacturer that continue for a substantial period of time could have a material adverse effect on our business. Similarly, the delivery of vehicles from manufacturers at a time later than scheduled, which may occur particularly during periods of new product introductions, could limit sales of those vehicles during those periods. This has been experienced at some of our dealerships from time to time. Adverse conditions affecting these and other important aspects of manufacturers’ operations and public relations may adversely affect our ability to sell their automobiles and, as a result, significantly and detrimentally affect our profitability.
11
In recent years, the financial condition and operating results of Ford, General Motors and Chrysler have deteriorated significantly. As of December 31, 2007, we owned 23 Ford franchises (including Volvo, Jaguar, Land Rover, Lincoln and Mercury), 38 General Motors franchises (including Cadillac, Saab, Saturn, Chevrolet, Buick, GMC, Hummer and Pontiac) and 12 Chrysler franchises (including Jeep, Dodge and Chrysler). Should the financial condition and operating results of Ford, General Motors or Chrysler continue to significantly deteriorate, it is possible that the particular manufacturer could file for bankruptcy protection. Such a bankruptcy filing by either Ford, General Motors or Chrysler could have a material adverse effect on our future results of operations, financial condition or cash flows.
Manufacturer stock ownership restrictions may impair our ability to maintain or renew franchise agreements or issue additional equity.
Some of our franchise agreements prohibit transfers of any ownership interests of a dealership and, in some cases, its parent, without prior approval of the applicable manufacturer. A number of manufacturers impose restrictions on the transferability of our Class A common stock and our ability to maintain franchises if a person acquires a significant percentage of the voting power of our common stock. Our existing franchise agreements could be terminated if a person or entity acquires a substantial ownership interest in us or acquires voting power above certain levels without the applicable manufacturer’s approval. Violations of these levels by an investor are generally outside of our control and may result in the termination or non-renewal of existing franchise agreements or impair our ability to negotiate new franchise agreements for dealerships we acquire. In addition, if we cannot obtain any requisite approvals on a timely basis, we may not be able to issue additional equity or otherwise raise capital on terms acceptable to us. These restrictions may also prevent or deter a prospective acquiror from acquiring control of us. This could adversely affect the market price of our Class A common stock.
The current holders of our Class B common stock maintain voting control over us. However, we are unable to prevent our stockholders from transferring shares of our common stock, including transfers by holders of the Class B common stock. If such transfer results in a change in control, it could result in the termination or non-renewal of one or more of our existing franchise agreements, the triggering of provisions in our agreements with certain manufacturers requiring us to sell our dealerships franchised with such manufacturers and/or a default under our credit arrangements.
Our dealers depend upon vehicle sales and, therefore, their success depends in large part upon customer demand for the particular vehicles they carry.
The success of our dealerships depends in large part on the overall success of the vehicle lines they carry. New vehicle sales generate the majority of our total revenue and lead to sales of higher-margin products and services such as finance, insurance, vehicle protection products and other aftermarket products, and parts and service operations. Although we have sought to limit our dependence on any one vehicle brand and our parts and service operations and used vehicle sales may serve to offset some of this risk, we have focused our new vehicle sales operations in mid-line import and luxury brands.
Our failure to meet a manufacturer’s customer satisfaction, financial and sales performance and facility requirements may adversely affect our ability to acquire new dealerships and our profitability.
Many manufacturers attempt to measure customers’ satisfaction with their sales and warranty service experiences through manufacturer-determined CSI scores. The components of CSI vary from manufacturer to manufacturer and are modified periodically. Franchise agreements also may impose financial and sales performance standards. Under our agreements with certain manufacturers, a dealership’s CSI scores, sales and financial performance may be considered a factor in evaluating applications for additional dealership acquisitions. From time to time, some of our dealerships have had difficulty meeting various manufacturers’ CSI requirements or performance standards. We cannot assure you that our dealerships will be able to comply with these requirements in the future. A manufacturer may refuse to consent to an acquisition of one of its franchises
12
if it determines our dealerships do not comply with its CSI requirements or performance standards, which could impair the execution of our acquisition strategy. In addition, we receive incentive payments from the manufacturers based, in part, on CSI scores, which could be materially adversely affected if our CSI scores decline.
In addition, a manufacturer may condition its allotment of vehicles, participation in bonus programs, or acquisition of additional franchises upon our compliance with its facility standards. This may put us in a competitive disadvantage with other competing dealerships and may ultimately result in our decision to sell a franchise when we believe it may be difficult to recover the cost of the required investment to reach the manufacturer’s facility standards.
If state dealer laws are repealed or weakened, our dealerships will be more susceptible to termination, non-renewal or renegotiation of their franchise agreements.
State dealer laws generally provide that a manufacturer may not terminate or refuse to renew a franchise agreement unless it has first provided the dealer with written notice setting forth good cause and stating the grounds for termination or nonrenewal. Some state dealer laws allow dealers to file protests or petitions or attempt to comply with the manufacturer’s criteria within the notice period to avoid the termination or nonrenewal. Though unsuccessful to date, manufacturers’ lobbying efforts may lead to the repeal or revision of state dealer laws. If dealer laws are repealed in the states in which we operate, manufacturers may be able to terminate our franchises without providing advance notice, an opportunity to cure or a showing of good cause. Without the protection of state dealer laws, it may also be more difficult for our dealers to renew their franchise agreements upon expiration.
In addition, these laws restrict the ability of automobile manufacturers to directly enter the retail market in the future. However, the ability of a manufacturer to grant additional franchises is based on several factors which are not within our control. If manufacturers grant new franchises in areas near or within our existing markets, this could significantly impact our revenues and/or profitability. Further, if manufacturers obtain the ability to directly retail vehicles and do so in our markets, such competition could have a material adverse effect on us.
Risks Related to Our Acquisition Strategy
Manufacturers’ restrictions on acquisitions could limit our future growth.
We are required to obtain the approval of the applicable manufacturer before we can acquire an additional dealership franchise of that manufacturer. In determining whether to approve an acquisition, manufacturers may consider many factors such as our financial condition and CSI scores. Obtaining manufacturer approval of acquisitions also takes a significant amount of time, typically three to five months. We cannot assure you that manufacturers will approve future acquisitions or do so on a timely basis, which could impair the execution of our acquisition strategy.
Certain manufacturers also limit the number of its dealerships that we may own, our national market share of that manufacturer’s products or the number of dealerships we may own in a particular geographic area. In addition, under an applicable franchise agreement or under state law, a manufacturer may have a right of first refusal to acquire a dealership that we seek to acquire.
A manufacturer may condition approval of an acquisition on the implementation of material changes in our operations or extraordinary corporate transactions, facilities improvements or other capital expenditures. If we are unable or unwilling to comply with these conditions, we may be required to sell the assets of that manufacturer’s dealerships or terminate our franchise agreement.
13
Failure to effectively integrate acquired dealerships with our existing operations could adversely affect our future operating results.
Our future operating results depend on our ability to integrate the operations of recently acquired dealerships, as well as dealerships we acquire in the future, with our existing operations. In particular, we need to integrate our management information systems, procedures and organizational structures, which can be difficult. Our growth strategy has focused on the pursuit of strategic acquisitions that either expand or complement our business.
We cannot assure you that we will effectively and profitably integrate the operations of these dealerships without substantial costs, delays or operational or financial problems, due to:
| • | the difficulties of managing operations located in geographic areas where we have not previously operated; |
| • | the management time and attention required to integrate and manage newly acquired dealerships; |
| • | the difficulties of assimilating and retaining employees; |
| • | the challenges of keeping customers; and |
| • | the challenge of retaining or attracting appropriate dealership management personnel. |
These factors could have a material adverse effect on our financial condition and results of operations.
We may not adequately anticipate all of the demands that growth through acquisitions will impose.
The automobile retailing industry is considered a mature industry in which minimal growth is expected in total unit sales. Accordingly, our ability to generate higher revenue and earnings in future periods depends in large part on our ability to acquire additional dealerships, manage geographic expansion, control costs in our operations and consolidate both past and future dealership acquisitions into our existing operations. In pursuing a strategy of acquiring other dealerships, we face risks commonly encountered with growth through acquisitions. These risks include, but are not limited to:
| • | incurring significantly higher capital expenditures and operating expenses; |
| • | failing to assimilate the operations and personnel of acquired dealerships; |
| • | entering new markets with which we are unfamiliar; |
| • | potential undiscovered liabilities and operational difficulties at acquired dealerships; |
| • | disrupting our ongoing business; |
| • | diverting our management resources; |
| • | failing to maintain uniform standards, controls and policies; |
| • | impairing relationships with employees, manufacturers and customers as a result of changes in management; |
| • | increased expenses for accounting and computer systems, as well as integration difficulties; |
| • | failure to obtain a manufacturer’s consent to the acquisition of one or more of its dealership franchises or renew the franchise agreement on terms acceptable to us; and |
| • | incorrectly valuing entities to be acquired. |
We may not adequately anticipate all of the demands that growth will impose on our systems, procedures and structures.
14
We may not be able to capitalize on acquisition opportunities because our financial resources available for acquisitions are limited.
We intend to finance our acquisitions with cash generated from operations, through issuances of our stock or debt securities and through borrowings under credit arrangements. We may not be able to obtain additional financing by issuing stock or debt securities due to the market price of our Class A common stock, overall market conditions or the need for manufacturer consent to the issuance of equity securities. Using cash to complete acquisitions could substantially limit our operating or financial flexibility. If we are unable to obtain financing on acceptable terms, we may be required to reduce the scope of our presently anticipated expansion, which could materially adversely affect our overall growth strategy.
In addition, we are dependent to a significant extent on our ability to finance our new vehicle inventory with “floor plan financing.” Floor plan financing arrangements allow us to borrow money to buy a particular vehicle from the manufacturer and pay off the loan when we sell that particular vehicle. We must obtain new floor plan financing or obtain consents to assume existing floor plan financing in connection with our acquisition of dealerships.
Substantially all the assets of our dealerships are pledged to secure the indebtedness under the 2006 Credit Facility and our separate floor plan indebtedness with the respective captive finance subsidiaries of BMW, Chrysler, Ford, General Motors and Mercedes. Three of the lenders under the 2006 Credit Facility are the respective captive finance subsidiaries of BMW, Nissan and Toyota. These pledges may impede our ability to borrow from other sources. Moreover, because the identified manufacturer captive finance subsidiaries are either owned or affiliated with BMW, Mercedes, Chrysler, Ford, General Motors, Nissan and Toyota, respectively, any deterioration of our relationship with the particular captive finance subsidiary could adversely affect our relationship with the affiliated manufacturer, and vice-versa.
We may not be able to continue executing our acquisition strategy without the costs of future acquisitions escalating.
We have grown our business primarily through acquisitions. We may not be able to consummate any future acquisitions at acceptable prices and terms or identify suitable candidates. In addition, increased competition for acquisition candidates could result in fewer acquisition opportunities for us and higher acquisition prices. The magnitude, timing, pricing and nature of future acquisitions will depend upon various factors, including:
| • | the availability of suitable acquisition candidates; |
| • | competition with other dealer groups for suitable acquisitions; |
| • | the negotiation of acceptable terms with the seller and with the manufacturer; |
| • | our financial capabilities; |
| • | our stock price; and |
| • | the availability of skilled employees to manage the acquired companies. |
We may not be able to determine the actual financial condition of dealerships we acquire until after we complete the acquisition and take control of the dealerships.
The operating and financial condition of acquired businesses cannot be determined accurately until we assume control. Although we conduct what we believe to be a prudent level of investigation regarding the operating and financial condition of the businesses we purchase, in light of the circumstances of each transaction, an unavoidable level of risk remains regarding the actual operating condition of these businesses. Similarly, many of the dealerships we acquire, including our largest acquisitions, do not have financial statements audited or prepared in accordance with generally accepted accounting principles. We may not have an accurate
15
understanding of the historical financial condition and performance of our acquired entities. Until we actually assume control of business assets and their operations, we may not be able to ascertain the actual value or understand the potential liabilities of the acquired entities and their operations.
Although O. Bruton Smith, our chairman and chief executive officer, and his affiliates have previously assisted us with obtaining financing, we cannot assure you that he or they will be willing or able to do so in the future.
Our obligations under the 2006 Credit Facility are secured with a pledge of shares of common stock of Speedway Motorsports, Inc., a publicly traded owner and operator of automobile racing facilities. These shares of Speedway Motorsports common stock are beneficially owned by Sonic Financial Corporation (“SFC”), an entity controlled by Mr. Smith. Presently, the $350.0 million borrowing limit of our 2006 Revolving Credit Sub-Facility is subject to a borrowing base calculation that is based, in part, on the value of the Speedway Motorsports shares pledged by SFC. Consequently, a withdrawal of this pledge by SFC or a significant decrease in the value of Speedway Motorsports common stock could reduce the amount we can borrow under the 2006 Revolving Credit Sub-Facility.
Mr. Smith has also guaranteed additional indebtedness incurred to complete certain dealership acquisitions. Mr. Smith may not be willing or able to provide similar guarantees or credit support in the future. This could impair our ability to obtain acquisition financing on favorable terms.
Risks Related to the Automotive Retail Industry
Increasing competition among automotive retailers reduces our profit margins on vehicle sales and related businesses. Further, the use of the Internet in the car purchasing process could materially adversely affect us.
Automobile retailing is a highly competitive business. Our competitors include publicly and privately owned dealerships, some of which are larger and have greater financial and marketing resources than we do. Many of our competitors sell the same or similar makes of new and used vehicles that we offer in our markets at competitive prices. We do not have any cost advantage in purchasing new vehicles from manufacturers due to economies of scale or otherwise. In addition, the popularity of short-term vehicle leasing in the past few years has resulted, as these leases expire, in a large increase in the number of late model used vehicles available in the market, which puts added pressure on new and used vehicle margins. We typically rely on advertising, merchandising, sales expertise, service reputation and dealership location to sell new vehicles. Our revenues and profitability could be materially adversely affected if manufacturers decide to enter the retail market directly.
Our F&I business and other related businesses, which have higher margins than sales of new and used vehicles, are subject to strong competition from various financial institutions and other third parties.
The Internet has become a significant part of the sales process in our industry. Customers are using the Internet to compare pricing for cars and related F&I services, which may further reduce margins for new and used cars and profits for related F&I services. If Internet new vehicle sales are allowed to be conducted without the involvement of franchised dealers, our business could be materially adversely affected. In addition, other franchise groups have aligned themselves with services offered on the Internet or are investing heavily in the development of their own Internet capabilities, which could materially adversely affect our business.
Our franchise agreements do not grant us the exclusive right to sell a manufacturer’s product within a given geographic area. Our revenues or profitability could be materially adversely affected if any of our manufacturers award franchises to others in the same markets where we operate or if existing franchised dealers increase their market share in our markets.
16
As we seek to acquire dealerships in new markets, we may face increasingly significant competition as we strive to gain market share through acquisitions or otherwise. Our operating margins may decline over time as we expand into markets where we do not have a leading position.
Our business will be harmed if overall consumer demand suffers from a severe or sustained downturn.
Our business is heavily dependent on consumer demand and preferences. Our revenues will be materially and adversely affected if there is a severe or sustained downturn in overall levels of consumer spending. Retail vehicle sales are cyclical and historically have experienced periodic downturns characterized by oversupply and weak demand. These cycles are often dependent on general economic conditions and consumer confidence, as well as the level of discretionary personal income and credit availability. Economic recessions may have a material adverse effect on our retail business, particularly sales of new and used automobiles.
In addition, severe or sustained increases in gasoline prices may lead to a reduction in automobile purchases or a shift in buying patterns from luxury and sport utility vehicle models (which typically provide high margins to retailers) to smaller, more economical vehicles (which typically have lower margins).
A decline of available financing in the sub-prime lending market has, and may continue to, adversely affect our sales of used vehicles.
A significant portion of vehicle buyers, particularly in the used car market, finance their purchases of automobiles. Sub-prime lenders have historically provided financing for consumers who, for a variety of reasons including poor credit histories and lack of down payment, do not have access to more traditional finance sources. Our recent experience suggests that sub-prime lenders have tightened their credit standards and may continue to apply these higher standards in the future. This has adversely affected our used vehicle sales. If sub-prime lenders continue to apply these higher standards or if there is any further tightening of credit standards used by sub-prime lenders or if there is any additional decline in the overall availability of credit in the sub-prime lending market, the ability of these consumers to purchase vehicles could be limited which could have a material adverse effect on our used car business, revenues and profitability.
Our business may be adversely affected by import product restrictions and foreign trade risks that may impair our ability to sell foreign vehicles profitably.
A significant portion of our new vehicle business involves the sale of vehicles, parts or vehicles composed of parts that are manufactured outside the United States. As a result, our operations are subject to customary risks of importing merchandise, including fluctuations in the relative values of currencies, import duties, exchange controls, trade restrictions, work stoppages and general political and socio-economic conditions in other countries. The United States or the countries from which our products are imported may, from time to time, impose new quotas, duties, tariffs or other restrictions, or adjust presently prevailing quotas, duties or tariffs, which may affect our operations and our ability to purchase imported vehicles and/or parts at reasonable prices.
The seasonality of our business magnifies the importance of second and third quarter operating results.
Our business is subject to seasonal variations in revenues. In our experience, demand for automobiles is generally lower during the first and fourth quarters of each year. We therefore receive a disproportionate amount of revenues generally in the second and third quarters and expect our revenues and operating results to be generally lower in the first and fourth quarters. Consequently, if conditions surface during the second and third quarters that impair vehicle sales, such as higher fuel costs, depressed economic conditions or similar adverse conditions, our revenues for the year could be disproportionately adversely affected.
17
General Risks Related to Investing in Our Securities
Concentration of voting power and anti-takeover provisions of our charter, bylaws, Delaware law and our dealer agreements may reduce the likelihood of any potential change of control.
Our common stock is divided into two classes with different voting rights. This dual class stock ownership allows the present holders of the Class B common stock to control us. Holders of Class A common stock have one vote per share on all matters. Holders of Class B common stock have 10 votes per share on all matters, except that they have only one vote per share on any transaction proposed or approved by the Board of Directors or a Class B common stockholder or otherwise benefiting the Class B common stockholders constituting a:
| • | “going private” transaction; |
| • | disposition of substantially all of our assets; |
| • | transfer resulting in a change in the nature of our business; or |
| • | merger or consolidation in which current holders of common stock would own less than 50% of the common stock following such transaction. |
The holders of Class B common stock currently hold less than a majority of our outstanding common stock, but a majority of our voting power. This may prevent or discourage a change of control of us even if the action was favored by holders of Class A common stock.
Our charter and bylaws make it more difficult for our stockholders to take corporate actions at stockholders’ meetings. In addition, options under our 1997 Stock Option Plan and 2004 Stock Incentive Plan become immediately exercisable upon a change in control. Delaware law also makes it difficult for stockholders who have recently acquired a large interest in a company to consummate a business combination transaction with the company against its directors’ wishes. Finally, restrictions imposed by our dealer agreements may impede or prevent any potential takeover bid. Generally, our franchise agreements allow the manufacturers the right to terminate the agreements upon a change of control of our company and impose restrictions upon the transferability of any significant percentage of our stock to any one person or entity who may be unqualified, as defined by the manufacturer, to own one of its dealerships. The inability of a person or entity to qualify with one or more of our manufacturers may prevent or seriously impede a potential takeover bid. In addition, provisions of our lending arrangements create an event of default on a change in control. These agreements, corporate governance documents and laws may have the effect of delaying or preventing a change in control or preventing stockholders from realizing a premium on the sale of their shares if we were acquired.
The outcome of legal and administrative proceedings we are or may become involved in could have an adverse effect on our business, results of operations and profitability.
We are involved, and expect to continue to be involved, in numerous legal and administrative proceedings arising out of the conduct of our business, including regulatory investigations and private civil actions brought by plaintiffs purporting to represent a potential class or for which a class has been certified, such as the following.
Several private civil actions have been filed against Sonic Automotive, Inc. and several of our dealership subsidiaries that purport to represent classes of customers as potential plaintiffs and make allegations that certain products sold in the finance and insurance departments were done so in a deceptive or otherwise illegal manner. One of these private civil actions has been filed in South Carolina state court against Sonic Automotive, Inc. and 10 of our South Carolina subsidiaries. We have been advised that the plaintiffs’ attorneys in this South Carolina private civil action intend to file private civil class actions against Sonic Automotive, Inc. and certain of its subsidiaries in other states. This group of plaintiffs’ attorneys has filed another one of these private civil class action lawsuits in state court in North Carolina seeking certification of a multi-state class of plaintiffs. The South Carolina state court action and the North Carolina state court action have since been consolidated into a single
18
proceeding in private arbitration. Another one of these private civil actions has been filed in Tennessee state court against Sonic Automotive, Inc. and one of our Tennessee subsidiaries.
The outcomes of the civil actions brought by plaintiffs purporting to represent a class of customers, as well as other pending and future legal proceedings arising out of the conduct of our business, including litigation with customers, employment related lawsuits, contractual disputes, class actions, purported class actions and actions brought by governmental authorities, cannot be predicted with certainty. An unfavorable resolution of one or more of these matters could have a material adverse effect on our business, financial condition, results of operations, cash flows or prospects.
Our company is a defendant in the matter of Galura, et al. v. Sonic Automotive, Inc., a private civil action filed in the Circuit Court of Hillsborough County, Florida. In this action, originally filed on December 30, 2002, the plaintiffs allege that we and our Florida dealerships sold an antitheft protection product in a deceptive or otherwise illegal manner, and further sought representation on behalf of any customer of any of our Florida dealerships who purchased the antitheft protection product since December 30, 1998. The plaintiffs are seeking monetary damages and injunctive relief on behalf of this class of customers. In June 2005, the court granted the plaintiffs’ motion for certification of the requested class of customers, but the court has made no finding to date regarding actual liability in this lawsuit. We have subsequently filed a notice of appeal of the court’s class certification ruling with the Florida Court of Appeals. In April 2007, the Florida Court of Appeals affirmed a portion of the trial court’s class certification, and overruled a portion of the trial court’s class certification. We intend to continue our vigorous defense of this lawsuit, including the aforementioned appeal of the trial court’s class certification order, and to assert available defenses. However, an adverse resolution of this lawsuit could result in the payment of significant costs and damages, which could have a material adverse effect on our future results of operations, financial condition and cash flows.
Our business may be adversely affected by claims alleging violations of laws and regulations in our advertising, sales and finance and insurance activities.
Our business is highly regulated. In the past several years, private plaintiffs and state attorney generals have increased their scrutiny of advertising, sales, and finance and insurance activities in the sale and leasing of motor vehicles. The conduct of our business is subject to numerous federal, state and local laws and regulations regarding unfair, deceptive and/or fraudulent trade practices (including advertising, marketing, sales, insurance, repair and promotion practices), truth-in-lending, consumer leasing, fair credit practices, equal credit opportunity, privacy, insurance, motor vehicle finance, installment finance, closed-end credit, usury and other installment sales. Claims arising out of actual or alleged violations of law may be asserted against us or any of our dealers by individuals, either individually or through class actions, or by governmental entities in civil or criminal investigations and proceedings. Such actions may expose us to substantial monetary damages and legal defense costs, injunctive relief and criminal and civil fines and penalties, including suspension or revocation of our licenses and franchises to conduct dealership operations.
Our business may be adversely affected by unfavorable conditions in our local markets, even if those conditions are not prominent nationally.
Our performance is subject to local economic, competitive, weather and other conditions prevailing in geographic areas where we operate. For example, our current results of operations depend substantially on general economic conditions and consumer spending habits in our Northern California and Houston markets. Revenues in our Northern California and Houston markets represented approximately 31.6% of our total revenues for the year ended December 31, 2007. We may not be able to expand geographically and any geographic expansion may not adequately insulate us from the adverse effects of local or regional economic conditions. In addition, due to the provisions and terms contained in our operating lease agreements, we may not be able to relocate a dealership operation to a more favorable location without incurring significant costs or penalties.
19
The loss of key personnel and limited management and personnel resources could adversely affect our operations and growth.
Our success depends to a significant degree upon the continued contributions of our management team, particularly our senior management, and service and sales personnel. Additionally, manufacturer franchise agreements may require the prior approval of the applicable manufacturer before any change is made in franchise general managers. We do not have employment agreements with certain members of our senior management team, our dealership managers and other key dealership personnel. Consequently, the loss of the services of one or more of these key employees could have a material adverse effect on our results of operations.
In addition, as we expand we may need to hire additional managers. The market for qualified employees in the industry and in the regions in which we operate, particularly for general managers and sales and service personnel, is highly competitive and may subject us to increased labor costs during periods of low unemployment. The loss of the services of key employees or the inability to attract additional qualified managers could have a material adverse effect on our results of operations. In addition, the lack of qualified management or employees employed by potential acquisition candidates may limit our ability to consummate future acquisitions.
Governmental regulation and environmental regulation compliance costs may adversely affect our profitability.
We are subject to a wide range of federal, state and local laws and regulations, such as local licensing requirements, retail financing and consumer protection laws and regulations, and wage-hour, anti-discrimination and other employment practices laws and regulations. Our facilities and operations are also subject to federal, state and local laws and regulations relating to environmental protection and human health and safety, including those governing wastewater discharges, air emissions, the operation and removal of underground and aboveground storage tanks, the use, storage, treatment, transportation, release, recycling and disposal of solid and hazardous materials and wastes and the cleanup of contaminated property or water. The violation of these laws and regulations can result in administrative, civil or criminal penalties against us or in a cease and desist order against our operations that are not in compliance. Our future acquisitions may also be subject to regulation, including antitrust reviews. We believe that we comply in all material respects with all laws and regulations applicable to our business, but future regulations may be more stringent and require us to incur significant additional compliance costs.
Our past and present business operations are subject to environmental laws and regulations. We may be required by these laws to pay the full amount of the costs of investigation and/or remediation of contaminated properties, even if we are not at fault for disposal of the materials or if such disposal was legal at the time. Like many of our competitors, we have incurred, and will continue to incur, capital and operating expenditures and other costs in complying with these laws and regulations. In addition, soil and groundwater contamination exists at certain of our properties. We cannot assure you that our other properties have not been or will not become similarly contaminated. In addition, we could become subject to potentially material new or unforeseen environmental costs or liabilities because of our acquisitions.
Potential conflicts of interest between us and our officers or directors could adversely affect our future performance.
O. Bruton Smith serves as the chairman and chief executive officer of Speedway Motorsports. Accordingly, we compete with Speedway Motorsports for the management time of Mr. Smith.
We have in the past and will likely in the future enter into transactions with Mr. Smith, entities controlled by Mr. Smith or our other affiliates. We believe that all of our existing arrangements with affiliates are as favorable to us as if the arrangements were negotiated between unaffiliated parties, although the majority of these transactions have neither been verified by third parties in that regard nor are likely to be so verified in the future.
20
Potential conflicts of interest could arise in the future between us and our officers or directors in the enforcement, amendment or termination of arrangements existing between them.
We may be subject to substantial withdrawal liability assessments in the future related to a multi-employer pension plan to which certain of our dealerships make contributions pursuant to collective bargaining agreements.
Seven of our dealership subsidiaries in Northern California currently make fixed-dollar contributions to the Automotive Industries Pension Plan pursuant to collective bargaining agreements between our subsidiaries and the International Association of Machinists. The AI Pension Plan is a “multi-employer pension plan” as defined under the Employee Retirement Income Security Act of 1974, as amended, and our seven dealership subsidiaries are among approximately 120 automobile dealerships that make contributions to the AI Pension Plan pursuant to collective bargaining agreements with the IAM. In June 2006, we received information that the AI Pension Plan was substantially underfunded as of December 31, 2005. In July 2007, we received updated information that the AI Pension Plan continued to be substantially underfunded as of December 31, 2006, with the amount of such underfunding increasing versus year end 2005. Under applicable federal law, any employer contributing to a multiemployer pension plan that completely ceases participating in the plan while the plan is underfunded is subject to payment of such employer’s assessed share of the aggregate unfunded vested benefits of the plan. In certain circumstances, an employer can be assessed withdrawal liability for a partial withdrawal from a multi-employer pension plan. In addition, if the financial condition of the AI Pension Plan were to continue to deteriorate to the point that the Plan is forced to terminate and be assumed by the Pension Benefit Guaranty Corporation, the participating employers could be subject to assessments by the PBGC to cover the participating employers’ assessed share of the unfunded vested benefits. If any of these adverse events were to occur in the future, it could result in a substantial withdrawal liability assessment that could have a material adverse effect on our business, financial condition, results of operations or cash flows.
A change in historical experience and/or assumptions used to estimate reserves could have a material impact on our earnings.
As described in Item 7 under the heading “Management’s Discussion and Analysis of Financial Condition and Results of Operations—Use of Estimates and Critical Accounting Policies” in this Annual Report on Form 10-K, our estimates for finance, insurance and service contracts and insurance reserves are based on historical experience. Differences between actual results and our historical experiences and/or our assumptions could have a material impact on our earnings in the period of the change and in periods subsequent to the change.
An impairment of our goodwill could have a material adverse impact on our earnings.
Pursuant to applicable accounting pronouncements, we test goodwill for impairment annually or more frequently if an event occurs or circumstances change that would more likely than not reduce the fair value of a reporting unit below its carrying amount. We describe the process for testing goodwill more thoroughly in this Annual Report on Form 10-K in Item 7 under the heading “Management’s Discussion and Analysis of Financial Condition and Results of Operations—Use of Estimates and Critical Accounting Policies.” If we determine that the amount of our goodwill is impaired at any point in time, we will be required to reduce goodwill on our balance sheet. As of December 31, 2007, our balance sheet reflected a carrying amount of approximately $1,284.9 million in goodwill (including goodwill classified as assets held for sale). If goodwill is impaired, we will record a significant non-cash impairment charge that would likely have a material adverse effect on our earnings for the period in which the impairment of goodwill occurred.
| Item 1B: | Unresolved Staff Comments. |
None.
21
| Item 2: | Properties. |
Our principal executive offices are located at 6415 Idlewild Road, Suite 109, Charlotte, North Carolina 28212, and our telephone number is (704) 566-2400. We lease these offices from a related party. See Note 8 to our Consolidated Financial Statements.
Our dealerships are generally located along major U.S. or interstate highways. One of the principal factors we consider in evaluating an acquisition candidate is its location. We prefer to acquire dealerships located along major thoroughfares, which can be easily visited by prospective customers.
We lease the majority of the properties utilized by our dealership operations from affiliates of Capital Automotive REIT (“CARS”) and other individuals and entities. The properties utilized by our dealership operations that are owned by us or one of our subsidiaries are pledged as security for our 2006 Credit Facility or under mortgages. We believe that our facilities are adequate for our current needs.
Under the terms of our franchise agreements, each of our dealerships must maintain an appropriate appearance and design of its dealership facility and is restricted in its ability to relocate.
| Item 3: | Legal Proceedings. |
We are a defendant in the matter of Galura, et al. v. Sonic Automotive, Inc., a private civil action filed in the Circuit Court of Hillsborough County, Florida. In this action, originally filed on December 30, 2002, the plaintiffs allege that we and our Florida dealerships sold an antitheft protection product in a deceptive or otherwise illegal manner, and further sought representation on behalf of any customer of any of our Florida dealerships who purchased the antitheft protection product since December 30, 1998. The plaintiffs are seeking monetary damages and injunctive relief on behalf of this class of customers. In June 2005, the court granted the plaintiffs’ motion for certification of the requested class of customers, but the court has made no finding to date regarding actual liability in this lawsuit. We subsequently filed a notice of appeal of the court’s class certification ruling with the Florida Court of Appeals. In April 2007, the Florida Court of Appeals affirmed a portion of the trial court’s class certification, and overruled a portion of the trial court’s class certification. We intend to continue our vigorous appeal and defense of this lawsuit and to assert available defenses. However, an adverse resolution of this lawsuit could result in the payment of significant costs and damages, which could have a material adverse effect on our future results of operations, financial condition and cash flows. Currently, we are unable to estimate a range of potential loss related to this matter.
We are involved, and expect to continue to be involved, in numerous legal and administrative proceedings arising out of the conduct of our business, including regulatory investigations and private civil actions brought by plaintiffs purporting to represent a potential class or for which a class has been certified. Although we vigorously defend ourselves in all legal and administrative proceedings, the outcomes of pending and future proceedings arising out of the conduct of our business, including litigation with customers, employment related lawsuits, contractual disputes, class actions, purported class actions and actions brought by governmental authorities, cannot be predicted with certainty. An unfavorable resolution of one or more of these matters could have a material adverse effect on our business, financial condition, results of operations, cash flows or prospects.
| Item 4: | Submission of Matters to a Vote of Security Holders. |
Not applicable.
22
PART II
| Item 5: | Market for Registrant’s Common Equity, Related Stockholder Matters and Issuer Purchases of Equity Securities. |
Our Class A common stock is currently traded on the NYSE under the symbol “SAH.” Our Class B Common Stock is not traded on a public market.
As of February 20, 2008, there were 28,837,932 shares of Sonic’s Class A common stock and 12,029,375 shares of our Class B common stock outstanding. As of February 20, 2008, there were 79 record holders of the Class A common stock and three record holders of the Class B common stock. As of February 20, 2008, the closing stock price for the Class A common stock was $20.01.
Our Board of Directors approved four quarterly cash dividends on all outstanding shares of common stock totaling $0.48 per share during 2006 and 2007. Our Board of Directors has also approved a dividend of $0.12 per share on all outstanding shares of common stock for shareholders of record on March 15, 2008, which will be paid on April 15, 2008. See Note 6 to our Consolidated Financial Statements and Item 7: Management’s Discussion and Analysis of Financial Condition and Results of Operations for additional discussion of dividends for a description of restrictions on the payment of dividends.
The following table sets forth the high and low closing sales prices for Sonic’s Class A common stock for each calendar quarter during the periods indicated as reported by the NYSE Composite Tape and the dividends declared during such periods.
| 2007 |
Market Price | Cash Dividend Declared | |||||||
| High | Low | ||||||||
| First Quarter |
$ | 32.86 | $ | 28.04 | $ | 0.12 | |||
| Second Quarter |
31.82 | 28.36 | 0.12 | ||||||
| Third Quarter. |
30.26 | 23.94 | 0.12 | ||||||
| Fourth Quarter |
25.57 | 19.36 | 0.12 | ||||||
| 2006 |
|||||||||
| First Quarter |
$ | 28.43 | $ | 22.72 | $ | 0.12 | |||
| Second Quarter |
28.53 | 21.85 | 0.12 | ||||||
| Third Quarter. |
23.31 | 21.08 | 0.12 | ||||||
| Fourth Quarter |
29.50 | 22.76 | 0.12 | ||||||
During 2007, all sales of our equity securities were registered under the Securities Act.
23
Issuer Purchases of Equity Securities
The following table sets forth information about the shares of Class A Common Stock we repurchased during the quarter ended December 31, 2007.
| Total Number of Shares Purchased (1) |
Average Price Paid per Share |
Total Number of Shares Purchased as Part of Publicly Announced Plans or Programs (2) |
Approximate Dollar Value of Shares That May Yet Be Purchased Under the Plans or Programs | |||||||
| (amounts in thousands, except per share amounts) | ||||||||||
| October 2007 |
367 | $ | 24.24 | 367 | $ | 38,879 | ||||
| November 2007 |
— | $ | — | — | $ | 38,879 | ||||
| December 2007 |
271 | $ | 20.51 | 271 | $ | 33,332 | ||||
| Total |
638 | $ | 22.66 | 638 | ||||||
| (1) | All shares repurchased were part of publicly announced share repurchase programs |
| (2) | Our publicly announced Class A Common Stock repurchase authorizations occurred as follows: |
| (amounts in thousands) | |||
| November 1999 |
$ | 25,000 | |
| February 2000 |
25,000 | ||
| December 2000 |
25,000 | ||
| May 2001 |
25,000 | ||
| August 2002 |
25,000 | ||
| February 2003 |
20,000 | ||
| December 2003 |
20,000 | ||
| July 2004 |
20,000 | ||
| July 2007 |
30,000 | ||
| October 2007 |
40,000 | ||
| Total |
$ | 255,000 | |
| Item 6: | Selected Financial Data. |
This selected consolidated financial data should be read in conjunction with “Management’s Discussion and Analysis of Financial Condition and Results of Operations” and the consolidated financial statements and related notes included elsewhere in this Annual Report on Form 10-K.
We have accounted for all of our dealership acquisitions using the purchase method of accounting and, as a result, we do not include in our consolidated financial statements the results of operations of these dealerships prior to the date we acquired them. Our selected consolidated financial data reflect the results of operations and financial positions of each of our dealerships acquired prior to December 31, 2007. As a result of the effects of our acquisitions and other potential factors in the future, the historical consolidated financial information described in selected consolidated financial data is not necessarily indicative of the results of our operations and financial position in the future or the results of operations and financial position that would have resulted had such acquisitions occurred at the beginning of the periods presented in the selected consolidated financial data.
24
| Year Ended December 31, | |||||||||||||||
| 2003 | 2004 | 2005 | 2006 | 2007 | |||||||||||
| Income Statement Data (1) (2): |
|||||||||||||||
| Total revenues . |
$ | 6,046,898 | $ | 6,540,693 | $ | 7,318,800 | $ | 7,985,079 | $ | 8,336,933 | |||||
| Income from continuing operations before income taxes. |
$ | 125,229 | $ | 144,436 | $ | 168,175 | $ | 162,322 | $ | 189,213 | |||||
| Income from continuing operations. |
$ | 82,852 | $ | 89,699 | $ | 105,713 | $ | 96,832 | $ | 114,836 | |||||
| Basic earnings per share from continuing operations. |
$ | 2.02 | $ | 2.17 | $ | 2.53 | $ | 2.29 | $ | 2.70 | |||||
| Diluted earnings per share from continuing operations . |
$ | 1.94 | $ | 2.08 | $ | 2.42 | $ | 2.18 | $ | 2.54 | |||||
| Consolidated Balance Sheet Data (2): |
|||||||||||||||
| Total assets. |
$ | 2,685,113 | $ | 2,897,884 | $ | 3,025,501 | $ | 3,124,764 | 3,282,744 | ||||||
| Total long-term debt |
$ | 696,285 | $ | 671,796 | $ | 715,058 | $ | 601,334 | $ | 701,997 | |||||
| Total long-term liabilities (including long-term debt) |
$ | 791,239 | $ | 799,436 | $ | 876,956 | $ | 791,938 | $ | 929,996 | |||||
| Cash dividends declared per common share. |
$ | 0.20 | $ | 0.44 | $ | 0.48 | $ | 0.48 | $ | 0.48 | |||||
| (1) | In accordance with the provisions of Statement of Financial Accounting Standards (“SFAS”) No. 144, “Accounting for the Impairment or Disposal of Long-Lived Assets”, income statement data reflect reclassifications from the prior years presentation to exclude franchises sold, identified for sale, or terminated subsequent to December 31, 2006 which had not been previously included in discontinued operations. See Note 2 to our accompanying Consolidated Financial Statements, Business Acquisitions and Dispositions, which discusses these and other factors that affect the comparability of the information for the periods presented. |
| (2) | As mentioned in Management's Discussion and Analysis of Financial Condition and Results of Operations—Liquidity and Capital Resources and Note 2 to our accompanying Consolidated Financial Statements, business combinations and dispositions have had a material impact on our reported financial information. |
| Item 7: | Management’s Discussion and Analysis of Financial Condition and Results of Operations. |
The following discussion and analysis of the results of operations and financial condition should be read in conjunction with the Sonic Automotive, Inc. and Subsidiaries Consolidated Financial Statements and the related notes thereto appearing elsewhere in this Annual Report on Form 10-K. The financial and statistical data contained in the following discussion for all periods presented reflects our December 31, 2007 classification of franchises between continuing and discontinued operations in accordance with SFAS No. 144.
Overview
We are one of the largest automotive retailers in the United States. As of February 22, 2008, we operated 169 dealership franchises, representing 33 different brands of cars and light trucks, at 144 locations and 34 collision repair centers in 15 states. Our dealerships provide comprehensive services including sales of both new and used cars and light trucks, sales of replacement parts, performance of vehicle maintenance, manufacturer warranty repairs, paint and collision repair services, and arrangement of extended service contracts, financing, insurance and other aftermarket products for our customers. Although vehicle sales are cyclical and are affected by many factors, including general economic conditions, consumer confidence, levels of discretionary personal income, interest rates and available credit, our parts, service and collision repair services are not closely tied to vehicle sales and are not as dependent upon near-term sales volume. As a result, we believe the diversity of these products and services reduces the risk of periodic economic downturns.
25
The automobile industry’s total amount of new vehicles sold decreased by 2.5% to 16.1 million vehicles in 2007 from 16.6 million vehicles in 2006. From an industry perspective, new vehicle unit sales on a year-over-year basis grew 3.0% for import brands and contracted 7.1% for domestic brands. Many factors such as brand and geographic concentrations have caused our past results to differ from the industry’s overall trend.
We sell similar products and services that exhibit similar economic characteristics, use similar processes in selling our products and services and sell our products and services to similar classes of customers. As a result of this and the way we manage our business, we have a single operating segment for purposes of reporting financial condition and results of operations.
In the ordinary course of business, we evaluate our dealership franchises for possible disposition based on various performance criteria. During the year ended December 31, 2007, we disposed of 12 franchises and had approved, but not completed, the disposition of 20 additional franchises. These franchises have been identified as held for sale because of unprofitable operations or other strategic considerations. We believe the disposition of these franchises will allow us to focus our management attention on those remaining stores with the highest potential return on investment.
Use of Estimates and Critical Accounting Policies
The preparation of financial statements in conformity with accounting principles generally accepted in the United States of America requires management to make estimates and assumptions that affect the reported amounts of assets and liabilities and disclosure of contingent assets and liabilities at the date of the financial statements and the reported amounts of revenues and expenses during the reporting period. Actual results could differ from those estimates.
Critical accounting policies are those that are both most important to the portrayal of our financial position and results of operations and require the most subjective and complex judgments. The following is a discussion of what we believe are our critical accounting policies and estimates. See Note 1 to our Consolidated Financial Statements for additional discussion regarding our accounting policies.
Finance, Insurance and Service Contracts
We arrange financing for customers through various financial institutions and receive a commission from the lender either in a flat fee amount or in an amount equal to the difference between the actual interest rates charged to customers and the predetermined base rates set by the financing institution. We also receive commissions from the sale of various insurance contracts and non-recourse third party extended service contracts to customers. Under these contracts, the applicable manufacturer or third party warranty company is directly liable for all warranties provided within the contract.
In the event a customer terminates a financing, insurance or extended service contract prior to the original termination date, we may be required to return a portion of the commission revenue originally recorded to the third party provider (“chargebacks”). The commission revenue for the sale of these products and services is recorded net of estimated chargebacks at the time of sale. Our estimate of future chargebacks is established based on our historical chargeback rates, termination provisions of the applicable contracts and industry data. While chargeback rates vary depending on the type of contract sold, a 100 basis point change in the estimated chargeback rates used in determining our estimates of future chargebacks would have changed our estimated reserve for chargebacks at December 31, 2007 by approximately $3.5 million. Our estimate of chargebacks ($13.0 million as of December 31, 2007) is influenced by early contract termination events such as vehicle repossessions, refinancings and early pay-off. If these factors change, the resulting impact is a change in our estimate for chargebacks.
26
Goodwill
Goodwill is tested for impairment at least annually, or more frequently when events or circumstances indicate that impairment might have occurred. Based on criteria established by the applicable accounting pronouncements, we have one reporting unit. There was $1,284.9 million of goodwill on our balance sheet, including approximately $8.8 million classified in assets held for sale, at December 31, 2007.
In evaluating goodwill for impairment, if the fair value of our reporting unit is less than its carrying value, we are then required to proceed to the second step of the impairment test. The second step involves allocating the calculated fair value to all of the assets of the reporting unit as if the calculated fair value was the purchase price in a business combination. This allocation would include assigning value to any previously unrecognized identifiable assets (including franchise assets) which means the remaining fair value that would be allocated to goodwill would be significantly reduced. See discussion regarding franchise agreements acquired prior to July 1, 2001 in Note 1 to our Consolidated Financial Statements. We would then compare the fair value of the goodwill resulting from this allocation process to the carrying value of the goodwill in the reporting unit with the difference representing the amount of impairment.
In completing step one of the impairment analysis, we use various fair value approaches which consist of an earnings multiple model and a discounted cash flow model. The results from each of these models are then analyzed to determine if an indicator of impairment exists. The primary assumptions used in these various models include historical pretax earnings, estimated average earnings multiples of public automotive retailers, future growth assumptions, weighted average cost of capital along with working capital and capital expenditure requirements. To the extent the reporting unit’s earnings decline significantly or there are changes in one or more of these assumptions that would result in lower valuation results, it could cause the carrying value of the reporting unit to exceed its fair value and thus require us to conduct the second step of the impairment test described above.
At December 31, 2007, the fair value of our reporting unit exceeded the carrying value of the reporting unit (step one of the above described impairment test). As a result, we were not required to conduct the second step of the impairment test described above.
However, if in future periods we determine that the fair value of our reporting unit is less than its carrying value, we believe that application of the second step of the impairment test would result in a substantial impairment charge to goodwill and the amount of such impairment charge would likely be materially adverse to our consolidated operating results and financial position for the period in which the charge would be recorded.
Insurance Reserves
We have various self-insured and high deductible insurance programs which require us to make estimates in determining the ultimate liability we may incur for claims arising under these programs. We accrue for insurance reserves on a pro-rata basis throughout the year based on the expected year-end liability. These estimates, judgments and assumptions are made quarterly by our management based on available information and take into consideration annual actuarial evaluations based on historical claims experience, claims processing procedures, medical cost trends and, in certain cases, a discount factor. If our management receives information which causes us to change our estimate of the year end liability, the amount of expense or expense reduction required to be recorded in any particular quarter could be material to our operating results, financial position and cash flows. We estimate the ultimate liability under these programs is between $19.5 million and $21.1 million. At December 31, 2007, we had $21.3 million reserved for such programs. We used a discount rate of 4.0% to calculate the present value of our estimated workers’ compensation claims. A discount rate of 4.0% was used to calculate the present value of our general liability claim reserves. A 100 basis point change in the discount rate or a 5 basis point change in the Selected Loss Cost Estimate would not have a significant impact on the reserve balance.
27
Lease Exit Accruals
The majority of our dealership properties are leased under long-term operating lease arrangements. When leased properties are no longer utilized in operations, we record lease exit accruals. These situations could include the relocation of an existing facility or the sale of a franchise where the buyer will not be subleasing the property for either the remaining term of the lease or for an amount equal to our obligation under the lease. The lease exit accruals represent the present value of the lease payments, net of estimated sublease rentals, for the remaining life of the operating leases and other accruals necessary to satisfy lease commitments to the landlords. At December 31, 2007, we had $8.2 million accrued for lease exit costs.
Legal Proceedings
We are involved, and expect to continue to be involved, in numerous legal proceedings arising out of the conduct of our business, including litigation with customers, employment related lawsuits, contractual disputes and actions brought by governmental authorities. As of December 31, 2007, we had accrued $1.9 million in legal reserves included in other accrued liabilities. Currently, with the exception of the Galura litigation matter discussed in “Item 3: Legal Proceedings” herein, no legal proceedings are pending against or involve us that, in the opinion of management, could reasonably be expected to have a material adverse effect on our business, financial condition or results of operations. However, the results of legal proceedings cannot be predicted with certainty, and an unfavorable resolution of one or more of these proceedings could have a material adverse effect on our business, financial condition, results of operations, cash flows and prospects.
Classification of Franchises in Continuing and Discontinued Operations
We classify the results from operations of our continuing and discontinued operations in our consolidated statements of income based on the provisions of SFAS No. 144. Many of these provisions involve judgment in determining whether a franchise will be reported as continuing or discontinued operations. Such judgments include whether a franchise will be sold or terminated, the period required to complete the disposition and the likelihood of changes to a plan for sale. If in future periods we determine that a franchise should be either reclassified from continuing operations to discontinued operations or from discontinued operations to continuing operations, previously reported consolidated statements of income may be reclassified in order to reflect that classification.
Income Taxes
As a matter of course, we are regularly audited by various taxing authorities and from time to time, these audits result in proposed assessments where the ultimate resolution may result in us owing additional taxes. We believe that our tax positions comply, in all material respects, with applicable tax law and that we have adequately provided for any reasonably foreseeable outcome related to these matters. Included in other accrued liabilities at December 31, 2007 is $24.6 million in reserves that we have provided for these matters (including estimates related to possible interest and penalties) in accordance with Financial Accounting Standards Board Interpretation No. 48 (FIN 48), “Accounting for Uncertainty in Income Taxes.” We evaluate our tax positions using the recognition threshold and measurement attribute in accordance with FIN 48. From time to time, we engage in transactions in which the tax consequences may be subject to uncertainty. Examples of such transactions include business acquisitions and disposals, including consideration paid or received in connection with such transactions. Significant judgment is required in assessing and estimating the tax consequences of these transactions. We determine whether it is more-likely-than-not that a tax position will be sustained upon examination, including resolution of any related appeals or litigation processes, based on the technical merits of the position. In evaluating whether a tax position has met the more-likely-than-not recognition threshold, we presume that the position will be examined by the appropriate taxing authority that has full knowledge of all relevant information. A tax position that meets the more-likely-than-not recognition threshold is measured to determine the amount of benefit to be recognized in the financial statements. The tax position is measured at the largest amount of benefit that is greater than 50% likely of being realized upon ultimate settlement.
28
We adjust our estimates periodically because of ongoing examinations by and settlements with the various taxing authorities, as well as changes in tax laws, regulations and precedent. The effects on our financial statements of income tax uncertainties are discussed in Note 7 to our consolidated financial statements. We believe that adequate accruals have been made for income taxes.
We have $9.8 million in deferred tax assets related to state net operating loss carryforwards that will expire between 2014 and 2027. Management reviews these carryforward positions, the time remaining until expiration and other opportunities to utilize these carryforwards in making an assessment as to whether it is more likely than not that these carryforwards will be utilized. We have recorded a valuation allowance of $1.3 million in 2007 based on our judgment that certain state carryforwards will not be utilized. We have not recorded a valuation allowance related to our remaining carryforwards because we have concluded it is more likely than not that we will realize the benefits of the associated deferred tax assets. However, the results of future operations, regulatory framework of these taxing authorities and other related matters cannot be predicted with certainty. Therefore, actual utilization of the losses which created these deferred tax assets which differs from the assumptions used in the development of our judgment could result in a charge that would be materially adverse to our consolidated operating results, financial position and cash flows.
We accrue for income taxes on a pro-rata basis throughout the year based on the expected year end liability. These estimates, judgments and assumptions are made quarterly by our management based on available information and take into consideration estimated income taxes based on prior year income tax returns, changes in income tax law, our income tax strategies and other factors. If our management receives information which causes us to change our estimate of the year end liability, the amount of expense or expense reduction required to be recorded in any particular quarter could be material to our operating results, financial position and cash flows.
Recent Accounting Pronouncements
In September 2006, the FASB issued SFAS No. 157, “Fair Value Measures” (“SFAS 157”). SFAS 157 defines fair value, establishes a framework for measuring fair value and enhances disclosures about fair value measures required under other accounting pronouncements, but does not change existing guidance as to whether or not an instrument is carried at fair value. SFAS No. 157 is effective for fiscal years beginning after November 15, 2007. We are currently reviewing the provisions of SFAS No. 157 to determine the impact on our consolidated operating results, financial position and cash flows.
In February 2007, the FASB issued Statements of Financial Accounting Standards (“SFAS”) No. 159, “The Fair Value Option for Financial Assets and Financial Liabilities”. SFAS No. 159 permits entities to choose to measure eligible items at fair value at specified election dates and report unrealized gains and losses on items for which the fair value option has been elected in earnings at each subsequent reporting date. SFAS No. 159 is effective for fiscal years beginning after November 15, 2007. We are currently reviewing the provisions of SFAS No. 159 to determine the impact on our consolidated operating results, financial position and cash flows.
In December 2007, the FASB issued SFAS No. 141(R), “Business Combinations” (SFAS 141(R)). SFAS No. 141(R) provides guidance regarding the allocation of purchase price in business combinations, measurement of assets acquired and liabilities assumed as well as other intangible assets acquired. Also in December 2007, the FASB issued SFAS No. 160, “Noncontrolling Interests in Consolidated Financial Statements” (SFAS 160). SFAS 160 provides accounting and reporting standards for noncontrolling interest in a subsidiary and for the deconsolidation of a subsidiary if certain conditions exist. SFAS 141(R) and SFAS 160 are effective for fiscal years beginning on or after December 15, 2008. Early adoption is prohibited. We are currently reviewing the provisions of SFAS 141(R) and SFAS 160 and have not yet determined the impact of these statements on our consolidated financial statements.
29
Results of Operations
On July 19, 2006, we issued a press release describing charges recorded during the second quarter of 2006 in connection with the decision to exit certain facility leases and cancel various facility improvement projects, asset impairments and other asset write-offs, finance chargeback reserves, litigation matters and an adjustment of certain tax strategies. These charges are discussed in more detail in the respective areas under this heading “Results of Operations” when discussing results for the year ended December 31, 2006. The amount and location of the charges in the accompanying consolidated statements of income for the year ended December 31, 2006 are presented in the following table:
| Continuing Operations | Loss from operations and sale of discontinued franchises |
Total | |||||||||||||||||||
| Finance, insurance and other revenue |
Cost of sales |
Selling, general and administrative expenses |
Depreciation and amortization |
Provision for income taxes |
|||||||||||||||||
| Real estate and other asset impairments/write-offs and lease exit costs |
$ | 0.4 | $ | 0.3 | $ | 10.1 | $ | 2.1 | $ | — | $ | 5.8 | $ | 18.7 | |||||||
| Finance chargeback reserves |
6.2 | — | — | — | — | — | 6.2 | ||||||||||||||
| Legal accruals |
— | — | 1.2 | — | — | 0.5 | 1.7 | ||||||||||||||
| Effective income tax rate adjustment |
— | — | — | — | 1.0 | — | 1.0 | ||||||||||||||
| $ | 6.6 | $ | 0.3 | $ | 11.3 | $ | 2.1 | $ | 1.0 | $ | 6.3 | $ | 27.6 | ||||||||
The following table summarizes the percentages of total revenues represented by certain items reflected in our Consolidated Statements of Income.
| Percentage of Total Revenue (1) for the Year Ended December 31, |
|||||||||
| 2005 | 2006 | 2007 | |||||||
| Revenues: |
|||||||||
| New vehicles |
61.4 | % | 61.3 | % | 60.7 | % | |||
| Used vehicles. |
15.5 | % | 16.1 | % | 17.4 | % | |||
| Wholesale vehicles |
6.9 | % | 6.2 | % | 5.1 | % | |||
| Parts, service and collision repair |
13.8 | % | 14.0 | % | 14.3 | % | |||
| Finance, insurance and other. |
2.4 | % | 2.4 | % | 2.5 | % | |||
| Total revenue |
100.0 | % | 100.0 | % | 100.0 | % | |||
| Cost of sales (2) |
84.7 | % | 84.6 | % | 84.5 | % | |||
| Gross profit |
15.3 | % | 15.4 | % | 15.5 | % | |||
| Selling, general and administrative expenses |
11.7 | % | 11.8 | % | 11.5 | % | |||
| Depreciation and amortization |
0.3 | % | 0.3 | % | 0.3 | % | |||
| Operating income |
3.3 | % | 3.3 | % | 3.7 | % | |||
| Interest expense, floor plan |
0.4 | % | 0.8 | % | 0.8 | % | |||
| Interest expense, other, net |
0.6 | % | 0.5 | % | 0.5 | % | |||
| Other expense, net |
0.0 | % | 0.0 | % | 0.0 | % | |||
| Income from continuing operations before income taxes |
2.3 | % | 2.0 | % | 2.3 | % | |||
| Income tax expense |
0.9 | % | 0.8 | % | 1.0 | % | |||
| Income from continuing operations |
1.4 | % | 1.2 | % | 1.4 | % | |||
| (1) | In accordance with the provisions of SFAS No. 144, prior years' income statement data reflects reclassifications to exclude additional franchises sold, identified for sale or terminated subsequent to |
30
| December 31, 2006 which had not been previously included in discontinued operations. See Note 2 to our accompanying Consolidated Financial Statements, Business Acquisitions and Dispositions, which discusses these and other factors that affect the comparability of the information for the periods presented. |
| (2) | The cost of sales line item includes the cost of new and used vehicles, vehicle parts and all costs directly linked to servicing customer vehicles. |
During the year ended December 31, 2007, we disposed of 12 franchises, and had approved, but not completed, the disposition of 20 additional franchises. The results of operations of these dealerships, including gains or losses on disposition, have been included in discontinued operations on the accompanying Consolidated Statements of Income for all periods presented. In addition to these dispositions, during the years ended December 31, 2005 and 2006, we disposed of 22 and 12 franchises, respectively.
Annual “same store” results of operations represent the aggregate of the same store results for each of the four quarters in that year. Same store results for each quarter include dealerships that were owned and operated for the entire quarter in both periods and were classified as continuing operations under SFAS No. 144 at December 31, 2007. Unless otherwise noted, our discussion of the Results of Operations from “New Vehicles” to “Gross Profit and Gross Margins” is on a same store basis.
New Vehicles
New vehicle revenues include the sale and lease of new vehicles, as well as the sale of fleet vehicles. New vehicle revenues are highly dependent on manufacturer incentives, which vary from cash-back incentives to low interest rate financing. New vehicle revenues are also dependent on manufacturers to provide adequate vehicle allocations to meet customer demands.
The automobile manufacturing industry is cyclical and historically has experienced periodic downturns characterized by oversupply and weak demand. As an automotive retailer, we seek to mitigate the effects of this cyclicality by maintaining a diverse mix of branded dealerships. Our brand diversity allows us to offer a broad range of products at a wide range of prices from lower priced, or economy vehicles, to luxury vehicles. We believe that this diversity reduces the risk of changes in customer preferences, product supply shortages and aging products. For the year ended December 31, 2007, 84.1% of our total new vehicle revenue was generated by import and luxury dealerships compared to 83.4% for 2006. We expect this trend toward more import and domestic luxury dealerships to continue. We believe demographic and other trends favor import and luxury brands and expect our acquisition activity in the future to concentrate primarily, but not completely, on these brands.
| For the Year Ended | Units or $ Change |
% Change |
For the Year Ended | Units or $ Change |
% Change |
||||||||||||||||||||
| 12/31/2006 | 12/31/2007 | 12/31/2005 | 12/31/2006 | ||||||||||||||||||||||
| Total New Vehicle Units |
|||||||||||||||||||||||||
| Same Store |
154,750 | 149,929 | (4,821 | ) | (3.1 | %) | 146,113 | 149,070 | 2,957 | 2.0 | % | ||||||||||||||
| Acquisitions and Other |
805 | 4,675 | 3,870 | 480.7 | % | 486 | 6,485 | 5,999 | 1234.4 | % | |||||||||||||||
| Total as Reported |
155,555 | 154,604 | (951 | ) | (0.6 | %) | 146,599 | 155,555 | 8,956 | 6.1 | % | ||||||||||||||
| Total New Vehicle Revenues (in thousands) |
|||||||||||||||||||||||||
| Same Store |
$ | 4,874,962 | $ | 4,842,793 | $ | (32,169 | ) | (0.7 | %) | $ | 4,466,497 | $ | 4,637,598 | $ | 171,101 | 3.8 | % | ||||||||
| Acquisitions and Other |
23,545 | 213,687 | 190,142 | 807.6 | % | 24,340 | 260,909 | 236,569 | 971.9 | % | |||||||||||||||
| Total as Reported |
$ | 4,898,507 | $ | 5,056,480 | $ | 157,973 | 3.2 | % | $ | 4,490,837 | $ | 4,898,507 | $ | 407,670 | 9.1 | % | |||||||||
| Total New Vehicle Unit Price |
|||||||||||||||||||||||||
| Same Store |
$ | 31,502 | $ | 32,301 | $ | 799 | 2.5 | % | $ | 30,569 | $ | 31,110 | $ | 541 | 1.8 | % | |||||||||
| Total Dealerships as Reported |
$ | 31,491 | $ | 32,706 | $ | 1,215 | 3.9 | % | $ | 30,633 | $ | 31,491 | $ | 858 | 2.8 | % | |||||||||
Same store new vehicle revenue and unit sales were negatively impacted by economic softness in our California and Florida markets, where we have a significant number of luxury and import dealerships. These
31
conditions directly affected the performance of our import stores which underperformed the industry unit volume increase of 3.0%, while our domestic stores outperformed the industry decrease of 7.1%. Our import dealerships experienced a decrease of 2,216 units, or 2.0%, while our domestic dealerships experienced a decrease of 2,605 units, or 5.8%. These overall import and domestic same store new vehicle unit decreases can also be attributed to a decline in new truck and SUV units from 2006 to 2007 of 2,815 units, or 4.2%. Declining truck and SUV sales resulted from increasing gasoline prices, a downturn in the housing market and other economic uncertainties. Our BMW stores realized an increase in unit volume for 2007 of 891 units, or 5.6%. Additionally, our BMW dealerships posted the largest increase in new SUV unit sales when compared to 2006. Our Mercedes dealerships experienced the most significant decline in sales volume among our import stores, decreasing by 360 units, or 4.4%, as compared to 2006. Our GM (excluding Cadillac) dealerships experienced a decline in new retail unit volume, but strong fleet sales led to an overall improvement in total new unit sales volume. Both our Cadillac and Ford stores posted decreases in same store new vehicle unit sales decreasing by 1,115 units, or 11.1% and 1,500 units, or 8.8%, respectively.
The increase in our average price per unit in 2007 can be attributed mainly to a larger percentage of our sales being generated by higher priced luxury vehicles. Many of our import dealerships experienced average price per unit increases, most notably, Toyota and BMW (up 3.6% and 3.2%, respectively). All of our domestic dealerships experienced average price per unit increases. Our Ford dealerships experienced the most significant improvement in sales price per unit of our domestic stores, increasing by $723, or 2.9%, during 2007.
During 2006, our increase in same store new vehicle unit sales was driven entirely by our import dealerships, which experienced an increase of 2,989 units, or 2.9%, while our domestic dealerships experienced a decrease of 32 units, or 0.1%, as compared to 2005. This is compared to an industry increase in unit sales at import dealerships of 4.8%, and a decrease in the industry domestic unit sales of 8.1%. Our top performing import brands for 2006 were Toyota and Mercedes, which posted increases of 3,654 units, or 16.7%, and 435 units, or 8.8%, respectively. These increases can be attributed to the introduction of new models, in addition to new body styling and design on existing models. Additionally, our BMW stores posted a 2.3% revenue increase despite a slight decline in unit volume. Our Honda dealerships experienced the most significant decline in sales volume among our import stores, decreasing by 648 units, or 2.1%, as compared to 2005. Our top performing domestic brand was Ford, which posted an increase of 325 units, or 1.9%. Our GM (excluding Cadillac) dealerships experienced a decline in new retail unit volume of 960 units, or 7.2%, but strong fleet sales with an increase of 709 units, or 15.8%, helped to offset that decline. Additionally, our Cadillac stores posted an improvement in fleet sales of 108 units, or 27.2%, which offset the domestic decline in new unit volume. Many of our import dealerships experienced average price per unit increases, most notably being Mercedes, BMW and Honda (up 5.5%, 3.1% and 2.5%, respectively). On the domestic side, our Ford and Cadillac dealerships experienced the most significant increases in average sales price per unit (up 3.5% and 2.9%, respectively). The increases at these dealerships can be attributed to both the various pricing strategies put in place by Ford and GM during 2005, which lowered 2005 pricing, and a shift from car sales to truck and SUV sales during 2006.
Used Vehicles
Used vehicle revenues are directly affected by the level of manufacturer incentives on new vehicles, the number and quality of trade-ins and lease turn-ins and the availability of consumer credit. In addition, various manufacturers provide franchised dealers the opportunity to “certify” pre-owned vehicles based on criteria established by the manufacturer. This certification process extends the standard manufacturer warranty. On a continuing operations basis, our sales of CPO vehicles increased slightly in 2007 to 34.7% of total used vehicle units from 34.6% in 2006. Our sales of non-CPO used vehicles experienced an increase of 3,454 units or 7.9% during 2007. These increases were partially due to an increased focus on used cars, the continued implementation of a standardized merchandising process that includes the retailing of “value” used vehicles, along with an improved inventory management system at a number of our stores. Additionally, industry pricing improvements
32
affected the value of used vehicles, as the Manheim Used Vehicle Value Index increased 0.4% from December 2006 to December 2007.
| For the Year Ended | Units or $ Change |
% Change |
For the Year Ended | Units or $ Change |
% Change |
|||||||||||||||||||
| 12/31/2006 | 12/31/2007 | 12/31/2005 | 12/31/2006 | |||||||||||||||||||||
| Total Used Vehicle Units |
||||||||||||||||||||||||
| Same Store |
66,438 | 70,363 | 3,925 | 5.9 | % | 61,233 | 64,271 | 3,038 | 5.0 | % | ||||||||||||||
| Acquisitions and Other |
289 | 1,780 | 1,491 | 515.9 | % | 120 | 2,456 | 2,336 | 1946.7 | % | ||||||||||||||
| Total as Reported |
66,727 | 72,143 | 5,416 | 8.1 | % | 61,353 | 66,727 | 5,374 | 8.8 | % | ||||||||||||||
| Total Used Vehicle Revenues |
||||||||||||||||||||||||
| Same Store |
$ | 1,276,531 | $ | 1,401,589 | $ | 125,058 | 9.8 | % | $ | 1,131,805 | $ | 1,221,411 | $ | 89,606 | 7.9 | % | ||||||||
| Acquisitions and Other |
5,356 | 47,948 | 42,592 | 795.2 | % | 4,068 | 60,476 | 56,408 | 1386.6 | % | ||||||||||||||
| Total as Reported |
$ | 1,281,887 | $ | 1,449,537 | $ | 167,650 | 13.1 | % | $ | 1,135,873 | $ | 1,281,887 | $ | 146,014 | 12.9 | % | ||||||||
| Total Used Vehicle Unit Price |
||||||||||||||||||||||||
| Same Store |
$ | 19,214 | $ | 19,919 | $ | 705 | 3.7 | % | $ | 18,484 | $ | 19,004 | $ | 520 | 2.8 | % | ||||||||
| Total Dealerships as Reported |
$ | 19,211 | $ | 20,093 | $ | 882 | 4.6 | % | $ | 18,514 | $ | 19,211 | $ | 697 | 3.8 | % | ||||||||
In 2007, the overall increase in average used price per unit of 3.7% when compared to 2006 can be mainly attributed to a continuing shift in our dealership mix towards more import and luxury dealerships (which tend to retail higher priced used vehicles). Our import dealerships posted an increase in used unit volume of 4,100, or 9.3%. Our BMW and Mercedes stores posted the most significant increases in used unit volume, 24.1% and 14.2%, respectively. Our Cadillac stores posted the only increase in used unit volume among our domestic brands. Our Ford and GM (excluding Cadillac) stores posted small declines in used unit volume of 1.9% and 1.8%, respectively.
During 2006, our import dealerships contributed to the overall improvement in used unit volume by posting an increase of 2,601 units, or 6.6%, when compared to 2005. Of our import stores, BMW, Mercedes and Toyota posted the most significant increases in used unit volume. Our domestic dealerships also posted an improvement in used unit sales volume, increasing by 437 units, or 2.0%. Cadillac was the largest contributor to the domestic increase in unit volume.
Wholesale Vehicles
Wholesale vehicle revenues are highly correlated with new and used vehicle retail sales and the associated trade-in volume. Wholesale revenues are also significantly affected by our corporate inventory management policies, which are designed to optimize our total used vehicle inventory.
| For the Year Ended | Units or $ Change |
% Change |
For the Year Ended | Units or $ Change |
% Change |
|||||||||||||||||||||
| 12/31/2006 | 12/31/2007 | 12/31/2005 | 12/31/2006 | |||||||||||||||||||||||
| Total Wholesale Vehicle Units |
||||||||||||||||||||||||||
| Same Store |
51,114 | 44,731 | (6,383 | ) | (12.5 | %) | 53,139 | 49,546 | (3,593 | ) | (6.8 | %) | ||||||||||||||
| Acquisitions and Other |
2,644 | 2,814 | 170 | 6.4 | % | 2,969 | 4,212 | 1,243 | 41.9 | % | ||||||||||||||||
| Total as Reported |
53,758 | 47,545 | (6,213 | ) | (11.6 | %) | 56,108 | 53,758 | (2,350 | ) | (4.2 | %) | ||||||||||||||
| Total Wholesale Vehicle Revenues (in thousands) |
||||||||||||||||||||||||||
| Same Store |
$ | 460,583 | $ | 391,876 | $ | (68,707 | ) | (14.9 | %) | $ | 469,574 | $ | 441,119 | $ | (28,455 | ) | (6.1 | %) | ||||||||
| Acquisitions and Other |
35,948 | 36,253 | 305 | 0.8 | % | 33,947 | 55,412 | 21,465 | 63.2 | % | ||||||||||||||||
| Total as Reported |
$ | 496,531 | $ | 428,129 | $ | (68,402 | ) | (13.8 | %) | $ | 503,521 | $ | 496,531 | $ | (6,990 | ) | (1.4 | %) | ||||||||
| Total Wholesale Unit Price |
||||||||||||||||||||||||||
| Same Store |
$ | 9,011 | $ | 8,761 | $ | (250 | ) | (2.8 | %) | $ | 8,837 | $ | 8,903 | $ | 66 | 0.7 | % | |||||||||
| Total Dealerships as Reported |
$ | 9,236 | $ | 9,005 | $ | (231 | ) | (2.5 | %) | $ | 8,974 | $ | 9,236 | $ | 262 | 2.9 | % | |||||||||
33
Lower wholesale vehicle revenues realized during 2007 were driven by a decline in wholesale unit sales coupled with a decrease in average wholesale price per unit. The decrease in unit volume can be primarily attributed to our increased focus on retail used vehicles (see “Used Vehicles” above). The wholesale price per unit decrease can also be attributed to the merchandising process. This process allowed us to retail vehicles that historically would have had a positive effect on our wholesale per unit price.
During 2006, the decline in wholesale unit volume can be mainly attributed to the beginning of the implementation of our merchandising and inventory management process related to used vehicles. We believe this improved process allowed us to retail used vehicles we historically would have disposed of through the wholesale market.
Parts, Service and Collision Repair (“Fixed Operations”)
Same store revenue from these items was as follows (amounts in thousands):
| For the Year Ended | $ Change |
% Change |
For the Year Ended | $ Change |
% Change |
|||||||||||||||||||
| 12/31/2006 | 12/31/2007 | 12/31/2005 | 12/31/2006 | |||||||||||||||||||||
| Parts |
$ | 594,892 | $ | 606,968 | $ | 12,076 | 2.0 | % | $ | 546,359 | $ | 557,099 | $ | 10,740 | 2.0 | % | ||||||||
| Service |
454,134 | 472,851 | 18,717 | 4.1 | % | $ | 397,928 | $ | 423,500 | 25,572 | 6.4 | % | ||||||||||||
| Collision repair |
60,482 | 63,202 | 2,720 | 4.5 | % | $ | 57,518 | $ | 57,651 | 133 | 0.2 | % | ||||||||||||
| Same Store |
$ | 1,109,508 | $ | 1,143,021 | $ | 33,513 | 3.0 | % | $ | 1,001,805 | $ | 1,038,250 | $ | 36,445 | 3.6 | % | ||||||||
Parts and service revenue consists of customer requested repairs (“customer pay”), warranty repairs, retail parts, wholesale parts and collision repairs. Parts and service revenue is driven by the mix of warranty repairs versus customer pay repairs, available service capacity, vehicle quality, customer loyalty and manufacturer warranty programs. During 2007, 18.1% of our service and parts revenue was generated by warranty repairs and 46.0% by customer pay repairs compared to 19.4% by warranty repairs and 44.6% by customer pay repairs in 2006.
We believe that over time, vehicle quality will improve, but vehicle complexity will offset any revenue lost from improvement in vehicle quality. We also believe that we have the ability, through our access to capital, to continue to add service capacity and increase revenues. During 2007, we added 46 service stalls, or 1.3%, to our overall stall capacity. In addition, manufacturers continue to extend new vehicle warranty periods and have also begun to include regular maintenance items in the warranty coverage. These factors, combined with the extended manufacturer warranties on CPO vehicles (see the discussion in “Business—Business Strategy—Certified Pre-Owned Vehicles” above), should facilitate continued growth in our service and parts business.
Parts revenue is driven by the mix of warranty repairs versus customer pay repairs as prices for warranty parts are established by the manufacturer. We believe that long-term trends in retail parts sales will be affected by the same trends as discussed above for service (additional capacity, customer satisfaction, etc.).
As of December 31, 2007, we operated 34 collision repair centers. Collision revenues are heavily impacted by trends in the automotive insurance industry. The 4.5% increase in collision repair revenues during 2007 versus 2006 was driven by an increase in repair order volume. Collision repair revenues remained flat during 2006, as compared to 2005.
| For the Year Ended | $ Change |
% Change |
For the Year Ended | $ Change |
% Change |
|||||||||||||||||||
| 12/31/2006 | 12/31/2007 | 12/31/2005 | 12/31/2006 | |||||||||||||||||||||
| Total Parts, Service and Collision |
|
|||||||||||||||||||||||
| Same Store |
$ | 1,109,508 | $ | 1,143,021 | $ | 33,513 | 3.0 | % | $ | 1,001,805 | $ | 1,038,250 | $ | 36,445 | 3.6 | % | ||||||||
| Acquisitions and Other |
8,858 | 48,326 | 39,468 | 445.6 | % | 6,701 | 80,116 | 73,415 | 1095.6 | % | ||||||||||||||
| Total as Reported |
$ | 1,118,366 | $ | 1,191,347 | $ | 72,981 | 6.5 | % | $ | 1,008,506 | $ | 1,118,366 | $ | 109,860 | 10.9 | % | ||||||||
34
Same store fixed operations revenues increased during 2007 compared to 2006, primarily due to the performance of our import dealerships (up $34.8 million, or 4.3%) outpacing decreases in our domestic dealerships (down $3.2 million, or 1.1%). Excluding the effect of one additional selling day in 2007 versus 2006, our same store fixed operations revenues increased $29.0 million, or 2.6%. Our BMW dealerships experienced significant increases in fixed operations revenues, increasing by $26.4 million, or 12.9%, compared to 2006 as a result of BMW’s vehicle maintenance programs and strong same store new vehicle sales. Customer pay sales at our import dealerships increased $30.1 million, or 8.7%. The customer pay import increases were partially offset by decreases in warranty sales of $7.9 million, or 4.6%. Our Mercedes dealerships experienced significant decreases in warranty sales, $9.0, or 23.3%, related to a change in their warranty program and a large number of recalls in the prior year. Our Cadillac dealerships experienced significant decreases in fixed operations revenues, decreasing by $3.8 million, or 3.0%, compared to 2006. Customer pay sales at our domestic dealerships decreased $1.1 million, or 0.8%, driven by a decrease in our Cadillac stores of $2.0 million, or 3.0%, as compared to 2006.
Same store fixed operations revenues increased during 2006 compared to 2005, primarily due to the performance of our import dealerships (up $55.7 million, or 8.2%) outpacing decreases in our domestic dealerships (down $20.3 million, or 6.5%). Customer pay sales at our import dealerships increased $42.1 million, or 13.8%. Our BMW dealerships experienced significant increases in fixed operations revenues, increasing by $22.3 million, or 12.3%, compared to 2005 as a result of BMW’s vehicle maintenance programs and strong same store new vehicle sales. These import increases were partially offset by decreases of $20.3 million, or 6.5%, at our domestic dealerships. Warranty sales declines of $7.0 million, or 14.0%, were offset by an increase in customer pay of $0.9 million, or 0.6%, at our domestic stores. Our GM and Cadillac dealerships, which decreased $16.9 million, or 13.6%, and $4.9 million, or 3.9%, respectively, as compared to 2005 contributed to lower domestic sales. The declines in our GM dealerships were primarily caused by a decrease in warranty repair services and wholesale parts sales of $23.7 million, or 27.7%. Warranty sales at our Cadillac stores experienced declines of $3.6 million, or 14.2%, as compared to 2005.
Finance, Insurance and Other
Finance, insurance and other revenues include commissions for arranging vehicle financing and insurance, sales of third-party extended service contracts for vehicles and other aftermarket products. In connection with vehicle financing, service contracts, other aftermarket products and insurance contracts, we receive commissions from the providers for originating contracts.
Rate spread is another term for the commission earned by our dealerships for arranging vehicle financing for consumers. The amount of the commission could be zero, a flat fee or an actual spread between the interest rate charged to the consumer and the interest rate provided by the direct financing source (bank, credit union or manufacturers’ captive finance company). We have established caps on the potential rate spread our dealerships can earn with all finance sources. We believe the rate spread we earn for arranging financing represents value to the consumer in numerous ways, including the following:
| • | Lower cost, below-market financing is often available only from the manufacturers’ captives and franchised dealers; |
| • | Lease-financing alternatives are largely available only from manufacturers’ captives or other indirect lenders; |
| • | Customers with substandard credit frequently do not have direct access to potential sources of sub-prime financing; and |
| • | Customers with significant “negative equity” in their current vehicle (i.e., the customer’s current vehicle is worth less than the balance of their vehicle loan or lease obligation) frequently are unable to pay off the loan on their current vehicle and finance the purchase or lease of a replacement new or used vehicle without the assistance of a franchised dealer. |
35
Finance, insurance and other revenues are driven by the level of new and used vehicle unit sales, manufacturer financing or leasing incentives and our F&I penetration rate. The F&I penetration rate represents the percentage of vehicle sales on which we are able to originate financing or sell extended service contracts, other aftermarket products or insurance contracts. Our finance penetration rate remained relatively flat at 67.4% in 2007. Our extended service contract penetration rate decreased to 33.0% in 2007 from 34.0% in 2006. We expect our F&I penetration rate to increase over time as we continue to emphasize the use of menu selling techniques.
| For the Year Ended | $ Change |
% Change |
For the Year Ended | $ Change |
% Change |
||||||||||||||||||||
| 12/31/2006 | 12/31/2007 | 12/31/2005 | 12/31/2006 | ||||||||||||||||||||||
| Total Finance, Insurance and Other Revenue (in thousands) |
|||||||||||||||||||||||||
| Same Store |
$ | 186,411 | $ | 203,327 | $ | 16,916 | 9.1 | % | $ | 175,175 | $ | 179,807 | $ | 4,632 | 2.6 | % | |||||||||
| Acquisitions and Other |
3,377 | 8,113 | 4,736 | 140.2 | % | 4,888 | 9,981 | 5,093 | 104.2 | % | |||||||||||||||
| Total as Reported |
$ | 189,788 | $ | 211,440 | $ | 21,652 | 11.4 | % | $ | 180,063 | $ | 189,788 | $ | 9,725 | 5.4 | % | |||||||||
| Total F&I per Unit (excluding fleet) |
|||||||||||||||||||||||||
| Same Store |
$ | 907 | $ | 995 | $ | 88 | 9.7 | % | $ | 907 | $ | 909 | $ | 2 | 0.2 | % | |||||||||
| Total Dealerships as Reported |
$ | 918 | $ | 1,004 | $ | 86 | 9.4 | % | $ | 929 | $ | 918 | $ | (11 | ) | (1.2 | %) | ||||||||
Same store finance, insurance and other revenues increased during 2007 when compared to 2006 despite static retail vehicle unit sales volume. The increase is primarily due to higher F&I penetration rates. Our import dealerships reported an increase of revenues of $14.0 million, or 10.6%, primarily due to revenue increases in our BMW, Toyota, and Mercedes dealerships of $6.2 million, or 28.3%, $2.3 million, or 8.3%, and $1.3 million, or 10.4%, respectively. Our domestic stores also experienced increases in revenues of $2.9 million, or 5.4%. The increase was led by our General Motors stores of $2.0 million, or 7.8%. Included in finance, insurance and other revenue for the year ended December 31, 2006 is a $6.2 million charge related to an increase in our allowance for estimated finance chargebacks. Excluding the effect of this charge, finance, insurance, and other revenue in the year ended December 31, 2007 would have increased 7.9%.
Same store finance, insurance, and other revenues increased slightly in 2006 compared to 2005 due to a 2.4% increase retail unit sales volume. The increase in revenues was primarily attributed to our import stores with an increase of $4.1 million, or 3.4% over 2005. Our Toyota and Mercedes dealerships led the improvement in revenues with increases of $3.0 million, or 12.4%, and $1.0 million, or 14.6%, respectively. Our domestic stores also experienced a slight increase in revenues of $0.5 million, or 0.9%. The increase was led by our General Motors stores of $0.3 million, or 1.3%. The domestic increase was partially offset by our Ford stores, which experienced decreases of $0.1 million, or 0.4%. Excluding the effect of the $6.2 million charge related to an increase in our allowance for estimated finance chargebacks charge for the year ended December 31, 2006, finance, insurance, and other revenue in the year ended December 31, 2006 would have increased 8.8%.
Gross Profit and Gross Margins
Our overall gross profit and gross margin (gross profit as a percentage of revenues) generally vary depending on changes in our revenue mix. Although sales of new vehicles comprise the majority of our total revenues, new vehicles generally carry the lowest margin rate of any product or service we offer. As a result, sales of new vehicles comprise a relatively small portion of total gross profits. Retail sales of used vehicles generally carry a slightly higher gross margin rate than new vehicles. Parts, service and collision repair carry a much higher gross margin rate than vehicle sales. Brand mix also has an impact on the gross margins that we realize. Historically, our import and luxury brands generally provide higher margins than our domestic brands. As we continue to acquire more import and luxury dealerships, we would expect our gross margins to increase. Our same store revenue mix is shown in the following table:
36
| For the Year Ended | Basis Point Change |
For the Year Ended | Basis Point Change |
|||||||||||||||
| 12/31/2006 | 12/31/2007 | 12/31/2005 | 12/31/2006 | |||||||||||||||
| Revenues as a Percentage of Total Revenues |
||||||||||||||||||
| New Vehicles |
61.6 | % | 60.7 | % | (90 | ) | 61.7 | % | 61.7 | % | 0 | |||||||
| Used Vehicles |
16.1 | % | 17.6 | % | 150 | 15.6 | % | 16.2 | % | 60 | ||||||||
| Wholesale Vehicles |
5.8 | % | 4.9 | % | (90 | ) | 6.5 | % | 5.9 | % | (60 | ) | ||||||
| Fixed Operations |
14.1 | % | 14.3 | % | 20 | 13.8 | % | 13.8 | % | 0 | ||||||||
| Finance, Insurance and Other |
2.4 | % | 2.5 | % | 10 | 2.4 | % | 2.4 | % | 0 | ||||||||
| Same Store |
100.0 | % | 100.0 | % | 100.0 | % | 100.0 | % | ||||||||||
| For the Year Ended | $ Change |
% Change |
For the Year Ended | $ Change |
% Change |
|||||||||||||||||||
| 12/31/2006 | 12/31/2007 | 12/31/2005 | 12/31/2006 | |||||||||||||||||||||
| Total Gross Profit (in thousands) |
||||||||||||||||||||||||
| Same Store |
$ | 1,217,803 | $ | 1,238,811 | $ | 21,008 | 1.7 | % | $ | 1,106,906 | $ | 1,154,886 | $ | 47,980 | 4.3 | % | ||||||||
| Acquisitions and Other |
10,488 | 52,774 | 42,286 | 403.2 | % | 10,265 | 73,405 | 63,140 | 615.1 | % | ||||||||||||||
| Total as Reported |
$ | 1,228,291 | $ | 1,291,585 | $ | 63,294 | 5.2 | % | $ | 1,117,171 | $ | 1,228,291 | $ | 111,120 | 9.9 | % | ||||||||
The overall gross margin rates on our various revenue lines on a same store basis were as follows:
| For the Year Ended | Basis Point Change |
For the Year Ended | Basis Point Change |
|||||||||||||||
| 12/31/2006 | 12/31/2007 | 12/31/2005 | 12/31/2006 | |||||||||||||||
| New vehicles |
7.3 | % | 6.9 | % | (40 | ) | 7.4 | % | 7.4 | % | 0 | |||||||
| Used vehicles |
9.7 | % | 9.1 | % | (60 | ) | 10.1 | % | 9.8 | % | (30 | ) | ||||||
| Wholesale vehicles |
(1.1 | %) | (1.2 | %) | (10 | ) | (0.5 | %) | (1.1 | %) | (60 | ) | ||||||
| Parts, service and collision repair |
50.1 | % | 50.5 | % | 40 | 49.0 | % | 50.0 | % | 100 | ||||||||
| Finance and insurance |
100.0 | % | 100.0 | % | 0 | 100.0 | % | 100.0 | % | 0 | ||||||||
| Overall gross margin |
15.4 | % | 15.5 | % | 10 | 15.3 | % | 15.4 | % | 10 | ||||||||
The 40 basis point decrease in the new vehicle gross margin can be attributed to weakening economic and market conditions. The 60 basis points decrease in used vehicle gross margin in 2007 is also the result of soft market conditions and the result of the continuing shift in our dealership mix towards more luxury and import dealerships (which tend to have lower gross margin rates for used vehicles than domestic brands). Our luxury dealerships posted the largest increase in fixed operations gross margin percentages, increasing by 50 basis points in 2007. This increase is primarily the result of a shift toward a higher proportion of sales resulting from customer pay transactions and away from warranty transactions.
Our same store gross margin percentage was relatively flat in 2006, when compared to 2005. Gross margin improvements experienced in fixed operations were offset by declines in both the used and wholesale vehicle gross margin percentages. Our Toyota dealerships posted the most significant increase in fixed operations gross margin percentage among our import dealerships, improving by 130 basis points. In addition, the majority of our domestic dealerships contributed to the fixed operations increase. Specifically, our GM (excluding Cadillac), Ford and Cadillac dealerships experienced fixed operations margin increases of 460 basis points, 40 basis points and 40 basis points, respectively, when compared to 2005.
Selling, General and Administrative Expenses
Selling, general and administrative (“SG&A”) expenses are comprised of four major groups: compensation expense, advertising expense, rent and rent related expense, and other expense. Compensation expense primarily relates to dealership personnel who are paid a commission or a modest salary plus commission (which typically vary depending on gross profits realized) and support personnel who are paid a fixed salary. Due to the salary component for certain dealership and corporate personnel, gross profits and compensation expense are not 100% correlated. Advertising expense and other expenses vary based on the level of actual or anticipated business
37
activity and number of dealerships owned. Rent and rent related expense typically varies with the number of dealerships owned, investments made for facility improvements and interest rates. Although not completely correlated, we believe the best way to measure SG&A expenses is as a percentage of gross profit.
2007 Compared to 2006
Total SG&A expenses increased $24.8 million, or 2.6%, in 2007 compared to 2006. As a percentage of gross profit, reported SG&A expenses decreased by 190 basis points, from 76.8% in 2006 to 74.9% in 2007. Total SG&A expenses in 2006 include charges totaling $11.4 million and primarily relate to asset impairments, lease exit charges and legal charges. Absent these charges, and others that affected 2006 gross profit in the amount of $6.9 million, SG&A expenses as a percentage of gross profit in 2006 would have been 75.4% for the year ended December 31, 2006. The 50 basis point decrease in the 2007 ratio compared to the adjusted 2006 ratio is primarily attributed to higher gross profit dollars in 2007 and reductions in employee compensation costs slightly offset by higher rent expenses.
In 2007, total reported compensation expense increased by $5.4 million, or 1.0%, when compared to 2006. As a percentage of gross profit, total compensation expense improved by 180 basis points to 42.2% in 2007 from 44.0% in 2006. The favorable decrease as a percentage of gross profit was partially the result of revenue and gross profit mix shifting more toward fixed operations where the percentage of compensation related to gross profit is typically lower than other revenue categories. Absent the 2006 charges discussed above, compensation expense as a percentage of gross profit would have been 43.7% in 2006.
Advertising expense increased $4.4 million, or 6.9%, in 2007, as compared to 2006. As a percentage of gross profit, advertising expense increased by 10 basis points to 5.3% in 2007 from 5.2% in 2006. Advertising costs are unfavorable versus prior year due to lower rebates and credits received and higher internet advertising expenses. Absent the 2006 charges discussed above, advertising expense as a percentage of gross profit would have been 5.1% in 2006.
Rent and rent related expenses increased $8.8 million, or 6.2%, in 2007, compared to 2006. Acquisitions contributed $4.4 million of the overall increase. As a percentage of gross profit, rent and rent related expenses increased by 20 basis points to 11.8% in 2007 from 11.6% in 2006. In 2006, we recorded a charge of $2.0 million related to lease exit expenses. Absent this charge, and others that affected gross profit in the second quarter of 2006 in the amount of $6.9 million, rent and rent related expenses as a percentage of gross profit would have been 11.4% in 2006. Overall 2007 rent and rent related expense increased 40 basis points compared to the adjusted 2006 ratio due to rent increases, acquisitions, facilities improvements and higher maintenance costs.
Other SG&A expenses increased $6.2 million, or 3.1%, in 2007, as compared to 2006, due to increases in service loaner, credit card fees, delivery costs and bad debt expense. Absent the 2006 charges described above, other SG&A expenses as a percentage of gross profit in 2006 would have increased 60 basis points in 2007, from 15.1% in 2006 to 15.7% in 2007.
2006 Compared to 2005
In 2006, total SG&A expenses increased $90.2 million, or 10.6%, compared to 2005. As a percentage of gross profit, reported 2006 SG&A expense increased by 50 basis points, from 76.3% in 2005 to 76.8% in 2006. These increases, both the dollar increase and the increase as a percentage of gross profits, can be attributed to current year acquisitions, charges recorded during 2006 discussed above, and the effect of a $3.0 million favorable legal settlement in 2005. Acquisitions in 2006 contributed $39.0 million to the year over year dollar increase. Absent the 2006 charges discussed above, SG&A expenses as a percentage of gross profit in 2006 would have decreased by 90 basis points from 76.3% in 2005 to 75.4% in 2006.
Total reported compensation expense increased $40.7 million, or 8.1%, in 2006, as compared to 2005 due to acquisitions and higher gross profit levels. However, as a percentage of gross profit, total compensation expense
38
improved by 70 basis points to 44.0% in 2006 from 44.7% in 2005. Absent the 2006 charges discussed above, compensation expense as a percentage of gross profit would have improved 100 basis points to 43.7% in 2006 compared to 44.7% in 2005.
In 2006, advertising expense increased $4.8 million, or 8.1%, improving by 10 basis points as a percentage of gross profit when compared to 2005. Approximately $3.3 million of the increase in 2006 was related to acquisitions and the remaining increase is attributed to our targeted approach to allocate advertising dollars to certain brands in key markets. Absent the 2006 charges discussed above, 2006 advertising expense as a percentage of gross profit would have improved by 20 basis points to 5.1% compared to 5.3% in 2005.
In 2006, rent and rent related expenses increased $22.3 million, or 18.4%, as compared to 2005. As a percentage of gross profit, rent and rent related expenses increased by 80 basis points to 11.6% in 2006 from 10.8% in 2005. Acquisitions contributed $5.9 million to the increase in 2006 compared to 2005. We also experienced rent increases as a result of the completion of facility improvement projects and the resulting sale-leaseback of these facilities, the effect of rising interest rates on our variable rate leases and the establishment of lease exit accruals. Absent the 2006 charges discussed above, rent and rent related expenses as a percentage of gross profit would have increased 60 basis points to 11.4% in 2006 compared to 10.8% in 2005
Other SG&A expenses increased $22.4 million, or 12.9%, in 2006, as compared to 2005. Acquisitions accounted for approximately $9.3 million of the increase. The remaining increase is primarily attributed to higher service loaner expense, data processing, legal expenses and impairment charges.
Depreciation and Amortization
Depreciation expense increased $4.1 million, or 17.5%, in 2007 compared to 2006. This increase was due primarily to an $69.7 million increase in gross property and equipment related to continuing operations, excluding land and construction in progress. The increase in depreciable property was due to dealership acquisitions, facility projects on existing dealerships and the result of our strategy to own more of our dealership properties.
Depreciation expense increased $4.5 million, or 24.0%, in 2006 compared to 2005. This increase was due primarily to a $72.1 million increase in gross property and equipment related to continuing operations, excluding land and construction in progress, as well as an adjustment to depreciation expense of $2.1 million which was recorded in the second quarter of 2006. This adjustment was related to the reclassification of certain assets from other current assets—construction in progress to depreciable property and equipment based on strategic capital decisions which resulted in decisions not to sell these assets.
Interest Expense, Floor Plan
Interest expense, floor plan for new vehicles increased $6.7 million, or 12.3%, in 2007 compared to 2006. The average new vehicle floor plan interest rate related to new vehicles incurred by continuing dealerships was 6.3% for the year ended December 31, 2007, compared to 5.9% for the year ended December 31, 2006, which increased interest expense by approximately $3.8 million. In addition, during 2007 the average floor plan balance for new vehicles increased by $46.2 million, resulting in an increase in expense of approximately $2.9 million. Approximately $29.1 million of the increase in the average floor plan balance for new vehicles was due to additional dealerships we acquired in 2007. The average floor plan balance for new vehicles also increased due to an increase in the average price of vehicles due to general trends in the industry and our continued focus on luxury vehicles.
Interest expense, floor plan for used vehicles increased $1.3 million, or 27.6%, in 2007 compared to 2006. The increase was due primarily to an increase in the average floor plan balance for used vehicles of $20.6 million.
39
Interest expense, floor plan for new vehicles increased $19.1 million, or 53.9%, in 2006 compared to 2005. The average floor plan interest rate for new vehicles incurred by continuing dealerships was 5.9% for the year ended December 31, 2006, compared to 4.3% for the year ended December 31, 2005, which increased interest expense by approximately $13.4 million. In addition to this, during 2006 the average floor plan balance for new vehicles increased $96.7 million which resulted in an increase in expense of approximately $5.7 million. Approximately $22.0 million of the increase in the average new vehicle floor plan balance was due to additional dealerships we acquired in 2006.
Interest expense, floor plan for used vehicles increased expense in 2006 compared to 2005 by $4.9 million. The floor plan interest expense associated with used vehicles was the result of borrowings under the 2006 Used Vehicle Floor Plan Sub-Facility (see Note 6 in the accompanying Consolidated Financial Statements). The average balance of the Used Vehicle Floor Plan Sub-Facility was $101.0 million in 2006 and bore an interest rate of between 5.7% and 6.5%.
Our floor plan expenses related to new vehicles are partially offset by amounts received from manufacturers in the form of floor plan assistance. These payments are credited against our cost of sales upon the sale of the vehicle. For franchises classified as continuing operations, our floor plan interest expense exceeded the amounts we recognized in our Consolidated Income Statements from floor plan assistance by approximately $1.8 million, $22.6 million and $30.9 million in 2005, 2006 and 2007, respectively. As we continue to adjust our portfolio of brands to more luxury and import franchises, we expect the difference between floor plan interest expense incurred and floor plan assistance received to widen as import and luxury manufacturers provide a smaller level of floor plan assistance than domestic manufacturers.
Interest Expense, Other, Net
During 2007, we entered into interest rate swap agreements (the “Fixed Swaps”) to effectively convert a portion of our LIBOR-based variable rate debt to a fixed rate, in order to reduce our exposure to market risks from fluctuations in interest rates. The Fixed Swaps have been designated and qualify as cash flow hedges and, as a result, changes in the fair value of the Fixed Swaps will be recorded in other comprehensive (loss)/income, net of related income taxes in the Consolidated Statements of Stockholders’ Equity. The benefit realized (the difference between interest paid and interest received) was $0.5 million in 2007 and is included in interest expense, other, net in the accompanying Consolidated Statements of Income.
In order to reduce our exposure to market risks from fluctuations in interest rates, we had an interest rate swap agreement to effectively convert a portion of our LIBOR-based variable rate debt to a fixed rate which matured on June 6, 2006 and had a notional principal of $100.0 million. Under the terms of the swap agreement, we received interest payments on the notional amount at a rate equal to the one month LIBOR rate, and made interest payments at a fixed rate of 4.50%. The incremental expense incurred (the difference between interest paid and interest received) was $1.2 million and $0.1 million in 2005 and 2006, respectively, and is included in interest expense, other, net in the accompanying Consolidated Statements of Income.
In 2003, we entered into five separate interest rate swaps totaling $150.0 million (collectively, the “Old Variable Swaps”) to effectively convert a portion of our fixed rate debt to a LIBOR-based variable rate debt. Under the Old Variable Swaps’ agreements, we received 8.625% on the respective notional amounts and paid interest payments on the respective notional amounts at a rate equal to the six month LIBOR in arrears (as determined on February 15 and August 15 of each year) plus a spread ranging from 3.50% to 3.84% with a weighted average spread of 3.64%. In the second quarter of 2005, we canceled all of the Old Variable Swaps. The Old Variable Swaps had a collective mark-to-market of $0.4 million at cancellation. In connection with this cancellation, we entered into five separate new interest rate swaps with identical terms to the Old Variable Swaps except that we pay a variable rate equal to the fixed six month LIBOR rate which will be fixed on February 15 and August 15 of each year plus a spread ranging from 3.825% to 3.85% (with a weighted average spread of 3.83%) (collectively, the “New Variable Swaps”). The benefit realized (the difference between interest paid and
40
interest received) as a result of the Old and New Variable Swaps was $1.5 million in 2005, and an expense of $0.4 million and $1.3 million in 2006 and 2007 respectively. The incremental expenses/benefits of the Old and New Variable swaps are included in interest expense, other, net in the accompanying Consolidated Statements of Income.
Changes in other interest expense are summarized in the schedule below:
| 2006 | 2007 | |||||||
| Increase/(Decrease) in Interest Expense (in millions) |
Increase/(Decrease) in Interest Expense (in millions) |
|||||||
| Interest rates— |
||||||||
| • Changes in the average interest rate on the revolving facilities (5.94% in 2005, 6.81% in 2006 and 7.28% in 2007) |
$ | 2.2 | $ | (0.4 | ) | |||
| • Rate spread benefit due to repayment of revolving credit facilities with proceeds from 4.25% Convertible Notes issuance |
(1.4 | ) | — | |||||
| Debt balances— |
||||||||
| • Increase/(Decrease) in debt balances |
(3.6 | ) | (2.8 | ) | ||||
| Other factors— |
||||||||
| • Decrease/(increase) in capitalized interest |
(1.3 | ) | 1.2 | |||||
| • Incremental interest savings related to variable to fixed rate swaps |
(1.3 | ) | (0.4 | ) | ||||
| • Incremental interest expense related to the Old and New Variable Swaps |
1.9 | 0.9 | ||||||
| • Interest allocation to discontinued operations |
0.8 | 0.5 | ||||||
| • Increase in other expense, net |
0.3 | 0.3 | ||||||
| $ | (2.4 | ) | $ | 0.1 | ||||
Other Income/Expense, Net
Other income/expense decreased approximately $0.7 million in 2007 compared to 2006 and increased approximately $0.6 million in 2006 compared to 2005 due mostly to fees incurred in 2006 related to the termination of the 2001 Revolving Credit Facility, as amended.
Provision for Income Taxes
The effective tax rate from continuing operations was 39.3% in 2007, 40.4% in 2006 and 37.1% in 2005 Changes in the effective tax rate between years were primarily the result of the distribution of taxable income between states. We expect the effective tax rate in future periods to fall within a range of 39% to 41%.
Liquidity and Capital Resources
We require cash to finance acquisitions and fund debt service and working capital requirements. We rely on cash flows from operations, borrowings under our 2006 Credit Facility and offerings of debt and equity securities to meet these requirements.
Because the majority of our consolidated assets are held by our dealership subsidiaries, the majority of our cash flows from operations are generated by these subsidiaries. As a result, our cash flows and ability to service debt depends to a substantial degree on the results of operations of these subsidiaries and their ability to provide us with cash based on their ability to generate cash. Uncertainties in the economic environment may therefore affect our overall liquidity.
41
A significant portion of our cash flow is used to fund dealership acquisitions. Following is a summary of acquisition activity in recent years:
| Year of Acquisition |
Subsequent Year Revenues |
Cash Portion of Purchase Price (net of cash acquired) | |||
| (in millions) | |||||
| 2004 |
589.4 | 268.7 | |||
| 2005 |
448.9 | 138.8 | |||
| 2006 |
231.0 | 110.4 | |||
| 2007 |
475.0 | (a) | 212.5 | ||
| (a) | Revenues are estimated |
We believe it prudent over time to maintain our long-term-debt to total capital ratio, net of cash and cash equivalents (the “Debt to Capital Ratio”) at between 35% and 40%. At December 31, 2007, our Debt to Capital Ratio was 42.4%. The increase of our Debt to Capital Ratio in the current year from 39.4% in the prior year is primarily due to borrowings related to current year acquisitions, stock repurchases and the strategic decision to own mortgaged dealership properties rather than enter into long-term operating leases. Without the effect of the new mortgages entered into in 2007 (discussed below), our Debt to Capital Ratio at December 31, 2007 would have been 40.7%. Depending on the timing of dealership acquisitions, our Debt to Capital ratio may fall outside our targeted range.
Our long-term debt structure consists of the 2006 Credit Facility due in 2010 and various senior subordinated notes due or redeemable in 2009, 2010, 2013 and 2015, notes payable to a finance company and mortgage notes. These are discussed in more detail below. We believe the combination of cash flows from operations, floor plan facilities, the availability under our 2006 Credit Facility (approximately $205.2 million was available under the 2006 Revolving Credit Sub-Facility at December 31, 2007) and our ability to raise funds in the public capital markets are sufficient to fund both our working capital needs and the targeted acquisition level discussed above.
Long-Term Debt and Credit Facilities
2006 Credit Facility
On February 17, 2006, we entered into a new four-year syndicated credit facility (the “2006 Credit Facility”) with 14 financial institutions, including three manufacturer-affiliated finance companies, providing for up to $1.2 billion in revolving credit and floor plan financing. The 2006 Credit Facility replaces the 2001 Revolving Credit Facility, as amended, (which was terminated February 17, 2006) and a portion of our existing floor plan financing arrangements.
The 2006 Credit Facility has a borrowing limit of $1.2 billion, which may be expanded up to $1.45 billion in total credit availability upon satisfaction of certain conditions. Under the terms of the 2006 Credit Facility, up to $700.0 million is available for new vehicle inventory floor plan financing (the “2006 New Vehicle Floor Plan Sub-Facility”), up to $150.0 million is available for used vehicle inventory floor plan financing (the “2006 Used Vehicle Floor Plan Sub-Facility”) and up to $350.0 million is available for working capital and general corporate purposes (the “2006 Revolving Credit Sub-Facility”). The amount available for borrowing under the 2006 Revolving Credit Sub-Facility is reduced on a dollar-for-dollar basis by the aggregate face amount of any outstanding letters of credit under the 2006 Revolving Credit Sub-Facility. The 2006 Revolving Credit Sub-Facility matures on February 17, 2010. The 2006 New Vehicle Floor Plan Sub-Facility and the 2006 Used Vehicle Floor Plan Sub-Facility mature on the earlier of February 17, 2010 or upon demand by the administrative agent at the request of more than 80% of the lenders under those facilities.
At December 31, 2007, our 2006 Revolving Credit Sub-Facility had a borrowing limit of $350.0 million, subject to a borrowing base calculated on the basis of our receivables, inventory and equipment and a pledge of
42
certain additional collateral by one of our affiliates (the borrowing base was approximately $385.2 million at December 31, 2007). The amount available to be borrowed under our 2006 Revolving Credit Sub-Facility is reduced on a dollar-for-dollar basis by the cumulative face amount of outstanding letters of credit. At December 31, 2007, we had $74.8 million in letters of credit outstanding and $205.2 million of borrowing availability.
The amounts outstanding under the 2006 Revolving Credit Sub-Facility bear interest at a specified percentage above LIBOR according to a performance-based pricing grid determined by our Total Senior Secured Debt to EBITDA Ratio as of the last day of the immediately preceding fiscal quarter. The range of the performance-based pricing grid is from 1.75% above LIBOR to 2.75% above LIBOR. The weighted average rate of the 2006 Revolving Credit Sub-Facility during the year ended December 31, 2006 and 2007 was 6.81% and 5.95%, respectively. In addition, there is a quarterly commitment fee payable by us on the unused portion of the 2006 Revolving Credit Sub-Facility according to a performance-based pricing grid determined by our Total Senior Secured Debt to EBITDA Ratio as of the last day of the immediately preceding fiscal quarter. The range of the performance-based pricing grid for the quarterly commitment fee is 0.20% to 0.45% on the unused portion of the 2006 Revolving Credit Sub-Facility.
The amounts outstanding under the 2006 New Vehicle Floor Plan Sub-Facility bear interest at 1.00% above LIBOR. The amounts outstanding under the 2006 Used Vehicle Floor Plan Sub-Facility bear interest at 1.125% above LIBOR. In addition, there are quarterly commitment fees of 0.20% payable by us on the unused portion of both the 2006 New Vehicle Floor Plan Sub-Facility and the 2006 Used Vehicle Floor Plan Sub-Facility.
Under the terms of collateral documents entered into with the lenders under the 2006 Credit Facility, outstanding balances under the 2006 Credit Facility are secured by a pledge of substantially all of our assets and the assets of substantially all of our domestic subsidiaries, which domestic subsidiaries also guarantee our obligations under the 2006 Credit Facility, and the pledge of certain additional collateral by one of our affiliates. The collateral for the 2006 Credit Facility also includes the pledge of the stock or equity interests of our dealership franchise subsidiaries, except where such a pledge is prohibited by the applicable vehicle manufacturer.
We agreed under the 2006 Credit Facility not to pledge any assets to any third party, subject to certain stated exceptions, including floor plan financing arrangements. In addition, the 2006 Credit Facility contains certain negative covenants, including covenants which could restrict or prohibit the payment of dividends, capital expenditures and material dispositions of assets as well as other customary covenants and default provisions. Specifically, the 2006 Credit Facility permits cash dividends on our Class A and Class B common stock so long as no event of default or unmatured default (as defined in the 2006 Credit Facility) has occurred and is continuing and provided that, after giving effect to the payment of a dividend, we remain in compliance with other terms and conditions of the 2006 Credit Facility.
The 2006 Credit Facility contains events of default, including cross-defaults to other material indebtedness, change of control events and events of default customary for syndicated commercial credit facilities. Upon the occurrence of an event of default, we could be required to immediately repay all outstanding amounts under the 2006 Credit Facility.
On February 17, 2006, in conjunction with the entrance into the 2006 Credit Facility, we and substantially all of our domestic subsidiaries entered into collateral documents with the lenders, pursuant to which we and substantially all of our domestic subsidiaries granted a security interest in substantially all their assets to secure our obligations under the 2006 Credit Facility, including a pledge of the stock or equity interests of our dealership franchise subsidiaries except where such a pledge is prohibited by the applicable vehicle manufacturer. This grant of security interests replaces the grant under the 2001 Revolving Credit Facility, as amended.
43
2001 Revolving Credit Facility, as Amended
Prior to entering into the 2006 Credit Facility, we utilized the 2001 Revolving Credit Facility, as amended. This facility was with Ford Credit, DaimlerChrysler Financial, Toyota Financial, Bank of America, JP Morgan Chase Bank and Merrill Lynch and had a borrowing limit of $550.0 million, subject to a borrowing base calculated on the basis of receivables, inventory and equipment and a pledge of certain additional collateral by one of our affiliates. The amounts outstanding under the 2001 Revolving Credit Facility bore interest at 2.55 percentage points above LIBOR. The 2001 Revolving Credit Facility included an annual commitment fee equal to 0.25% of the unused portion of the 2001 Revolving Credit Facility.
Senior Subordinated 8.625% Notes
In August 2003, we issued $200.0 million in aggregate principal amount of 8.625% Notes. In November 2003, we issued an additional $75.0 million in aggregate principal amount of the 8.625% Notes. This $75.0 million issuance contains the same provisions and terms as the $200.0 million issuance. The 8.625% Notes are unsecured obligations that rank equal in right of payment to all of our existing and future senior subordinated indebtedness, mature on August 15, 2013 and are redeemable at our option after August 15, 2008. The redemption premiums for the twelve-month periods beginning August 15 of the years 2008, 2009 and 2010 are 104.313%, 102.875% and 101.438%, respectively. In addition, up to 35% of the aggregate principal amount of the 8.625% Notes may be redeemed on or before August 15, 2006 with net cash proceeds from certain equity offerings. Our obligations under the 8.625% Notes are guaranteed by our operating domestic subsidiaries.
We have five separate interest rate swaps totaling $150.0 million to effectively convert a portion of our fixed rate debt under the 8.625% Notes to a LIBOR-based variable rate debt. See Note 1 to our Consolidated Financial Statements and Item 7A: Quantitative and Qualitative Disclosures About Market Risk—Interest Rate Risk. If the Standard & Poor’s or Moody’s Investor Services rating on our 8.625% Notes drops to “B” or “B2”, respectively, or is withdrawn, the counterparty for $125.0 million of the total interest rate swap notional value of $150.0 million has the option to terminate their interest rate swaps with us. If this counterparty terminates these options, the mark-to-market value of these interest rate swaps must be paid by either us or the counterparty. Further, if the counterparty terminates, it is likely that we will be required to pay the mark-to-market value of these interest rate swaps. Additionally, if such a termination occurs, the fair value of $125.0 million of our 8.625% Notes will no longer be hedged.
Convertible Senior Subordinated Notes
In May 2002, we issued $149.5 million in aggregate principal amount of 5.25% convertible senior subordinated notes (“2002 Convertibles”) with net proceeds, before expenses, of approximately $145.1 million. The 2002 Convertibles are unsecured obligations that rank equal in right of payment to all of our existing and future senior subordinated indebtedness, mature on May 7, 2009 and are redeemable at our option after May 7, 2005. The redemption premiums for the twelve-month periods beginning May 7 of the years 2005, 2006, 2007 and 2008 are 103.00%, 102.25%, 101.50% and 100.75%, respectively. Our obligations under the 2002 Convertibles are not guaranteed by any of our subsidiaries. The 2002 Convertibles are convertible into shares of Class A common stock, at the option of the holder, based on certain conditions. See Note 6 to our Consolidated Financial Statements for a discussion regarding these conversion conditions. Also see “Off-Balance Sheet Arrangements” (subsequent heading also within this Item 7) for a discussion regarding the off-balance sheet aspects of this financing. None of the conversion features on the 2002 Convertibles were triggered in 2007 and none of the 2002 Convertibles were redeemed in 2007.
In November and December 2005, we issued $160.0 million in aggregate principal amount of convertible senior subordinated notes (“2005 Convertibles”) with net proceeds, before expenses, of approximately $156.2 million. The 2005 Convertibles bear interest at an annual rate of 4.25% until November 30, 2010 and 4.75% thereafter. The net proceeds were used to repay a portion of the amounts outstanding under our 2001 Revolving
44
Credit Facility, as amended, and to pay the net cost of convertible note hedge and warrant transactions. The 2005 Convertibles are unsecured obligations that rank equal in right of payment to all of our existing and future senior subordinated indebtedness, mature on November 30, 2015 and are redeemable on or after October 31, 2010. Our obligations under the 2005 Convertibles are not guaranteed by any of our subsidiaries. Holders of the 2005 Convertibles may convert them into cash and shares of our Class A common stock based on certain conditions. Upon conversion of the 2005 Convertibles, we will be required to deliver cash equal to the lesser of the aggregate principal amount of the 2005 Convertibles being converted or our total conversion obligation. If our total conversion obligation exceeds the aggregate principal amount of the 2005 Convertibles being converted, we will deliver shares of our Class A common stock to the extent of the excess amount, if any. We used $18.5 million of the net proceeds from the sale of the 2005 Convertibles to pay the net cost of convertible note hedge and warrant transactions. See Note 6 to our Consolidated Financial Statements for a discussion regarding these conversion conditions. Also see “Off-Balance Sheet Arrangements” (subsequent heading also within this Item 7) for a discussion regarding the off-balance sheet aspects of this financing and the convertible note hedge and warrant transactions. None of the conversion features on the 2005 Convertibles were triggered in 2007.
Notes Payable to a Finance Company
Three notes payable totaling $26.6 million in aggregate principal were assumed with the purchase of certain dealerships during the second quarter of 2004 (the “Assumed Notes”). The Assumed Notes bear interest rates from 9.52% to 10.52% (with a weighted average of 10.19%), have a combined monthly principal and interest payment of $0.3 million, mature November 1, 2015 through September 1, 2016 and are collateralized by letters of credit. We recorded the Assumed Notes at fair value using an interest rate of 5.35%. The interest rate used to calculate the fair value was based on a quoted market price for notes with similar terms as of the date of assumption. As a result of calculating the fair value, a premium of $7.3 million was recorded that will be amortized over the lives of the Assumed Notes. Although the Assumed Notes allow for prepayment, the penalties and fees are disproportionately burdensome relative to the Assumed Notes’ principal balance. Therefore, we do not currently intend to prepay the Assumed Notes.
Mortgage Notes
During 2007, we obtained mortgage financing totaling $46.7 million in aggregate, on four of our dealership properties. These mortgage notes require monthly payments of principal and interest through maturity and are secured by the underlying properties. Maturity dates range between July 2017 and November 2027. The weighted average interest rate was 6.81% at December 31, 2007. Proceeds received were used to repay borrowings under our 2006 Revolving Credit Sub-Facility.
Floor Plan Facilities
We finance all of our new and certain of our used vehicle inventory through standardized floor plan facilities. These floor plan facilities bear interest at variable rates based on LIBOR and prime. The weighted average interest rate for our floor plan facilities was 6.0% for 2006 and 6.4% for 2007. Our floor plan interest expense is partially offset by amounts received from manufacturers, in the form of floor plan assistance. Floor plan assistance received is capitalized in inventory and charged against cost of sales when the associated inventory is sold. In 2007, we recognized approximately $40.4 million in manufacturer assistance. Interest payments under each of our floor plan facilities are due monthly and we are generally not required to make principal repayments prior to the sale of the vehicles.
Prior to February 17, 2006, we engaged in financing our new vehicle inventory with DaimlerChrysler Financial Company, LLC (“DaimlerChrysler Financial”), Ford Motor Credit Company (“Ford Credit”), General Motors Acceptance Corporation (“GMAC”), Toyota Financial Services (“Toyota Financial”), Bank of America and JP Morgan Chase Bank. On February 17, 2006 and shortly thereafter, we also entered into or renewed separate floor plan credit arrangements with DaimlerChrysler Services North America LLC, Ford Motor Credit
45
Company, General Motors Acceptance Corporation and BMW Financial Services NA, LLC. These separate floor plan credit facilities provide a total of approximately $617.0 million of availability to finance new vehicle inventory purchased from the respective manufacturer affiliates of these captive finance companies and $150.0 million of availability to finance used vehicle inventory. Each of these separate floor plan facilities bear interest at variable rates based on prime and LIBOR. Our obligation under each of these separate floor plan facilities are secured, or will be secured, by liens on all of the new vehicle inventory financed under the respective floor plan credit facility, as well as the proceeds from the sale of such vehicles, and certain other collateral.
Covenants and Default Provisions
Noncompliance with covenants, including a failure to make any payment when due, under our 2006 Credit Facility, floor plan facilities, 8.625% Notes, 2002 Convertibles and 2005 Convertibles (collectively, our “Material Debt Agreements”) could result in a default and an acceleration of our repayment obligation under our 2006 Credit Facility. A default under our 2006 Credit Facility would constitute a default under our floor plan facilities and could entitle these lenders to accelerate our repayment obligations under the one or more of the floor plan facilities. A default under our 2006 Credit Facility and one or more floor plan facilities would not result in a default under our 8.625% Notes, 2002 Convertibles or 2005 Convertibles unless our repayment obligations under the 2006 Credit Facility and/or one or more of the floor plan facilities were accelerated. An acceleration of our repayment obligation under any of our Material Debt Agreements could result in an acceleration of our repayment obligations under our other Material Debt Agreements. We expect to be in compliance with the covenants for all of our long-term debt agreements for the foreseeable future. We were in compliance with all of the restrictive and financial covenants on all of our floor plan and long-term debt facilities required to be submitted as of and for the period ended December 31, 2007. The 2006 Credit Facility includes the following financial covenants:
| Covenant |
Required | ||
| Consolidated liquidity ratio |
³ | 1.15 | |
| Consolidated fixed charge coverage ratio |
³ | 1.20 | |
| Consolidated total senior secured debt to EBITDA ratio |
£ | 2.25 | |
Acquisitions and Dispositions
During 2007, we acquired ten franchises for a combined purchase price of $212.5 million in cash, net of cash acquired. The cash utilized for these acquisitions was financed by cash generated from our existing operations and by borrowings under our 2006 Credit Facility. During 2007, we disposed of twelve franchises. These disposals generated cash of $62.9 million, which includes $34.0 million related to the sale of the remaining assets of Cornerstone Acceptance Corporation.
Sale-Leaseback and Mortgage Transactions
In an effort to generate additional cash flow, historically we sought to minimize the ownership of real property. As a result, facilities either constructed by us or obtained in acquisitions were sold to third parties in sale-leaseback transactions. The resulting leases generally have initial terms of 10-20 years and include a series of five-year renewal options. We have no continuing obligations under these arrangements other than lease payments. In 2007, we sold $27.1 million in dealership property and equipment in sale-leaseback transactions. There were no material gains or losses on these sales. In 2007, we began to adjust our strategy on ownership of dealership properties and began to mortgage properties we own rather than generate capital by entering into sale-leaseback transactions. We expect this trend to continue in the future, thereby reducing the frequency of future sale-leaseback transactions.
46
Capital Expenditures
Our capital expenditures include the construction of new dealerships and collision repair centers, building improvements and equipment purchased for use in our dealerships. Capital expenditures in 2007 were approximately $78.3 million. As of December 31, 2007, commitments for facilities construction projects totaled approximately $22.2 million.
Stock Repurchase Program
Our Board of Directors has authorized us to repurchase shares of our Class A common stock or redeem securities convertible into Class A common stock. At the beginning of 2007, our remaining repurchase authorization was approximately $12.2 million. During 2007, we received an additional $70.0 million stock repurchase authorization from our Board of Directors. During 2007, we repurchased 1,916,200 shares for approximately $48.9 million. As of December 31, 2007, we had $33.3 million remaining under our Board authorization.
Dividends
Our Board of Directors approved four quarterly cash dividends totaling $0.48 per share during 2007. Effective February 26, 2008, our Board of Directors approved a dividend of $0.12 per share for shareholders of record on March 15, 2008 that will be paid on April 15, 2008. We intend to pay dividends in the future based on available cash flows, covenant compliance and other factors. See Note 6 to our Consolidated Financial Statements for a description of restrictions on the payment of dividends.
Cash Flows
Cash Flows from Operating Activities—Net cash provided by operating activities was $34.1 million and $84.1 million for the years ended December 31, 2007 and 2005, respectively. Net cash used in operating activities was $61.9 million for the year ended December 31, 2006. Since the majority of our inventories are financed through floor plan notes payable and a significant portion of our receivables represent contracts in transit which are typically funded within ten days of the sale of the vehicle, we are not required to make significant investments in working capital that would negatively impact our operating cash flows.
We arrange our inventory floor plan financing through both manufacturer captive finance companies and commercial banks. Generally, our floor plan financed with manufacturer captives is recorded as trade floor plan liabilities (with the resulting change being reflected as an operating cash flow). Our dealerships that obtain floor plan financing from commercial banks record their obligation as non-trade floor plan liabilities (with the resulting change being reflected as a financing cash flow).
Due to the presentation differences for changes in trade floor plan and non-trade floor plan, in the statement of cash flows, decisions made by us to move dealership floor plan financing arrangements from one finance source to another may cause significant variations in operating and financing cash flows without affecting our overall liquidity, working capital, or cash flow. Accordingly, if all changes in floor plan notes payable were classified as an operating activity for the years ended December 31, 2007, 2006 and 2005 the adjusted net cash provided by operating activities would be $156.3 million, $249.5 million and $116.1 million, respectively.
During the third quarter of 2006, we generated cash of approximately $26.8 million from the sale of a portion of Cornerstone’s notes receivable to a third party. This inflow of cash is included in cash flows from operating activities, change in receivables, in the accompanying consolidated statements of cash flows for the year ended December 31, 2006. This transaction resulted in no material gains or losses. The proceeds from the sale were used to pay down our 2006 Credit Facility. Cornerstone’s outstanding notes receivable at December 31, 2006 were $28.5 million, net of an allowance for credit losses of $4.9 million. During the third quarter of 2007, we sold the remaining assets of Cornerstone and the proceeds are included in cash flows from investing activities.
47
Cash flows from Investing Activities—Cash used in investing activities during 2007, 2006 and 2005 was $195.6 million, $118.0 million, and $131.9 million, respectively. The majority of the investing activities cash outflow is related to dealership acquisitions and capital expenditures on construction in progress projects partially offset by proceeds received from dealership dispositions and the sales of property and equipment. Purchases of businesses, net of cash acquired, was $212.5 million, $110.4 million and $138.8 million for the years ended December 31, 2007, 2006 and 2005, respectively. These amounts include repayments of seller’s floor plan notes payable of $43.3 million, $37.1 million and $51.5 million, respectively.
Cash Flows from Financing Activities—Net cash provided by financing activities was $165.4 million, $185.0 million and $45.4 million for the years ended December 31, 2007, 2006 and 2005, respectively. Cash flow provided by financing activities is comprised mostly of the increases of floor plan notes payable—non-trade, borrowings on our revolving credit facilities and proceeds from long-term debt partially offset by repayments on our revolving credit facilities. During the years ended December 31, 2007 and 2005, proceeds from long-term debt amounted to $46.7 million and $156.2 million, respectively. The 2007 proceeds from long-term debt were obtained from mortgage financing on four dealership properties. Proceeds received were used to repay borrowings under our 2006 Revolving Credit Sub-Facility. The 2005 proceeds from long-term debt were generated by the issuance of our 2005 Convertibles, the net proceeds of which were used to repay a portion of the amounts outstanding under our Revolving Facility and to pay the net cost of convertible note hedge and warrant transactions.
Cash Flows from Discontinued Operations—Our Consolidated Statement of Cash Flows includes both continuing and discontinued operations. Net cash used in operating activities associated with discontinued operations for the year ended December 31, 2007 was approximately $83.1 million and was substantially comprised of changes in assets and liabilities that relate to dealership operations. In our Consolidated Statement of Cash Flows, cash flows from investing activities includes the line item “Proceeds from sale of franchises” which is entirely related to discontinued operations. With the exception of “Proceeds from sale of franchises” in the amount of $62.9 million and “Net payments on notes payable—floor plan—non-trade” in the amount of $14.5 million, 2007 cash flows from investing and financing activities contain an immaterial amount of cash flows from discontinued operations. Since discontinued operations typically contain unprofitable franchises, the absence of these cash flows would generally increase consolidated cash flows from operations.
Guarantees and Indemnifications
In connection with the operation and disposition of dealership franchises, we have entered into various guarantees and indemnifications. Also, when we sell dealership franchises, we attempt to assign any related leases to the buyer of the franchise to eliminate any future liability. However, if we are unable to assign the related leases to the buyer, we will attempt to sublease the leased properties to the buyer at a rate equal to the terms of the original leases. In the event we are unable to sublease the properties to the buyer with terms at least equal to our lease, we may be required to record lease exit accruals. At December 31, 2007, our future gross minimum lease payments related to properties subleased to buyers of sold franchises totaled approximately $53.9 million. Future sublease payments expected to be received related to these lease payments were $46.9 million at December 31, 2007. See Note 11 to our Consolidated Financial Statements for a discussion regarding lease accruals, guarantees and indemnifications. Also see “Off-Balance Sheet Arrangements” (subsequent heading also within this Item 7) for a discussion regarding the off-balance sheet aspects of these guarantees and indemnifications.
48
Future Liquidity Outlook
Our future contractual obligations are as follows:
| (Amounts in thousands) | |||||||||||||||||||||
| 2008 | 2009 | 2010 | 2011 | 2012 | Thereafter | Total | |||||||||||||||
| Floor Plan Facilities (1) |
$ | 1,174,262 | $ | — | $ | — | $ | — | $ | — | $ | — | $ | 1,174,262 | |||||||
| Long-Term Debt (2) |
4,197 | 133,667 | 232,149 | 4,808 | 5,038 | 322,138 | 701,997 | ||||||||||||||
| Estimated Interest Payments on |
|||||||||||||||||||||
| Floor Plan Facilities (3) |
11,960 | — | — | — | — | — | 11,960 | ||||||||||||||
| Estimated Interest Payments on |
|||||||||||||||||||||
| Long-Term Debt (4) |
50,786 | 42,638 | 39,366 | 6,335 | 5,951 | 22,934 | 168,010 | ||||||||||||||
| Operating Leases |
115,516 | 105,121 | 100,203 | 96,248 | 92,085 | 542,805 | 1,051,978 | ||||||||||||||
| Construction Contracts |
22,221 | — | — | — | — | — | 22,221 | ||||||||||||||
| Other Purchase Obligations |
11,474 | 10,475 | 3,515 | — | — | — | 25,464 | ||||||||||||||
| Acquisition Purchase |
|||||||||||||||||||||
| Commitments (5) |
18,600 | — | — | — | — | — | 18,600 | ||||||||||||||
| FIN 48 Liability (6) |
500 | — | — | — | — | 24,062 | 24,562 | ||||||||||||||
| Total |
$ | 1,409,516 | $ | 291,901 | $ | 375,233 | $ | 107,391 | $ | 103,074 | $ | 911,939 | $ | 3,199,054 | |||||||
| (1) | Floor plan facilities includes amounts classified as liabilities associated with assets held for sale. |
| (2) | Amounts under the 8.625% Notes and the 2002 Convertibles are redeemable at our option (see preceding discussion regarding long-term debt and credit facilities) but have been classified in this schedule according to contractual maturity. The 2005 Convertibles are redeemable at both our option and the option of the holders of the 2005 Convertibles in November 2010 and have, therefore, been classified for maturity in 2010. |
| (3) | Floor plan facilities balances (including amounts classified as liabilities associated with assets held for sale) are correlated with the amount of vehicle inventory and are generally due at the time that a vehicle is sold. Estimated interest payments were calculated using the December 31, 2007 floor plan facilities balance, the weighted average interest rate for the fourth quarter of 2007 of 6.18% and the assumption that floor plan facilities balances at December 31, 2007 would be relieved within sixty days in connection with the sale of the associated vehicle inventory. |
| (4) | Estimated interest payments calculated assuming contractual maturities, no principal payments on the 2006 Revolving Credit Sub-Facility before the contractual maturity and the interest rate in effect at December 31, 2007 (6.6%) for the 2006 Revolving Credit Sub-Facility. Estimated interest payments include net interest expense from our interest rate swaps. See Management's Discussion and Analysis of Financial Condition and Results of Operations—Results of Operations—Interest Expense, Other, Net, and Quantitative and Qualitative Disclosures About Market Risk—Interest Rate Risk, for discussion regarding our interest rate swaps. |
| (5) | Amount represents estimated purchase price of tangible and intangible assets net of floor plan facilities balances of planned acquisitions. |
| (6) | Amount represents recorded liability, including interest and penalties, related to FIN 48. See Notes 1 and 7 to the accompanying Consolidated Financial Statements. |
We believe our best source of liquidity for future growth remains cash flows generated from operations combined with our availability of borrowings under our floor plan facilities (or any replacements thereof), our 2006 Credit Facility and our ability to raise funds in the public capital markets. Though uncertainties in the economic environment may affect our ability to generate cash from operations, we expect to generate more than sufficient cash flow to fund our debt service and working capital requirements and any seasonal operating
49
requirements, including our currently anticipated internal growth for our existing businesses, for the next twelve months and the foreseeable future. Once these needs are met, we may use remaining cash flow to support our acquisition strategy or repurchase shares of our Class A common stock or publicly traded debt securities, as market conditions warrant.
Seasonality
Our operations are subject to seasonal variations. The first and fourth quarters generally contribute less operating profits than the second and third quarters. Weather conditions, the timing of manufacturer incentive programs and model changeovers cause seasonality in, and may adversely affect our profitability and new vehicle demand. Parts and service demand remains more stable throughout the year.
Off-Balance Sheet Arrangements
Guarantees and Indemnifications
In connection with the operation and disposition of dealership franchises, we have entered into various guarantees and indemnifications. We expect the aggregate amount of the obligations we guarantee to increase as we dispose of additional franchises. See Note 11 to our Consolidated Financial Statements for a discussion regarding these guarantees and indemnifications. Past performance under these guarantees and indemnifications and their estimated fair value has been immaterial to our liquidity and capital resources. Although we seek to mitigate our exposure in connection with these matters, these guarantees and indemnifications, including environmental exposures and the financial performance of lease assignees and sub lessees, cannot be predicted with certainty. An unfavorable resolution of one or more of these matters could have a material adverse effect on our liquidity and capital resources.
5.25% Convertible Senior Subordinated Notes
The 2002 Convertibles are convertible into shares of our Class A common stock, at the option of the holder, based on certain conditions. See Note 6 to our Consolidated Financial Statements for a discussion regarding these conversion conditions which are primarily linked to the per share price of our Class A common stock and the relationship between the trading values of our Class A Common Stock and the 2002 Convertibles. This type of financing arrangement was selected by us in order to achieve a more favorable interest rate (as opposed to other forms of available financing). The 2002 Convertibles are material to our liquidity and capital resources.
4.25% Convertible Senior Subordinated Notes, Hedge and Warrants
The 2005 Convertibles are convertible at the option of the holder into cash and shares of our Class A common stock, based on certain conditions. See Note 6 to our Consolidated Financial Statements for a discussion regarding these conversion conditions which are primarily linked to the relationship between the trading values of our Class A common stock and the 2005 Convertibles. Since both the holders of the 2005 Convertibles and we can redeem these notes on or after October 31, 2010, we expect that either a conversion or a redemption of these notes will occur in 2010. This type of financing arrangement was selected by us in order to achieve a more favorable interest rate (as opposed to other forms of available financing). The 2005 Convertibles are material to our liquidity and capital resources.
In connection with the issuance of the 2005 Convertibles we entered into convertible hedge and warrant transactions. The convertible note hedge and warrant transactions are designed to increase the effective conversion price per share of our Class A common stock from $24.14 to $33.00 and, therefore, mitigate the potential dilution upon conversion of the 2005 Convertibles at the time of conversion. The convertible note hedge and warrant transactions have been recorded at cost within stockholders’ equity on our Consolidated Financial Statements in accordance with EITF No. 00-19, “Accounting for Derivative Financial Instruments Indexed to,
50
and Potentially Settled in, a Company’s Own Stock” and EITF No. 01-6, “The Meaning of “Indexed to a Company’s Own Stock” ”. See Note 1 to our Consolidated Financial Statements, Derivative Instruments and Hedging Activities, for a discussion regarding the convertible note hedge and warrant transactions.
| Item 7A: | Quantitative and Qualitative Disclosures About Market Risk. |
Interest Rate Risk
Our variable rate floor plan facilities, revolving credit facility borrowings and other variable rate notes expose us to risks caused by fluctuations in the applicable interest rates. The total outstanding balance of such variable instruments after considering the effect of our interest rate swaps (see below) was approximately $829.4 million at December 31, 2007 and approximately $1,331.3 million at December 31, 2006. A change of 100 basis points in the underlying interest rate would have caused a change in interest expense of approximately $10.7 million in 2007 and approximately $14.5 million in 2006. Of the total change in interest expense, approximately $8.4 million in 2007 and approximately $10.9 million in 2006 would have resulted from the floor plan facilities. During the last half of 2007, we entered into interest rate swap agreements (see table below) which lessen the effect of changes in interest rates on our results of operations. As these swaps were only in place for a portion of the year, only a portion of the annual effect of these swaps was considered in the calculation of the $8.4 million amount above.
In addition to our variable rate debt, approximately 18% of our dealership facilities have monthly lease payments that fluctuate based on LIBOR interest rates. A change in interest rates of 100 basis points would have had an estimated impact on rent expense of approximately $2.3 million in 2007.
In order to reduce our exposure to market risks from fluctuations in interest rates, we had an interest rate swap agreement to effectively convert a portion of our LIBOR-based variable rate debt to a fixed rate. The swap matured June 6, 2006 and had a notional principal of $100.0 million. Under the terms of the swap, we received interest payments on the notional amount at a rate equal to the one month LIBOR rate, adjusted monthly, and made interest payments at a fixed rate of 4.50%.
We have five separate interest rate swaps with notional principal amounts totaling $150.0 million (collectively, the “New Variable Swaps”) to effectively convert a portion of our fixed rate debt under the 8.625% Notes to a LIBOR-based variable rate debt. Under the New Variable Swaps, we receive 8.625% on the respective notional amounts and pay interest payments on the respective notional amounts at a rate equal to the six month LIBOR which is fixed on February 15 and August 15 of each year plus a spread ranging from 3.825% to 3.85% with a weighted average spread of 3.83%. The New Variable Swaps expire on August 15, 2013.
During 2007, we entered into interest rate swap agreements (collectively, the “Fixed Swaps”) to effectively convert a portion of its LIBOR based variable rate debt to a fixed rate. Under the terms of the Fixed Swaps interest rates reset monthly. We will receive and pay interest based on the following:
| Notional |
Pay Rate |
Receive Rate |
Maturing Date | |||||
| (in millions) | ||||||||
| $ | 200.0 | 4.935 | % | one month LIBOR | May 1, 2012 | |||
| $ | 100.0 | 5.002 | % | one month LIBOR | June 1, 2012 | |||
| $ | 100.0 | 5.265 | % | one month LIBOR | June 1, 2012 | |||
| $ | 100.0 | 5.319 | % | one month LIBOR | July 1, 2010 | |||
| $ | 4.2 | 7.100 | % | one month LIBOR | July 10, 2017 | |||
| $ | 25.0 | 5.160 | % | one month LIBOR | September 1, 2012 | |||
| $ | 15.0 | 4.965 | % | one month LIBOR | September 1, 2012 | |||
| $ | 25.0 | 4.885 | % | one month LIBOR | October 1, 2012 | |||
| $ | 13.2 | 4.655 | % | one month LIBOR | December 10, 2017 | |||
51
Future maturities of variable and fixed rate debt, and related interest rate swaps are as follows:
| 2008 | 2009 | 2010 | 2011 | 2012 | Thereafter | Total | Fair Value | |||||||||||||||||
| Liabilities | (Amounts in thousands, except for interest rates) | |||||||||||||||||||||||
| Long-term Debt: |
||||||||||||||||||||||||
| Fixed Rate |
3,316 | 132,731 | 161,273 | 3,932 | 4,162 | 309,036 | 614,450 | 618,114 | ||||||||||||||||
| Average Stated Interest Rate |
9.26 | % | 5.33 | % | 4.34 | % | 9.32 | % | 9.34 | % | 8.54 | % | 6.75 | % | ||||||||||
| Variable Rate |
881 | 936 | 70,876 | 876 | 876 | 13,102 | 87,547 | 87,547 | ||||||||||||||||
| Average Stated Interest Rate |
6.75 | % | 6.74 | % | 6.60 | % | 6.65 | % | 6.65 | % | 6.65 | % | 6.61 | % | ||||||||||
| Interest Rate Derivatives | ||||||||||||||||||||||||
| Interest Rate Swaps: |
||||||||||||||||||||||||
| Fixed to Variable |
— | — | — | — | — | 150,000 | 150,000 | 724 | ||||||||||||||||
| Average pay rate |
3.83% + 6 month LIBOR |
|
3.83% + 6 month LIBOR |
|
||||||||||||||||||||
| Receive rate |
8.625 | % | 8.625 | % | ||||||||||||||||||||
| Variable to Fixed |
821 | 876 | 100,876 | 876 | 465,876 | 13,084 | 582,409 | (23,870 | ) | |||||||||||||||
| Average pay rate |
5.30 | % | 5.26 | % | 5.32 | % | 5.26 | % | 5.03 | % | 5.24 | % | 5.09 | % | ||||||||||
| Receive rate |
One month LIBOR |
|
One month LIBOR |
|
One month LIBOR |
|
One month LIBOR |
|
One month LIBOR |
|
One month LIBOR |
|
One month LIBOR |
|
||||||||||
Foreign Currency Risk
In common with other automotive retailers, we purchase certain of our new vehicle and parts inventories from foreign manufacturers. Although we purchase our inventories in U.S. Dollars, our business is subject to foreign exchange rate risk which may influence automobile manufacturers’ ability to provide their products at competitive prices in the United States. To the extent that we cannot recapture this volatility in prices charged to customers or if this volatility negatively impacts consumer demand for our products, this volatility could adversely affect our future operating results.
| Item 8. | Financial Statements and Supplementary Data. |
See “Consolidated Financial Statements and Notes” that appears on page F-1 herein.
| Item 9. | Changes in and Disagreements with Accountants on Accounting and Financial Disclosure. |
None.
| Item 9A. | Controls and Procedures. |
Controls and Procedures
Our management, under the supervision and with the participation of our principal executive officer and principal financial officer, evaluated the effectiveness of the design and operation of our disclosure controls and procedures as of the end of the period covered by this Annual Report on Form 10-K. Based on this evaluation, our principal executive officer and principal financial officer have concluded that the design and operation of our disclosure controls and procedures are effective. During our last fiscal quarter, there were no changes in our internal control over financial reporting that have materially affected or are reasonably likely to materially affect our internal control over financial reporting.
52
Report on Internal Control Over Financial Reporting
Our management is responsible for establishing and maintaining adequate internal control over financial reporting, as such term is defined in Exchange Act Rules 13a-15(f). Our internal control over financial reporting is a process designed to provide a reasonable assurance regarding the reliability of financial reporting and the preparation of financial statements for external purposes in accordance with generally accepted accounting principles.
Under the supervision and with the participation of our management, including our principal executive officer and principal financial officer, we conducted an evaluation of the effectiveness of our internal control over financial reporting based on the framework in Internal Control—Integrated Framework issued by the Committee of Sponsoring Organizations of the Treadway Commission. Based on our evaluation under the framework in Internal Control—Integrated Framework, our management concluded that our internal control over financial reporting was effective as of December 31, 2007.
During 2007, Sonic acquired five automotive dealerships which were not included in our assessment of the effectiveness of our internal control over financial reporting. As a result, management’s conclusion regarding the effectiveness of our internal control over financial reporting does not extend to these dealerships. These dealerships represented approximately 3.1% of Sonic’s 2007 revenues from continuing operations. See Note 2 to our accompanying Consolidated Financial Statements for additional information on these 2007 acquisitions.
The effectiveness of our internal control over financial reporting as of December 31, 2007 has been attested to by Deloitte and Touche LLP, the independent registered public accounting firm that audited our financial statements included in this Annual Report on Form 10-K, as stated in their report which is included herein.
53
REPORT OF INDEPENDENT REGISTERED PUBLIC ACCOUNTING FIRM
To the Board of Directors and Stockholders of
Sonic Automotive, Inc.
Charlotte, North Carolina
We have audited the internal control over financial reporting of Sonic Automotive, Inc. and subsidiaries (the “Company”) as of December 31, 2007, based on criteria established in Internal Control—Integrated Framework issued by the Committee of Sponsoring Organizations of the Treadway Commission. As described in the Report on Internal Control Over Financial Reporting, management excluded from their assessment the internal control over financial reporting at Jaguar Houston, Land Rover Houston, Calabasas Mercedes, Assael BMW and Long Beach BMW (the “2007 Acquisitions”), which were acquired on January 22, 2007, January 22, 2007, June 14, 2007, June 18, 2007 and July 30, 2007, respectively, and whose financial statements constitute 0.2 percent and 6.5 percent of net and total assets, respectively, 3.1 percent of revenues, and 5.5 percent of net income of the consolidated financial statement amounts as of and for the year ended December 31, 2007. Accordingly, our audit did not include the internal control over financial reporting at the 2007 Acquisitions. The Company’s management is responsible for maintaining effective internal control over financial reporting and for its assessment of the effectiveness of internal control over financial reporting, included in the accompanying Report on Internal Control Over Financial Reporting. Our responsibility is to express an opinion on the Company’s internal control over financial reporting based on our audit.
We conducted our audit in accordance with the standards of the Public Company Accounting Oversight Board (United States). Those standards require that we plan and perform the audit to obtain reasonable assurance about whether effective internal control over financial reporting was maintained in all material respects. Our audit included obtaining an understanding of internal control over financial reporting, assessing the risk that a material weakness exists, testing and evaluating the design and operating effectiveness of internal control based on the assessed risk, and performing such other procedures as we considered necessary in the circumstances. We believe that our audit provides a reasonable basis for our opinion.
A company’s internal control over financial reporting is a process designed by, or under the supervision of, the company’s principal executive and principal financial officers, or persons performing similar functions, and effected by the company’s board of directors, management, and other personnel to provide reasonable assurance regarding the reliability of financial reporting and the preparation of financial statements for external purposes in accordance with generally accepted accounting principles. A company’s internal control over financial reporting includes those policies and procedures that (1) pertain to the maintenance of records that, in reasonable detail, accurately and fairly reflect the transactions and dispositions of the assets of the company; (2) provide reasonable assurance that transactions are recorded as necessary to permit preparation of financial statements in accordance with generally accepted accounting principles, and that receipts and expenditures of the company are being made only in accordance with authorizations of management and directors of the company; and (3) provide reasonable assurance regarding prevention or timely detection of unauthorized acquisition, use, or disposition of the company’s assets that could have a material effect on the financial statements.
Because of the inherent limitations of internal control over financial reporting, including the possibility of collusion or improper management override of controls, material misstatements due to error or fraud may not be prevented or detected on a timely basis. Also, projections of any evaluation of the effectiveness of the internal control over financial reporting to future periods are subject to the risk that the controls may become inadequate because of changes in conditions, or that the degree of compliance with the policies or procedures may deteriorate.
In our opinion, the Company maintained, in all material respects, effective internal control over financial reporting as of December 31, 2007, based on the criteria established in Internal Control—Integrated Framework issued by the Committee of Sponsoring Organizations of the Treadway Commission.
54
We have also audited, in accordance with the standards of the Public Company Accounting Oversight Board (United States), the consolidated financial statements as of and for the year ended December 31, 2007 of the Company and our report dated February 29, 2008 expressed an unqualified opinion on those financial statements and included an explanatory paragraph regarding the Company’s adoption of the provisions of FASB Interpretation No. 48 Accounting for Uncertainty in Income Taxes, the application of the provisions of Securities and Exchange Commission Staff Accounting Bulletin No. 108, Considering the Effects of Prior Year Misstatements When Quantifying Misstatements in Current Year Financial Statements, and the adoption of Statement of Financial Accounting Standards No. 123(R), Shared-Based Payment.
/S/ DELOITTE & TOUCHE LLP
Charlotte, North Carolina
February 29, 2008
55
| Item 9B. | Other Information. |
None.
PART III
| Item 10. | Directors, Executive Officers and Corporate Governance. |
Information required by this item is furnished by incorporation by reference to the information under the captions entitled “Election of Directors”, “Election of Directors—Board Meetings and Committees of the Board—Audit Committee,” “Section 16(a) Beneficial Ownership Reporting Compliance,” and “Additional Corporate Governance and Other Information—Corporate Governance Guidelines, Code of Business Conduct and Ethics and Committee Charters” in the Proxy Statement (to be filed hereafter) for our Annual Meeting of the Stockholders to be held on April 24 2008 (the “Proxy Statement”). The information required by this item with respect to our executive officers appears in Part I of this Annual Report on Form 10-K under the caption “Executive Officers of the Registrant.”
| Item 11. | Executive Compensation. |
The information required by this item is furnished by incorporation by reference to the information under the captions entitled “Executive Compensation” and “Director Compensation for 2007” in the Proxy Statement.
| Item 12. | Security Ownership of Certain Beneficial Owners and Management and Related Stockholder Matters. |
The information required by this item is furnished by incorporation by reference to the information under the caption “General—Ownership of Voting Stock” and “Equity Compensation Plan Information” in the Proxy Statement.
| Item 13. | Certain Relationships and Related Transactions and Director Independence. |
The information required by this item is furnished by incorporation by reference to all information under the captions “Certain Transactions” and “Election of Directors—Board and Committee Member Independence” in the Proxy Statement.
| Item 14. | Principal Accountant Fees and Services. |
The information required by this item is furnished by incorporation by reference to the information under the caption “Selection of Independent Registered Public Accounting Firm” in the Proxy Statement.
56
PART IV
| Item 15. | Exhibits and Financial Statement Schedules. |
The exhibits and other documents filed as a part of this Annual Report on Form 10-K, including those exhibits that are incorporated by reference herein, are:
(a) (1) Financial Statements: Consolidated Balance Sheets as of December 31, 2006 and 2007. Consolidated Statements of Income for the Years Ended December 31, 2005, 2006 and 2007. Consolidated Statements of Stockholders’ Equity for the Years Ended December 31, 2005, 2006 and 2007. Consolidated Statements of Cash Flows for the Years Ended December 31, 2005, 2006 and 2007.
(2) Financial Statement Schedules: No financial statement schedules are required to be filed (no respective financial statement captions) as part of this Annual Report on Form 10-K.
(3) Exhibits: Exhibits required in connection with this Annual Report on Form 10-K are listed below. Certain of such exhibits, indicated by an asterisk, are hereby incorporated by reference to other documents on file with the SEC with which they are physically filed, to be a part hereof as of their respective dates.
| EXHIBIT NO. |
DESCRIPTION | |
| 3.1* | Amended and Restated Certificate of Incorporation of Sonic (incorporated by reference to Exhibit 3.1 to Sonic’s Registration Statement on Form S-1 (Reg. No. 333-33295) (the “Form S-1”)). | |
| 3.2* | Certificate of Amendment to Sonic’s Amended and Restated Certificate of Incorporation effective June 18, 1999 (incorporated by reference to Exhibit 3.2 to Sonic’s Annual Report on Form 10-K for the year ended December 31, 1999 (the “1999 Form 10-K”)). | |
| 3.3* | Certificate of Designation, Preferences and Rights of Class A Convertible Preferred Stock (incorporated by reference to Exhibit 4.1 to Sonic’s Quarterly Report on Form 10-Q for the quarter ended March 31, 1998). | |
| 3.4* | Amended and Restated Bylaws of Sonic (as amended February 9, 2006) (incorporated by reference to Exhibit 3.1 to Sonic’s Current Report on Form 8-K filed February 13, 2006)). | |
| 4.1* | Specimen Certificate representing Class A Common Stock (incorporated by reference to Exhibit 4.1 to the Form S-1) | |
| 4.3* | Form of 5.25% Convertible Senior Subordinated Note due 2009 (incorporated by reference to Exhibit 4.2 to Sonic’s Amended Current Report on Form 8-K/A filed on May 6, 2002 (the “May 2002 Form 8-K/A”)). | |
| 4.4* | Supplemental Indenture by and among Sonic and U.S. Bank National Association (incorporated by reference to Exhibit 4.1 to the May 2002 Form 8-K/A). | |
| 4.5* | Form of 8 5/8% Senior Subordinated Note due 2013, Series B (incorporated by reference to Exhibit 4.3 to Sonic’s Registration Statement on Form S-4 (Reg. Nos. 333-109426 and 333-109426-1 through 109426-261) (the “2003 Exchange Offer Form S-4”)). | |
| 4.6* | Indenture dated as of August 12, 2003 among Sonic Automotive, Inc., as issuer, the subsidiaries of Sonic named therein, as guarantors, and U.S. Bank National Association, as trustee (the “Trustee”), relating to the 8 5/8% Senior Subordinated Notes due 2013 (incorporated by reference to Exhibit 4.4 to the 2003 Exchange Offer Form S-4). | |
| 4.7* | Form of 4.25% Convertible Senior Subordinated Note due 2015 (incorporated by reference to Exhibit 4.2 to the November 2005 Form 8-K). | |
| 4.8* | Subordinated Indenture, dated as of May 7, 2002, among Sonic, the guarantors named there in and U.S. Bank National Association, as trustee (incorporated by reference to Exhibit 4.1 to Sonic’s Current Report on Form 8-K filed November 21, 2005). | |
57
| EXHIBIT NO. |
DESCRIPTION | |
| 4.9* | Second Supplemental Indenture dated as of November 23, 2005, between Sonic and U.S. Bank National Association (incorporated by reference to Exhibit 4.1 to the November 2005 Form 8-K). | |
| 10.1* | Sonic Automotive, Inc. 2004 Stock Incentive Plan, Amended and Restated as of February 13, 2007 (incorporated by reference to Exhibit 4 to Sonic’s Registration Statement on Form S-8 (Reg. No. 333-142435))(1) | |
| 10.2* | Sonic Automotive, Inc. 1997 Stock Option Plan, Amended and Restated as of April 22, 2003 (incorporated by reference to Exhibit 10.10 to Sonic’s Quarterly Report on Form 10-Q for the quarter ended March 31, 2003).(1) | |
| 10.3* | Sonic Automotive, Inc. Employee Stock Purchase Plan, Amended and Restated as of May 8, 2002 (incorporated by reference to Exhibit 10.15 to the 2002 Annual Report).(1) | |
| 10.4* | Sonic Automotive, Inc. Nonqualified Employee Stock Purchase Plan, Amended and Restated as of October 23, 2002 (incorporated by reference to Exhibit 10.16 to the 2002 Annual Report).(1) | |
| 10.5* | FirstAmerica Automotive, Inc. 1997 Stock Option Plan, Amended and Restated as of December 10, 1999 (incorporated by reference to Exhibit 4.1 to Sonic’s Registration Statement on Form S-8 (Reg. No. 333-95791)).(1) | |
| 10.6* | Employment Agreement dated November 4, 2004 between Sonic and Jeffrey C. Rachor (incorporated by reference to Exhibit 10.24 to the 2004 Annual Report).(1) | |
| 10.7* | Employment Agreement dated December 27, 2004 between Sonic and Mark J. Iuppenlatz (incorporated by reference to Exhibit 10.26 to the 2004 Annual Report).(1) | |
| 10.8* | Sonic Automotive, Inc. 2005 Formula Restricted Stock Plan for Non-Employee Directors, Amended and Restated as of April 19, 2007 (incorporated by reference to Exhibit 4 to Sonic’s Registration Statement on Form S-8 (Reg. No. 333-142436))(1) | |
| 10.9* | Purchased call option confirmation, dated November 18, 2005, between Sonic and Bank of America, N.A. (incorporated by reference to Exhibit 10.1 to the November 2005 Form 8-K). | |
| 10.10* | Purchased call option confirmation, dated November 18, 2005, between Sonic and JPMorgan Chase Bank, National Association (incorporated by reference to Exhibit 10.2 to the November 2005 Form 8-K). | |
| 10.11* | Warrant confirmation, dated November 18, 2005, between Sonic and Bank of America, N.A. (incorporated by reference to Exhibit 10.3 to the November 2005 Form 8-K). | |
| 10.12* | Warrant confirmation, dated November 18, 2005, between Sonic and JPMorgan Chase Bank, National Association (incorporated by reference to Exhibit 10.4 to the November 2005 Form 8-K). | |
| 10.13* | Employment Agreement dated January 30, 2006 between Sonic and Mr. David P. Cosper (incorporated by reference to Exhibit 10.1 to Sonic’s Quarterly Report on Form 10-Q for the quarter ended March 31, 2006 (the “March 2006 Form 10-Q”)).(1) | |
| 10.14* | Credit Agreement, dated as of February 17, 2006 (the “Credit Agreement”), among Sonic; the subsidiaries of Sonic named therein; Bank of America, N.A., as Administrative Agent, Lender and L/C Issuer; JPMorgan Chase Bank, N.A., as Syndication Agent and Lender, Toyota Motor Credit Corporation, as Documentation Agent and Lender; and BMW Financial Services NA, LLC, Carolina First Bank, Comerica Bank, Fifth Third Bank, General Electric Capital Corporation, KeyBank National Association, Nissan Motor Acceptance Corporation, Sovereign Bank, SunTrust Bank, Wachovia Bank, National Association and World Omni Financial Corp., each as a Lender and, collectively, the “Lenders” (incorporated by reference to Exhibit 10.2 to the March 2006 Form 10-Q). | |
58
| EXHIBIT NO. |
DESCRIPTION | |
| 10.15* | Promissory Note, dated February 17, 2006, executed by Sonic and the subsidiaries of Sonic named therein in favor of Bank of America, N.A., pursuant to the Credit Agreement (incorporated by reference to Exhibit 10.32 to the March 2006 Form 10-Q). | |
| 10.16* | Promissory Note, dated February 17, 2006, executed by Sonic and the subsidiaries of Sonic named therein in favor of JPMorgan Chase Bank, N.A., pursuant to the Credit Agreement (incorporated by reference to Exhibit 10.4 to the March 2006 Form 10-Q). | |
| 10.17* | Promissory Note, dated February 17, 2006, executed by Sonic and the subsidiaries of Sonic named therein in favor of Toyota Motor Credit Corporation pursuant to the Credit Agreement (incorporated by reference to Exhibit 10.5 to the March 2006 Form 10-Q). | |
| 10.18* | Promissory Note, dated February 17, 2006, executed by Sonic and the subsidiaries of Sonic named therein in favor of BMW Financial Services NA, LLC, pursuant to the Credit Agreement (incorporated by reference to Exhibit 10.6 to the March 2006 Form 10-Q). | |
| 10.19* | Promissory Note, dated February 17, 2006, executed by Sonic and the subsidiaries of Sonic named therein in favor of Carolina First Bank pursuant to the Credit Agreement (incorporated by reference to Exhibit 10.7 to the March 2006 Form 10-Q). | |
| 10.20* | Promissory Note, dated February 17, 2006, executed by Sonic and the subsidiaries of Sonic named therein in favor of Comerica Bank pursuant to the Credit Agreement (incorporated by reference to Exhibit 10.8 to the March 2006 Form 10-Q). | |
| 10.21* | Promissory Note, dated February 17, 2006, executed by Sonic and the subsidiaries of Sonic named therein in favor of Fifth Third Bank pursuant to the Credit Agreement (incorporated by reference to Exhibit 10.9 to the March 2006 Form 10-Q). | |
| 10.22* | Promissory Note, dated February 17, 2006, executed by Sonic and the subsidiaries of Sonic named therein in favor of General Electric Capital Corporation pursuant to the Credit Agreement (incorporated by reference to Exhibit 10.10 to the March 2006 Form 10-Q). | |
| 10.23* | Promissory Note, dated February 17, 2006, executed by Sonic and the subsidiaries of Sonic named therein in favor of KeyBank National Association pursuant to the Credit Agreement (incorporated by reference to Exhibit 10.11 to the March 2006 Form 10-Q). | |
| 10.24* | Promissory Note, dated February 17, 2006, executed by Sonic and the subsidiaries of Sonic named therein in favor of Nissan Motor Acceptance Corporation pursuant to the Credit Agreement (incorporated by reference to Exhibit 10.12 to the March 2006 Form 10-Q). | |
| 10.25* | Promissory Note, dated February 17, 2006, executed by Sonic and the subsidiaries of Sonic named therein in favor of Sovereign Bank pursuant to the Credit Agreement (incorporated by reference to Exhibit 10.13 to the March 2006 Form 10-Q). | |
| 10.26* | Promissory Note, dated February 17, 2006, executed by Sonic and the subsidiaries of Sonic named therein in favor of SunTrust Bank pursuant to the Credit Agreement (incorporated by reference to Exhibit 10.14 to the March 2006 Form 10-Q). | |
| 10.27* | Promissory Note, dated February 17, 2006, executed by Sonic and the subsidiaries of Sonic named therein in favor of Wachovia Bank, National Association, pursuant to the Credit Agreement (incorporated by reference to Exhibit 10.15 to the March 2006 Form 10-Q). | |
| 10.28* | Promissory Note, dated February 17, 2006, executed by Sonic and the subsidiaries of Sonic named therein in favor of World Omni Financial Corp. pursuant to the Credit Agreement (incorporated by reference to Exhibit 10.16 to the March 2006 Form 10-Q). | |
| 10.29* | Security Agreement, dated as of February 17, 2006, by Sonic, the subsidiaries of Sonic named therein and Bank of America, N.A., as Administrative Agent for the Lenders under the Credit Agreement (incorporated by reference to Exhibit 10.17 to the March 2006 Form 10-Q). | |
59
| EXHIBIT NO. |
DESCRIPTION | |
| 10.30* | Company Guaranty Agreement, dated as of February 17, 2006, by Sonic, as Guarantor, to Bank of America, N.A., as Administrative Agent for the Lenders under the Credit Agreement (incorporated by reference to Exhibit 10.18 to the March 2006 Form 10-Q). | |
| 10.31* | Subsidiary Guaranty Agreement, dated as of February 17, 2006, by the subsidiaries of Sonic named therein, as Guarantors, to Bank of America, N.A, as Administrative Agent for the Lenders under the Credit Agreement (incorporated by reference to Exhibit 10.19 to the March 2006 Form 10-Q). | |
| 10.32* | Securities Pledge Agreement, dated as of February 17, 2006, by Sonic, the subsidiaries of Sonic named therein and Bank of America, N.A., as Administrative Agent for the Lenders under the Credit Agreement (incorporated by reference to Exhibit 10.20 to the March 2006 Form 10-Q). | |
| 10.33* | Sonic Automotive, Inc. 2004 Stock Incentive Plan Form of Performance-Based Restricted Stock Unit Award Agreement.(1) | |
| 10.34* | Sonic Automotive, Inc. 2004 Stock Incentive Plan Form of Performance-Based Restricted Stock Award Agreement.(1) | |
| 10.35* | Amended and Restated Sonic Automotive, Inc. Incentive Compensation Plan, Amended and Restated as of April 19, 2007 (incorporated by reference to Exhibit 10.3 to the June 30, 2007 Form 10-Q).(1) | |
| 21.1 | Subsidiaries of Sonic. | |
| 23.1 | Consent of Deloitte & Touche LLP. | |
| 31.1 | Certification of Mr. David P. Cosper pursuant to Rule 13a-14(a). | |
| 31.2 | Certification of Mr. O. Bruton Smith pursuant to Rule 13a-14(a). | |
| 32.1 | Certification of Mr. David P. Cosper pursuant to 18 U.S.C. Section 1350, as adopted pursuant to Section 906 of the Sarbanes-Oxley Act of 2002. | |
| 32.2 | Certification of Mr. O. Bruton Smith pursuant to 18 U.S.C. Section 1350, as adopted pursuant to Section 906 of the Sarbanes-Oxley Act of 2002. | |
| * | Filed Previously |
| (1) | Indicates a management contract or compensatory plan or arrangement. |
60
Pursuant to the requirements of Section 13 or 15(d) of the Securities Exchange Act of 1934, the registrant has duly caused this report to be signed on its behalf by the undersigned, thereunto duly authorized.
| SONIC AUTOMOTIVE, INC. |
| BY /s/ DAVID P. COSPER |
| Mr. David P. Cosper |
| Chief Financial Officer |
| Date: February 29, 2008 |
Pursuant to the requirements of the Securities Exchange Act of 1934, this report has been signed below by the following persons on behalf of the registrant and in the capacities and on the dates indicated.
| Signature |
Title |
Date | ||
| /S/ O. BRUTON SMITH O. Bruton Smith |
Chairman, Chief Executive Officer (principal executive officer) and Director | February 29, 2008 | ||
| /S/ B. SCOTT SMITH B. Scott Smith |
President, Chief Strategic Officer and Director | February 29, 2008 | ||
| /S/ DAVID P. COSPER David P. Cosper |
Vice Chairman and Chief Financial Officer (principal financial officer and principal accounting officer) | February 29, 2008 | ||
| /S/ JEFFREY C. RACHOR Jeffrey C. Rachor |
Director | February 29, 2008 | ||
| /S/ WILLIAM R. BROOKS William R. Brooks |
Director | February 29, 2008 | ||
| /S/ WILLIAM P. BENTON William P. Benton |
Director | February 29, 2008 | ||
| /S/ WILLIAM I. BELK William I. Belk |
Director | February 29, 2008 | ||
| /S/ H. ROBERT HELLER H. Robert Heller |
Director | February 29, 2008 | ||
| /S/ ROBERT L. REWEY Robert L. Rewey |
Director | February 29, 2008 | ||
| /S/ VICTOR H. DOOLAN Victor H. Doolan |
Director | February 29, 2008 | ||
| /S/ DAVID C. VORHOFF David C. Vorhoff |
Director | February 29, 2008 | ||
61
| EXHIBIT NO. |
DESCRIPTION | |
| 3.1* | Amended and Restated Certificate of Incorporation of Sonic (incorporated by reference to Exhibit 3.1 to Sonic’s Registration Statement on Form S-1 (Reg. No. 333-33295) (the “Form S-1”)). | |
| 3.2* | Certificate of Amendment to Sonic’s Amended and Restated Certificate of Incorporation effective June 18, 1999 (incorporated by reference to Exhibit 3.2 to Sonic’s Annual Report on Form 10-K for the year ended December 31, 1999 (the “1999 Form 10-K”)). | |
| 3.3* | Certificate of Designation, Preferences and Rights of Class A Convertible Preferred Stock (incorporated by reference to Exhibit 4.1 to Sonic’s Quarterly Report on Form 10-Q for the quarter ended March 31, 1998). | |
| 3.4* | Amended and Restated Bylaws of Sonic (as amended February 9, 2006) (incorporated by reference to Exhibit 3.1 to Sonic’s Current Report on Form 8-K filed February 13, 2006)). | |
| 4.1* | Specimen Certificate representing Class A Common Stock (incorporated by reference to Exhibit 4.1 to the Form S-1) | |
| 4.3* | Form of 5.25% Convertible Senior Subordinated Note due 2009 (incorporated by reference to Exhibit 4.2 to Sonic’s Amended Current Report on Form 8-K/A filed on May 6, 2002 (the “May 2002 Form 8-K/A”)). | |
| 4.4* | Supplemental Indenture by and among Sonic and U.S. Bank National Association (incorporated by reference to Exhibit 4.1 to the May 2002 Form 8-K/A). | |
| 4.5* | Form of 8 5/8% Senior Subordinated Note due 2013, Series B (incorporated by reference to Exhibit 4.3 to Sonic’s Registration Statement on Form S-4 (Reg. Nos. 333-109426 and 333-109426-1 through 109426-261) (the “2003 Exchange Offer Form S-4”)). | |
| 4.6* | Indenture dated as of August 12, 2003 among Sonic Automotive, Inc., as issuer, the subsidiaries of Sonic named therein, as guarantors, and U.S. Bank National Association, as trustee (the “Trustee”), relating to the 8 5/8% Senior Subordinated Notes due 2013 (incorporated by reference to Exhibit 4.4 to the 2003 Exchange Offer Form S-4). | |
| 4.7* | Form of 4.25% Convertible Senior Subordinated Note due 2015 (incorporated by reference to Exhibit 4.2 to the November 2005 Form 8-K). | |
| 4.8* | Subordinated Indenture, dated as of May 7, 2002, among Sonic, the guarantors named there in and U.S. Bank National Association, as trustee (incorporated by reference to Exhibit 4.1 to Sonic’s Current Report on Form 8-K filed November 21, 2005). | |
| 4.9* | Second Supplemental Indenture dated as of November 23, 2005, between Sonic and U.S. Bank National Association (incorporated by reference to Exhibit 4.1 to the November 2005 Form 8-K). | |
| 10.1* | Sonic Automotive, Inc. 2004 Stock Incentive Plan, Amended and Restated as of February 13, 2007 (incorporated by reference to Exhibit 4 to Sonic’s Registration Statement on Form S-8 (Reg. No. 333-142435)) (1) | |
| 10.2* | Sonic Automotive, Inc. 1997 Stock Option Plan, Amended and Restated as of April 22, 2003 (incorporated by reference to Exhibit 10.10 to Sonic’s Quarterly Report on Form 10-Q for the quarter ended March 31, 2003). (1) | |
| 10.3* | Sonic Automotive, Inc. Employee Stock Purchase Plan, Amended and Restated as of May 8, 2002 (incorporated by reference to Exhibit 10.15 to the 2002 Annual Report).(1) | |
62
| EXHIBIT NO. |
DESCRIPTION | |
| 10.4* | Sonic Automotive, Inc. Nonqualified Employee Stock Purchase Plan, Amended and Restated as of October 23, 2002 (incorporated by reference to Exhibit 10.16 to the 2002 Annual Report).(1) | |
| 10.5* | FirstAmerica Automotive, Inc. 1997 Stock Option Plan, Amended and Restated as of December 10, 1999 (incorporated by reference to Exhibit 4.1 to Sonic’s Registration Statement on Form S-8 (Reg. No. 333-95791)).(1) | |
| 10.6* | Employment Agreement dated November 4, 2004 between Sonic and Jeffrey C. Rachor (incorporated by reference to Exhibit 10.24 to the 2004 Annual Report).(1) | |
| 10.7* | Employment Agreement dated December 27, 2004 between Sonic and Mark J. Iuppenlatz (incorporated by reference to Exhibit 10.26 to the 2004 Annual Report).(1) | |
| 10.8* | Sonic Automotive, Inc. 2005 Formula Restricted Stock Plan for Non-Employee Directors, Amended and Restated as of April 19, 2007 (incorporated by reference to Exhibit 4 to Sonic’s Registration Statement on Form S-8 (Reg. No. 333-142436))(1) | |
| 10.9* | Purchased call option confirmation, dated November 18, 2005, between Sonic and Bank of America, N.A. (incorporated by reference to Exhibit 10.1 to the November 2005 Form 8-K). | |
| 10.10* | Purchased call option confirmation, dated November 18, 2005, between Sonic and JPMorgan Chase Bank, National Association (incorporated by reference to Exhibit 10.2 to the November 2005 Form 8-K). | |
| 10.11* | Warrant confirmation, dated November 18, 2005, between Sonic and Bank of America, N.A. (incorporated by reference to Exhibit 10.3 to the November 2005 Form 8-K). | |
| 10.12* | Warrant confirmation, dated November 18, 2005, between Sonic and JPMorgan Chase Bank, National Association (incorporated by reference to Exhibit 10.4 to the November 2005 Form 8-K). | |
| 10.13* | Employment Agreement dated January 30, 2006 between Sonic and Mr. David P. Cosper (incorporated by reference to Exhibit 10.1 to Sonic’s Quarterly Report on Form 10-Q for the quarter ended March 31, 2006 (the “March 2006 Form 10-Q”)).(1) | |
| 10.14* | Credit Agreement, dated as of February 17, 2006 (the “Credit Agreement”), among Sonic; the subsidiaries of Sonic named therein; Bank of America, N.A., as Administrative Agent, Lender and L/C Issuer; JPMorgan Chase Bank, N.A., as Syndication Agent and Lender, Toyota Motor Credit Corporation, as Documentation Agent and Lender; and BMW Financial Services NA, LLC, Carolina First Bank, Comerica Bank, Fifth Third Bank, General Electric Capital Corporation, KeyBank National Association, Nissan Motor Acceptance Corporation, Sovereign Bank, SunTrust Bank, Wachovia Bank, National Association and World Omni Financial Corp., each as a Lender and, collectively, the “Lenders” (incorporated by reference to Exhibit 10.2 to the March 2006 Form 10-Q). | |
| 10.15* | Promissory Note, dated February 17, 2006, executed by Sonic and the subsidiaries of Sonic named therein in favor of Bank of America, N.A., pursuant to the Credit Agreement (incorporated by reference to Exhibit 10.32 to the March 2006 Form 10-Q). | |
| 10.16* | Promissory Note, dated February 17, 2006, executed by Sonic and the subsidiaries of Sonic named therein in favor of JPMorgan Chase Bank, N.A., pursuant to the Credit Agreement (incorporated by reference to Exhibit 10.4 to the March 2006 Form 10-Q). | |
| 10.17* | Promissory Note, dated February 17, 2006, executed by Sonic and the subsidiaries of Sonic named therein in favor of Toyota Motor Credit Corporation pursuant to the Credit Agreement (incorporated by reference to Exhibit 10.5 to the March 2006 Form 10-Q). | |
63
| EXHIBIT NO. |
DESCRIPTION | |
| 10.18* | Promissory Note, dated February 17, 2006, executed by Sonic and the subsidiaries of Sonic named therein in favor of BMW Financial Services NA, LLC, pursuant to the Credit Agreement (incorporated by reference to Exhibit 10.6 to the March 2006 Form 10-Q). | |
| 10.19* | Promissory Note, dated February 17, 2006, executed by Sonic and the subsidiaries of Sonic named therein in favor of Carolina First Bank pursuant to the Credit Agreement (incorporated by reference to Exhibit 10.7 to the March 2006 Form 10-Q). | |
| 10.20* | Promissory Note, dated February 17, 2006, executed by Sonic and the subsidiaries of Sonic named therein in favor of Comerica Bank pursuant to the Credit Agreement (incorporated by reference to Exhibit 10.8 to the March 2006 Form 10-Q). | |
| 10.21* | Promissory Note, dated February 17, 2006, executed by Sonic and the subsidiaries of Sonic named therein in favor of Fifth Third Bank pursuant to the Credit Agreement (incorporated by reference to Exhibit 10.9 to the March 2006 Form 10-Q). | |
| 10.22* | Promissory Note, dated February 17, 2006, executed by Sonic and the subsidiaries of Sonic named therein in favor of General Electric Capital Corporation pursuant to the Credit Agreement (incorporated by reference to Exhibit 10.10 to the March 2006 Form 10-Q). | |
| 10.23* | Promissory Note, dated February 17, 2006, executed by Sonic and the subsidiaries of Sonic named therein in favor of KeyBank National Association pursuant to the Credit Agreement (incorporated by reference to Exhibit 10.11 to the March 2006 Form 10-Q). | |
| 10.24* | Promissory Note, dated February 17, 2006, executed by Sonic and the subsidiaries of Sonic named therein in favor of Nissan Motor Acceptance Corporation pursuant to the Credit Agreement (incorporated by reference to Exhibit 10.12 to the March 2006 Form 10-Q). | |
| 10.25* | Promissory Note, dated February 17, 2006, executed by Sonic and the subsidiaries of Sonic named therein in favor of Sovereign Bank pursuant to the Credit Agreement (incorporated by reference to Exhibit 10.13 to the March 2006 Form 10-Q). | |
| 10.26* | Promissory Note, dated February 17, 2006, executed by Sonic and the subsidiaries of Sonic named therein in favor of SunTrust Bank pursuant to the Credit Agreement (incorporated by reference to Exhibit 10.14 to the March 2006 Form 10-Q). | |
| 10.27* | Promissory Note, dated February 17, 2006, executed by Sonic and the subsidiaries of Sonic named therein in favor of Wachovia Bank, National Association, pursuant to the Credit Agreement (incorporated by reference to Exhibit 10.15 to the March 2006 Form 10-Q). | |
| 10.28* | Promissory Note, dated February 17, 2006, executed by Sonic and the subsidiaries of Sonic named therein in favor of World Omni Financial Corp. pursuant to the Credit Agreement (incorporated by reference to Exhibit 10.16 to the March 2006 Form 10-Q). | |
| 10.29* | Security Agreement, dated as of February 17, 2006, by Sonic, the subsidiaries of Sonic named therein and Bank of America, N.A., as Administrative Agent for the Lenders under the Credit Agreement (incorporated by reference to Exhibit 10.17 to the March 2006 Form 10-Q). | |
| 10.30* | Company Guaranty Agreement, dated as of February 17, 2006, by Sonic, as Guarantor, to Bank of America, N.A., as Administrative Agent for the Lenders under the Credit Agreement (incorporated by reference to Exhibit 10.18 to the March 2006 Form 10-Q). | |
| 10.31* | Subsidiary Guaranty Agreement, dated as of February 17, 2006, by the subsidiaries of Sonic named therein, as Guarantors, to Bank of America, N.A, as Administrative Agent for the Lenders under the Credit Agreement (incorporated by reference to Exhibit 10.19 to the March 2006 Form 10-Q). | |
64
| EXHIBIT NO. |
DESCRIPTION | |
| 10.32* | Securities Pledge Agreement, dated as of February 17, 2006, by Sonic, the subsidiaries of Sonic named therein and Bank of America, N.A., as Administrative Agent for the Lenders under the Credit Agreement (incorporated by reference to Exhibit 10.20 to the March 2006 Form 10-Q). | |
| 10.33* | Sonic Automotive, Inc. 2004 Stock Incentive Plan Form of Performance-Based Restricted Stock Unit Award Agreement.(1) | |
| 10.34* | Sonic Automotive, Inc. 2004 Stock Incentive Plan Form of Performance-Based Restricted Stock Award Agreement.(1) | |
| 10.35* | Amended and Restated Sonic Automotive, Inc. Incentive Compensation Plan, Amended and Restated as of April 19, 2007 (incorporated by reference to Exhibit 10.3 to the June 30, 2007 Form 10-Q). (1) | |
| 21.1 | Subsidiaries of Sonic. | |
| 23.1 | Consent of Deloitte & Touche LLP. | |
| 31.1 | Certification of Mr. David P. Cosper pursuant to Rule 13a-14(a). | |
| 31.2 | Certification of Mr. O. Bruton Smith pursuant to Rule 13a-14(a). | |
| 32.1 | Certification of Mr. David P. Cosper pursuant to 18 U.S.C. Section 1350, as adopted pursuant to Section 906 of the Sarbanes-Oxley Act of 2002. | |
| 32.2 | Certification of Mr. O. Bruton Smith pursuant to 18 U.S.C. Section 1350, as adopted pursuant to Section 906 of the Sarbanes-Oxley Act of 2002. | |
| * | Filed Previously |
| (1) | Indicates a management contract or compensatory plan or arrangement. |
65
REPORT OF INDEPENDENT REGISTERED PUBLIC ACCOUNTING FIRM
To the Board of Directors and Stockholders of
Sonic Automotive, Inc.
Charlotte, North Carolina
We have audited the accompanying consolidated balance sheets of Sonic Automotive, Inc. and subsidiaries (the “Company”) as of December 31, 2006 and 2007, and the related consolidated statements of income, stockholders’ equity, and cash flows for each of the three years in the period ended December 31, 2007. These financial statements are the responsibility of the Company’s management. Our responsibility is to express an opinion on the financial statements based on our audits.
We conducted our audits in accordance with the standards of the Public Company Accounting Oversight Board (United States). Those standards require that we plan and perform the audit to obtain reasonable assurance about whether the financial statements are free of material misstatement. An audit includes examining, on a test basis, evidence supporting the amounts and disclosures in the financial statements. An audit also includes assessing the accounting principles used and significant estimates made by management, as well as evaluating the overall financial statement presentation. We believe that our audits provide a reasonable basis for our opinion.
In our opinion, such consolidated financial statements present fairly, in all material respects, the financial position of Sonic Automotive, Inc. and subsidiaries as of December 31, 2006 and 2007, and the results of their operations and their cash flows for each of the three years in the period ended December 31, 2007, in conformity with accounting principles generally accepted in the United States of America.
As discussed in Notes 1 and 7 to the consolidated financial statements, on January 1, 2007, the Company adopted FASB Interpretation No. 48 Accounting for Uncertainty in Income Taxes (FIN 48). As allowed in the year of adoption, the Company recorded a charge of $8.6 million to 2007 beginning retained earnings resulting from its initial application of the provisions of FIN 48. Also, as discussed in Note 1 to the consolidated financial statements, the Company applied the provisions of Securities and Exchange Commission Staff Accounting Bulletin No. 108, Considering the Effects of Prior Year Misstatements When Quantifying Misstatements in Current Year Financial Statements in 2006. In accordance with the transition provisions of SAB No. 108, the Company recorded a $4.6 million cumulative decrease, net of tax, to retained earnings as of January 1, 2006. As discussed in Note 10 to the consolidated financial statements, the Company changed its method of accounting for compensation expense for share-based awards to conform to Statement of Financial Accounting Standards No. 123(R), Share-Based Payment.
We have also audited, in accordance with the standards of the Public Company Accounting Oversight Board (United States), the Company’s internal control over financial reporting as of December 31, 2007, based on the criteria established in Internal Control—Integrated Framework issued by the Committee of Sponsoring Organizations of the Treadway Commission and our report dated February 29, 2008 expressed an unqualified opinion on the Company’s internal control over financial reporting.
/S/ DELOITTE & TOUCHE LLP
Charlotte, North Carolina
February 29, 2008
F-1
SONIC AUTOMOTIVE, INC. AND SUBSIDIARIES
CONSOLIDATED BALANCE SHEETS
December 31, 2006 and 2007
(Dollars in thousands)
| December 31, | ||||||||
| 2006 | 2007 | |||||||
| ASSETS | ||||||||
| Current Assets: |
||||||||
| Cash and cash equivalents |
$ | 12,696 | $ | 16,514 | ||||
| Receivables, net |
385,849 | 347,309 | ||||||
| Inventories |
991,984 | 1,093,017 | ||||||
| Assets held for sale |
160,571 | 87,342 | ||||||
| Construction in progress and land expected to be sold |
26,198 | 6,421 | ||||||
| Other current assets |
35,834 | 29,458 | ||||||
| Total current assets |
1,613,132 | 1,580,061 | ||||||
| Property and Equipment, net |
220,551 | 286,591 | ||||||
| Goodwill |
1,155,428 | 1,276,074 | ||||||
| Other Intangible Assets, net |
94,136 | 111,342 | ||||||
| Other Assets |
41,517 | 28,676 | ||||||
| Total Assets |
$ | 3,124,764 | $ | 3,282,744 | ||||
| LIABILITIES AND STOCKHOLDERS’ EQUITY | ||||||||
| Current Liabilities: |
||||||||
| Notes payable—floor plan—trade |
$ | 377,943 | $ | 298,376 | ||||
| Notes payable—floor plan—non-trade |
686,515 | 827,294 | ||||||
| Trade accounts payable |
68,016 | 66,026 | ||||||
| Accrued interest |
19,336 | 19,202 | ||||||
| Other accrued liabilities |
180,884 | 162,430 | ||||||
| Liabilities associated with assets held for sale—trade |
54,229 | 25,057 | ||||||
| Liabilities associated with assets held for sale—non-trade |
42,063 | 23,535 | ||||||
| Current maturities of long-term debt |
2,707 | 4,197 | ||||||
| Total current liabilities |
1,431,693 | 1,426,117 | ||||||
| Long-Term Debt |
598,627 | 697,800 | ||||||
| Other Long-Term Liabilities |
39,570 | 83,829 | ||||||
| Deferred Income Taxes |
151,034 | 144,170 | ||||||
| Commitments and Contingencies |
||||||||
| Stockholders’ Equity: |
||||||||
| Class A convertible preferred stock, none issued |
— | — | ||||||
| Class A common stock, $.01 par value; 100,000,000 shares authorized; 41,890,540 shares issued and 30,691,576 shares outstanding at December 31, 2006; 42,413,646 shares issued and 29,298,482 shares outstanding at December 31, 2007 |
416 | 424 | ||||||
| Class B common stock; $.01 par value; 30,000,000 shares authorized; 12,029,375 shares issued and outstanding at December 31, 2006 and December 31, 2007 |
121 | 121 | ||||||
| Paid-in capital |
464,011 | 488,983 | ||||||
| Retained earnings |
598,293 | 664,280 | ||||||
| Accumulated other comprehensive income |
— | (15,114 | ) | |||||
| Treasury stock, at cost (11,198,964 Class A shares held at December 31, 2006 and 13,115,164 Class A shares held at December 31, 2007) |
(159,001 | ) | (207,866 | ) | ||||
| Total stockholders’ equity |
903,840 | 930,828 | ||||||
| Total Liabilities and Stockholders’ Equity |
$ | 3,124,764 | $ | 3,282,744 | ||||
See notes to consolidated financial statements.
F-2
SONIC AUTOMOTIVE, INC. AND SUBSIDIARIES
CONSOLIDATED STATEMENTS OF INCOME
Years Ended December 31, 2005, 2006 and 2007
(Dollars and shares in thousands, except per share amounts)
| Year Ended December 31, | ||||||||||||
| 2005 | 2006 | 2007 | ||||||||||
| Revenues: |
||||||||||||
| New vehicles |
$ | 4,490,837 | $ | 4,898,507 | $ | 5,056,480 | ||||||
| Used vehicles |
1,135,873 | 1,281,887 | 1,449,537 | |||||||||
| Wholesale vehicles |
503,521 | 496,531 | 428,129 | |||||||||
| Total vehicles |
6,130,231 | 6,676,925 | 6,934,146 | |||||||||
| Parts, service and collision repair |
1,008,506 | 1,118,366 | 1,191,347 | |||||||||
| Finance, insurance and other |
180,063 | 189,788 | 211,440 | |||||||||
| Total revenues |
7,318,800 | 7,985,079 | 8,336,933 | |||||||||
| Cost of Sales: |
||||||||||||
| New vehicles |
4,162,577 | 4,540,454 | 4,705,691 | |||||||||
| Used vehicles |
1,022,257 | 1,158,851 | 1,319,098 | |||||||||
| Wholesale vehicles |
503,198 | 499,314 | 430,970 | |||||||||
| Total vehicles |
5,688,032 | 6,198,619 | 6,455,759 | |||||||||
| Parts, service and collision repair |
513,597 | 558,169 | 589,589 | |||||||||
| Total cost of sales |
6,201,629 | 6,756,788 | 7,045,348 | |||||||||
| Gross profit |
1,117,171 | 1,228,291 | 1,291,585 | |||||||||
| Selling, general and administrative expenses |
852,740 | 942,890 | 967,706 | |||||||||
| Depreciation and amortization |
18,742 | 23,248 | 27,306 | |||||||||
| Operating income |
245,689 | 262,153 | 296,573 | |||||||||
| Other income / (expense): |
||||||||||||
| Interest expense, floor plan |
(35,543 | ) | (59,580 | ) | (67,638 | ) | ||||||
| Interest expense, other, net |
(42,017 | ) | (39,662 | ) | (39,795 | ) | ||||||
| Other income / (expense), net |
46 | (589 | ) | 73 | ||||||||
| Total other expense |
(77,514 | ) | (99,831 | ) | (107,360 | ) | ||||||
| Income from continuing operations before taxes |
168,175 | 162,322 | 189,213 | |||||||||
| Provision for income taxes |
62,462 | 65,490 | 74,377 | |||||||||
| Income from continuing operations |
105,713 | 96,832 | 114,836 | |||||||||
| Discontinued operations: |
||||||||||||
| Loss from operations and the sale of discontinued franchises |
(17,433 | ) | (23,054 | ) | (26,585 | ) | ||||||
| Income tax benefit |
3,581 | 7,339 | 7,251 | |||||||||
| Loss from discontinued operations |
(13,852 | ) | (15,715 | ) | (19,334 | ) | ||||||
| Net income |
$ | 91,861 | $ | 81,117 | $ | 95,502 | ||||||
| Basic earnings (loss) per share: |
||||||||||||
| Earnings per share from continuing operations |
$ | 2.53 | $ | 2.29 | $ | 2.70 | ||||||
| Loss per share from discontinued operations |
(0.33 | ) | (0.37 | ) | (0.45 | ) | ||||||
| Earnings per share |
$ | 2.20 | $ | 1.92 | $ | 2.25 | ||||||
| Weighted average common shares outstanding |
41,817 | 42,336 | 42,479 | |||||||||
| Diluted earnings (loss) per share: |
||||||||||||
| Earnings per share from continuing operations |
$ | 2.42 | $ | 2.18 | $ | 2.54 | ||||||
| Loss per share from discontinued operations |
(0.30 | ) | (0.33 | ) | (0.41 | ) | ||||||
| Earnings per share |
$ | 2.12 | $ | 1.85 | $ | 2.13 | ||||||
| Weighted average common shares outstanding |
45,533 | 46,265 | 46,941 | |||||||||
| Dividends declared per common share |
$ | 0.48 | $ | 0.48 | $ | 0.48 | ||||||
See notes to consolidated financial statements
F-3
SONIC AUTOMOTIVE, INC. AND SUBSIDIARIES
CONSOLIDATED STATEMENTS OF STOCKHOLDERS’ EQUITY
Years Ended December 31, 2005, 2006 and 2007
(Dollars and shares in thousands)
| Class A Common Stock |
Class B Common Stock |
Deferred Compensation Related to Restricted Stock |
Paid-In Capital |
Retained Earnings |
Treasury Stock |
Accumulated Other Comprehensive (Loss)/Income |
Total Stockholders’ Equity |
Compre- hensive Income |
||||||||||||||||||||||||||||||||
| Shares | Amount | Shares | Amount | |||||||||||||||||||||||||||||||||||||
| BALANCE AT DECEMBER 31, 2004 |
39,980 | $ | 397 | 12,029 | $ | 121 | $ | (3,408 | ) | $ | 441,503 | $ | 470,663 | $ | (138,361 | ) | $ | (1,228 | ) | $ | 769,687 | $ | 89,262 | |||||||||||||||||
| Shares awarded under stock compensation plans |
631 | 7 | — | — | (651 | ) | 9,873 | — | — | — | 9,229 | — | ||||||||||||||||||||||||||||
| Stock-based compensation—stock options |
— | — | — | — | — | 114 | — | — | — | 114 | — | |||||||||||||||||||||||||||||
| Purchases of treasury stock |
— | — | — | — | — | — | — | (5,584 | ) | — | (5,584 | ) | — | |||||||||||||||||||||||||||
| Income tax benefit associated with stock compensation plans |
— | — | — | — | — | 1,504 | — | — | — | 1,504 | — | |||||||||||||||||||||||||||||
| Income tax benefit associated with convertible note hedge |
— | — | — | — | — | 175 | — | — | — | 175 | — | |||||||||||||||||||||||||||||
| Fair value of interest rate swap agreements, net of tax expense of $798 |
— | — | — | — | — | — | — | — | 1,248 | 1,248 | 1,248 | |||||||||||||||||||||||||||||
| Restricted stock amortization |
— | — | — | — | 1,485 | — | — | — | 1,485 | — | ||||||||||||||||||||||||||||||
| Restricted stock forfeiture |
(50 | ) | (1 | ) | — | — | 745 | (1,055 | ) | — | — | — | (311 | ) | — | |||||||||||||||||||||||||
| Purchase of convertible note hedge and warrants, net |
— | — | — | — | — | (18,460 | ) | — | — | — | (18,460 | ) | — | |||||||||||||||||||||||||||
| Net income |
— | — | — | — | — | — | 91,861 | — | — | 91,861 | 91,861 | |||||||||||||||||||||||||||||
| Dividends ($0.48 per share) |
— | — | — | — | — | — | (20,150 | ) | — | — | (20,150 | ) | — | |||||||||||||||||||||||||||
| BALANCE AT DECEMBER 31, 2005 |
40,561 | $ | 403 | 12,029 | $ | 121 | $ | (1,829 | ) | $ | 433,654 | $ | 542,374 | $ | (143,945 | ) | $ | 20 | $ | 830,798 | $ | 93,109 | ||||||||||||||||||
| Adoption of SAB 108 |
— | — | — | — | — | — | (4,607 | ) | — | — | (4,607 | ) | — | |||||||||||||||||||||||||||
| Adoption of SFAS No. 123-R |
— | — | — | — | 1,829 | (1,829 | ) | — | — | — | — | — | ||||||||||||||||||||||||||||
| Shares awarded under stock compensation plans |
1,329 | 13 | — | — | — | 19,226 | — | — | — | 19,239 | — | |||||||||||||||||||||||||||||
| Purchases of treasury stock |
— | — | — | — | — | — | — | (15,056 | ) | — | (15,056 | ) | — | |||||||||||||||||||||||||||
| Income tax benefit associated with stock compensation plans |
— | — | — | — | — | 4,396 | — | — | — | 4,396 | — | |||||||||||||||||||||||||||||
| Income tax benefit associated with convertible note hedge |
— | — | — | — | — | 1,762 | — | — | — | 1,762 | — | |||||||||||||||||||||||||||||
| Fair value of interest rate swap agreements, net of tax benefit of $13 |
— | — | — | — | — | — | — | — | (20 | ) | (20 | ) | (20 | ) | ||||||||||||||||||||||||||
| Stock-based compensation expense |
4,511 | 4,511 | ||||||||||||||||||||||||||||||||||||||
| Restricted stock amortization |
— | — | — | — | 2,291 | — | — | — | 2,291 | — | ||||||||||||||||||||||||||||||
| Net income |
— | — | — | — | — | — | 81,117 | — | — | 81,117 | 81,117 | |||||||||||||||||||||||||||||
| Dividends ($0.48 per share) |
— | — | — | — | — | — | (20,591 | ) | — | — | (20,591 | ) | — | |||||||||||||||||||||||||||
| BALANCE AT DECEMBER 31, 2006 |
41,890 | $ | 416 | 12,029 | $ | 121 | $ | — | $ | 464,011 | $ | 598,293 | $ | (159,001 | ) | $ | — | $ | 903,840 | $ | 81,097 | |||||||||||||||||||
| Adoption of FIN 48 |
— | — | — | — | — | (8,582 | ) | — | — | (8,582 | ) | — | ||||||||||||||||||||||||||||
| Shares awarded under stock compensation plans |
524 | 8 | — | — | — | 13,436 | — | — | — | 13,444 | — | |||||||||||||||||||||||||||||
| Purchases of treasury stock |
— | — | — | — | — | — | — | (48,865 | ) | — | (48,865 | ) | — | |||||||||||||||||||||||||||
| Income tax benefit associated with stock compensation plans |
— | — | — | — | — | 3,147 | — | — | — | 3,147 | — | |||||||||||||||||||||||||||||
| Income tax benefit associated with convertible note hedge |
— | — | — | — | — | 1,914 | — | — | — | 1,914 | — | |||||||||||||||||||||||||||||
| Fair value of interest rate swap agreements, net of tax benefit of $9,071 |
— | — | — | — | — | — | — | — | (14,800 | ) | (14,800 | ) | (14,800 | ) | ||||||||||||||||||||||||||
| Unrealized loss on available-for-sale securities, net of tax benefit of $193 |
— | — | — | — | — | — | — | — | (314 | ) | (314 | ) | (314 | ) | ||||||||||||||||||||||||||
| Stock-based compensation expense |
5,589 | 5,589 | ||||||||||||||||||||||||||||||||||||||
| Restricted stock amortization |
— | — | — | — | 886 | — | — | 886 | — | |||||||||||||||||||||||||||||||
| Net income |
— | — | — | — | — | — | 95,502 | — | — | 95,502 | 95,502 | |||||||||||||||||||||||||||||
| Dividends ($0.48 per share) |
— | — | — | — | — | — | (20,933 | ) | — | — | (20,933 | ) | — | |||||||||||||||||||||||||||
| BALANCE AT DECEMBER 31, 2007 |
42,414 | $ | 424 | 12,029 | $ | 121 | $ | — | $ | 488,983 | $ | 664,280 | $ | (207,866 | ) | $ | (15,114 | ) | $ | 930,828 | $ | 80,388 | ||||||||||||||||||
See notes to consolidated financial statements
F-4
SONIC AUTOMOTIVE, INC. AND SUBSIDIARIES
CONSOLIDATED STATEMENTS OF CASH FLOWS
(Dollars in thousands)
| Years Ended December 31, | ||||||||||||
| 2005 | 2006 | 2007 | ||||||||||
| CASH FLOWS FROM OPERATING ACTIVITIES: |
||||||||||||
| Net income |
$ | 91,861 | $ | 81,117 | $ | 95,502 | ||||||
| Adjustments to reconcile net income to net cash provided by operating activities: |
||||||||||||
| Depreciation and amortization of property, plant and equipment |
21,982 | 23,903 | 27,438 | |||||||||
| Provision for bad debt expense |
13,078 | 9,210 | 3,169 | |||||||||
| Other amortization |
309 | 715 | 1,156 | |||||||||
| Debt issuance cost amortization |
401 | 1,054 | 1,147 | |||||||||
| Debt discount amortization, net of premium amortization |
77 | 691 | 807 | |||||||||
| Stock—based compensation expense |
114 | 4,511 | 5,589 | |||||||||
| Amortization of restricted stock |
1,485 | 2,291 | 3,313 | |||||||||
| Restricted stock forfeiture |
(311 | ) | — | (2,427 | ) | |||||||
| Deferred income taxes |
30,731 | 10,572 | 24,028 | |||||||||
| Equity interest in earnings of investees |
(819 | ) | (915 | ) | (645 | ) | ||||||
| Impairment of franchise agreements |
— | 2,525 | 3,100 | |||||||||
| Impairment of property and equipment |
1,950 | 10,988 | 2,932 | |||||||||
| (Gain)/Loss on disposal of franchises and property and equipment |
6 | (3,582 | ) | 1,145 | ||||||||
| Loss on exit of leased dealerships |
649 | 9,598 | 2,275 | |||||||||
| Changes in assets and liabilities that relate to operations: |
||||||||||||
| Receivables |
(49,770 | ) | 1,472 | 18,753 | ||||||||
| Inventories |
36,123 | (20,049 | ) | (17,003 | ) | |||||||
| Other assets |
(17,589 | ) | 15,079 | (18,093 | ) | |||||||
| Notes payable—floor plan—trade |
(40,535 | ) | (192,803 | ) | (108,739 | ) | ||||||
| Trade accounts payable and other liabilities |
(5,661 | ) | (18,241 | ) | (9,396 | ) | ||||||
| Total adjustments |
(7,780 | ) | (142,981 | ) | (61,451 | ) | ||||||
| Net cash provided by/(used in) operating activities |
84,081 | (61,864 | ) | 34,051 | ||||||||
| CASH FLOWS FROM INVESTING ACTIVITIES: |
||||||||||||
| Purchase of businesses, net of cash acquired |
(138,760 | ) | (110,371 | ) | (212,472 | ) | ||||||
| Purchases of property and equipment |
(81,638 | ) | (99,848 | ) | (78,295 | ) | ||||||
| Proceeds from sales of property and equipment |
26,435 | 40,698 | 31,369 | |||||||||
| Proceeds from sale of franchises |
61,572 | 50,961 | 62,882 | |||||||||
| Distributions from equity investees |
500 | 600 | 900 | |||||||||
| Net cash used in investing activities |
(131,891 | ) | (117,960 | ) | (195,616 | ) | ||||||
| CASH FLOWS FROM FINANCING ACTIVITIES: |
||||||||||||
| Net borrowings on notes payable floor plan—non-trade |
32,060 | 311,344 | 122,251 | |||||||||
| Borrowings on revolving credit facilities |
671,776 | 849,758 | 1,057,915 | |||||||||
| Repayments on revolving credit facilities |
(778,663 | ) | (961,418 | ) | (1,008,001 | ) | ||||||
| Proceeds from long-term debt |
156,159 | — | 46,667 | |||||||||
| Debt issuance costs |
(640 | ) | (2,776 | ) | — | |||||||
| Purchase of convertible note hedge and warrants, net |
(18,460 | ) | — | — | ||||||||
| Payments on long-term debt |
(2,094 | ) | (1,889 | ) | (2,158 | ) | ||||||
| Purchases of treasury stock |
(5,584 | ) | (15,056 | ) | (48,865 | ) | ||||||
| Income tax benefit associated with stock compensation plans |
1,504 | 4,396 | 3,147 | |||||||||
| Income tax benefit associated with convertible hedge |
175 | 1,762 | 1,914 | |||||||||
| Issuance of shares under stock compensation plans |
9,229 | 19,239 | 13,444 | |||||||||
| Dividends paid |
(20,077 | ) | (20,406 | ) | (20,931 | ) | ||||||
| Net cash provided by financing activities |
45,385 | 184,954 | 165,383 | |||||||||
| NET (DECREASE) / INCREASE IN CASH AND CASH EQUIVALENTS |
(2,425 | ) | 5,130 | 3,818 | ||||||||
| CASH AND CASH EQUIVALENTS, BEGINNING OF YEAR |
9,991 | 7,566 | 12,696 | |||||||||
| CASH AND CASH EQUIVALENTS, END OF YEAR |
$ | 7,566 | $ | 12,696 | $ | 16,514 | ||||||
| SUPPLEMENTAL SCHEDULE OF NON-CASH INVESTING ACTIVITIES: |
||||||||||||
| Change in accrual for purchases of property and equipment |
$ | 514 | $ | (598 | ) | $ | (568 | ) | ||||
| Adoption of SAB 108 |
$ | — | $ | (4,607 | ) | $ | — | |||||
| Adoption of FIN 48 |
$ | — | $ | — | $ | (8,582 | ) | |||||
| SUPPLEMENTAL SCHEDULE OF NON-CASH FINANCING ACTIVITIES: |
||||||||||||
| Restricted stock issuance |
$ | 651 | $ | 4,118 | $ | 9,678 | ||||||
| Change in fair value of cash flow hedging instruments (net of tax expense/(benefit) of $798, $(13) and $(9,071) in 2005, 2006 and 2007, respectively) |
$ | 1,248 | $ | (20 | ) | $ | (14,800 | ) | ||||
| SUPPLEMENTAL DISCLOSURES OF CASH FLOW INFORMATION: |
||||||||||||
| Cash paid during the year for: |
||||||||||||
| Interest, net of amount capitalized |
$ | 91,853 | $ | 114,538 | $ | 113,834 | ||||||
| Income taxes |
$ | 30,434 | $ | 46,329 | $ | 46,683 | ||||||
See notes to consolidated financial statements
F-5
SONIC AUTOMOTIVE, INC. AND SUBSIDIARIES
NOTES TO CONSOLIDATED FINANCIAL STATEMENTS
(All tables in thousands except per share amounts)
| 1. | DESCRIPTION OF BUSINESS AND SUMMARY OF SIGNIFICANT ACCOUNTING POLICIES |
Organization and Business—Sonic Automotive, Inc. (“Sonic” or the “Company”) is one of the largest automotive retailers in the United States (as measured by total revenue), operating 169 dealership franchises and 34 collision repair centers throughout the United States as of December 31, 2007. Sonic sells new and used cars and light trucks, sells replacement parts, provides vehicle maintenance, warranty, paint and repair services, and arranges related financing and insurance for its automotive customers. As of December 31, 2007, Sonic sold a total of 33 foreign and domestic brands of new vehicles.
Principles of Consolidation—All of Sonic’s dealership and non-dealership subsidiaries are wholly owned and consolidated in the accompanying Consolidated Financial Statements except for one fifty-percent owned dealership that is accounted for under the equity method in accordance with Accounting Principles Board Opinion No. 18, “The Equity Method of Accounting for Investments in Common Stock”. All material intercompany balances and transactions have been eliminated in the accompanying Consolidated Financial Statements.
Reclassifications—In accordance with Statement of Financial Accounting Standards (“SFAS”) No. 144, “Accounting for the Impairment or Disposal of Long-Lived Assets”, individual franchises sold, terminated or classified as held for sale are required to be reported as discontinued operations. During 2007, Sonic completed the disposal of 12 automobile franchises, and had approved, but not yet completed, the disposition of 20 additional franchises. In accordance with the provisions of SFAS No. 144, the results of operations of these franchises for the years ended December 31, 2005, 2006 and 2007 are reported as discontinued operations for all periods presented. Many of the provisions of SFAS No. 144 involve judgment in determining whether a franchise will be reported as continuing or discontinued operations. Such judgments include whether a franchise will be sold or terminated, the period required to complete the disposition and the likelihood of changes to a plan for sale. If in future periods Sonic determines that a franchise should be either reclassified from continuing operations to discontinued operations or from discontinued operations to continuing operations, previously reported Consolidated Statements of Income are reclassified in order to reflect the current classification.
Recent Accounting Pronouncements—In September 2006, the Securities and Exchange Commission issued Staff Accounting Bulletin No. 108, “Considering the Effects of Prior Year Misstatements when Quantifying Misstatements in Current Year Financial Statements” (“SAB 108”), which provides interpretive guidance on the consideration of the effects of prior year misstatements in quantifying current year misstatements for the purpose of a materiality assessment. In years prior to 2006, Sonic used the “rollover” method as described in SAB 108 in evaluating the effect of misstatements in its financial statements. Based on utilizing the “rollover” method in prior years, Sonic had determined that certain balance sheet misstatements were not material to its overall financial statement presentation. These misstatements relate to the recorded amount of accruals pertaining to bonuses, professional services and vacation obligations. The misstatements resulted from Sonic’s policy of expensing bonuses and vacation obligations. A portion of the misstatements resulted from Sonic’s policy of expensing bonuses in the period the items were paid rather than in the period they became payable and thus understated accrued liabilities and overstated retained earnings. This accounted for approximately $0.7 million of the after-tax charge to beginning retained earnings as described below. In addition, prior to 2004, Sonic had accrued for the vested vacation earned by its associates in the prior period but did not accrue for the vacation earned in the current period which had not yet vested. The result was an understatement of accrued liabilities and an overstatement of retained earnings. This accounted for $3.9 million of the after-tax charge to retained earnings described below. Each of the misstatements originated in years prior to 2004. Sonic evaluated the effect of these misstatements under both the “rollover method” and the “iron curtain” method in 2006 as prescribed by SAB 108. As a result of this evaluation, Sonic determined that although these misstatements continued to be
F-6
SONIC AUTOMOTIVE, INC. AND SUBSIDIARIES
NOTES TO CONSOLIDATED FINANCIAL STATEMENTS—(Continued)
immaterial under the “rollover” method, the misstatements were material to the financial statements when measured under the “iron curtain” method. As allowed in the initial year of adoption, Sonic has corrected the misstatements in 2006 with a charge to 2006 beginning retained earnings of approximately $4.6 million, net of associated taxes of $2.8 million, with offsets increasing other accrued liabilities by $7.4 million.
In June 2006, the Financial Accounting Standards Board (“FASB”) issued FASB Interpretation (“FIN”) No. 48, “Accounting for Uncertainty in Income Taxes”. FIN No. 48 prescribes financial statement recognition and measurement criteria for a tax position taken or expected to be taken in a tax return. See Note 7, Income Taxes, for discussion.
In September 2006, the FASB issued SFAS No. 157, “Fair Value Measures” (“SFAS 157”). SFAS No. 157 defines fair value, establishes a framework for measuring fair value and enhances disclosures about fair value measures required under other accounting pronouncements, but does not change existing guidance as to whether or not an instrument is carried at fair value. SFAS No. 157 is effective for fiscal years beginning after November 15, 2007, the year beginning January 1, 2008 for Sonic. Sonic is currently reviewing the provisions of SFAS No. 157 to determine the impact on its consolidated operating results, financial position and cash flows.
In February 2007, the FASB issued Statements of Financial Accounting Standards (“SFAS”) No. 159, “The Fair Value Option for Financial Assets and Financial Liabilities”. SFAS No. 159 permits entities to choose to measure eligible items at fair value at specified election dates and report unrealized gains and losses on items for which the fair value option has been elected in earnings at each subsequent reporting date. SFAS No. 159 is effective for fiscal years beginning after November 15, 2007. Sonic is currently reviewing the provisions of SFAS No. 159 to determine the impact on its consolidated operating results, financial position and cash flows.
In December 2007, the FASB issued SFAS No. 141(R), “Business Combinations” (SFAS 141(R)). SFAS No. 141(R) provides guidance regarding the allocation of purchase price in business combinations, measurement of assets acquired and liabilities assumed as well as other intangible assets acquired. Also in December 2007, the FASB issued SFAS No. 160, “Noncontrolling Interests in Consolidated Financial Statements (SFAS 160). SFAS 160 provides accounting and reporting standards for a noncontrolling interest in a subsidiary and for the deconsolidation of a subsidiary if certain conditions exist. SFAS 141(R) and SFAS 160 are effective for fiscal years beginning on or after December 15, 2008. Early adoption is prohibited. Sonic is currently reviewing the provisions of SFAS 141(R) and SFAS 160 and have not yet determined the impact of these statements on its consolidated operating results, financial position and cash flows.
Use of Estimates—The preparation of financial statements in conformity with accounting principles generally accepted in the United States of America requires Sonic’s management to make estimates and assumptions that affect the reported amounts of assets and liabilities and disclosure of contingent assets and liabilities at the date of the consolidated financial statements and the reported amounts of revenues and expenses during the reporting period. Actual results could differ from those estimates particularly related to allowance for credit loss, realization of inventory, intangible asset and deferred tax asset values, reserves for tax contingencies, legal matters, reserves for future chargebacks, results reported as continuing and discontinued operations, insurance reserves and certain accrued expenses.
Cash and Cash Equivalents—Sonic classifies cash and all highly liquid investments with a maturity of three months or less at the date of purchase, including short-term time deposits and government agency and corporate obligations, as cash and cash equivalents.
Revenue Recognition—Sonic records revenue when vehicles are delivered to customers, when vehicle service work is performed and when parts are delivered.
F-7
SONIC AUTOMOTIVE, INC. AND SUBSIDIARIES
NOTES TO CONSOLIDATED FINANCIAL STATEMENTS—(Continued)
Sonic arranges financing for customers through various financial institutions and receives a commission from the financial institution either in a flat fee amount or in an amount equal to the difference between the interest rates charged to customers over the predetermined interest rates set by the financial institution. Sonic also receives commissions from the sale of various insurance contracts to customers. Sonic may be assessed a chargeback fee in the event of early cancellation of a loan or insurance contract by the customer. Finance and insurance commission revenue is recorded net of estimated chargebacks at the time the related contract is placed with the financial institution.
Sonic also receives commissions from the sale of non-recourse third party extended service contracts to customers. Under these contracts, the applicable manufacturer or third party warranty company is directly liable for all warranties provided within the contract. Commission revenue from the sale of these third party extended service contracts is recorded net of estimated chargebacks at the time of sale. As of December 31, 2006 and 2007, the amounts recorded as allowances for commission chargeback reserves were $15.1 million and $13.0 million, respectively. The majority of these amounts recorded as allowances for commission chargeback reserves were classified in the accompanying Consolidated Financial Statements as other accrued liabilities and the remaining amount was classified as other long-term liabilities.
Floor Plan Assistance—Sonic receives floor plan assistance payments from certain manufacturers. This assistance reduces the carrying value of Sonic’s new vehicle inventory and is recognized as a reduction of cost of sales at the time the vehicle is sold. Amounts included in cost of sales were $33.7 million, $37.0 million and $36.7 million for the years ended December 31, 2005, 2006 and 2007, respectively. There was an additional $7.2 million, $5.2 million and $3.7 million in floor plan assistance related to discontinued operations for the years ended December 31, 2005, 2006 and 2007, respectively.
Contracts in Transit—Contracts in transit represent customer finance contracts evidencing loan agreements or lease agreements between Sonic, as creditor, and the customer, as borrower, to acquire or lease a vehicle in situations where a third-party finance source has given Sonic initial, non-binding approval to assume Sonic’s position as creditor. Funding and final approval from the finance source is provided upon the finance source’s review of the loan or lease agreement and related documentation executed by the customer at the dealership. These finance contracts are typically funded within ten days of the initial approval of the finance transaction given by the third-party finance source. The finance source is not contractually obligated to make the loan or lease to the customer until it gives its final approval and funds the transaction, and until such final approval is given, the contracts in transit represent amounts due from the customer to Sonic. Contracts in transit are included in receivables on the accompanying Consolidated Balance Sheets and totaled $171.2 million at December 31, 2006 and $166.1 million at December 31, 2007.
Accounts Receivable—In addition to contracts in transit, Sonic’s accounts receivable consist of amounts due from the manufacturers for repair services performed on vehicles with a remaining factory warranty and amounts due from third parties from the sale of parts. Sonic believes that there is a minimal risk of uncollectability on warranty receivables. Sonic evaluates parts and other receivables for collectability based on the age of the receivable, the credit history of the customer and past collection experience. The allowance for doubtful accounts receivable is not significant.
Inventories—Inventories of new, recorded net of manufacturer credits, and used vehicles, including demonstrators, are stated at the lower of specific cost or market. Inventories of parts and accessories are accounted for using the “first-in, first-out” (“FIFO”) method of inventory accounting and are stated at the lower of FIFO cost or market. Other inventories are primarily service loaner vehicles and, to a lesser extent, vehicle chassis, other supplies and capitalized customer work-in-progress (open customer vehicle repair orders). Other inventories are stated at the lower of specific cost (depreciated cost for service loaner vehicles) or market.
F-8
SONIC AUTOMOTIVE, INC. AND SUBSIDIARIES
NOTES TO CONSOLIDATED FINANCIAL STATEMENTS—(Continued)
Sonic assesses the valuation of all of its vehicle and parts inventories and maintains a reserve where the cost basis exceeds the fair market value. In making this assessment for new vehicles, Sonic primarily considers the age of the vehicles along with the timing of annual and model changeovers. For used vehicles, Sonic considers recent market data and trends such as loss histories along with the current age of the inventory. Parts inventories are primarily assessed considering excess quantity and continued usefulness of the part. The risk with parts inventories is minimized by the fact that excess or obsolete parts can generally be returned to the manufacturer.
Property and Equipment—Property and equipment are stated at cost. Depreciation and amortization is computed using the straight-line method over the estimated useful lives of the assets. Sonic amortizes leasehold improvements over the shorter of the estimated useful life or the remaining lease life. This lease life includes renewal options if a renewal has been determined to be reasonably assured. The range of estimated useful lives is as follows:
| Leasehold and land improvements |
10-30 years | |
| Buildings. |
10-30 years | |
| Parts and service equipment. |
7-10 years | |
| Office equipment and fixtures. |
3-10 years | |
| Company vehicles |
3-5 years |
Sonic reviews the carrying value of property and equipment and other long-term assets (other than goodwill and franchise assets) for impairment whenever events or changes in circumstances indicate that the carrying value may not be recoverable. If such an indication is present, Sonic compares the carrying amount of the asset to the estimated undiscounted cash flows related to those assets. Sonic concludes that an asset is impaired if the sum of such expected future cash flows is less than the carrying amount of the related asset. If Sonic determines an asset is impaired, the impairment loss would be the amount by which the carrying amount of the related asset exceeds its fair value. The fair value of the asset would be determined based on the quoted market prices, if available. If quoted market prices are not available, Sonic determines fair value by using a discounted cash flow model.
Impairment expense related to property and equipment of $0.9 million was recorded in selling, general and administrative expenses during the year ended December 31, 2007. This impairment expense was related to the abandonment of construction projects and the abandonment and disposal of dealership equipment. Additional property and equipment impairment charges of $2.0 million were recorded during 2007 in discontinued operations. This impairment expense was recorded based on the estimated fair value of the property and equipment to be sold in connection with the disposal of the associated franchises and recorded balances.
In 2006, property and equipment impairment charges totaling $3.6 million was recorded in selling, general and administrative expenses. This impairment expense was related to decisions to abandon several construction projects and current market information which indicated that the fair value of land parcels held for sale was less than the recorded value. Additional property and equipment impairment charges of $7.4 million were recorded during 2006 in discontinued operations. This impairment expense was recorded based on the estimated fair value of the property and equipment to be sold in connection with the disposal of the associated franchises and recorded balances.
In 2005, property and equipment impairment charges totaling $1.2 million were recorded in continuing operations (selling, general and administrative expenses) relating to the abandonment of construction projects and the abandonment and disposal of dealership equipment. These construction project impairment charges were recorded in connection with the decision to abandon the construction projects. The dealership equipment
F-9
SONIC AUTOMOTIVE, INC. AND SUBSIDIARIES
NOTES TO CONSOLIDATED FINANCIAL STATEMENTS—(Continued)
impairment charges were recorded in connection with the decision to downsize certain wholesale parts operations. Additional property and equipment impairment charges of $1.4 million were recorded during 2005 in discontinued operations relating to the abandonment of construction projects and the write-down of leasehold improvements for franchises classified as assets held for sale. The construction projects were abandoned in connection with the decision to sell the related franchises. The impairment charge for leasehold improvements relates to the difference between the discounted cash flows of sublease receipts for property where the leasehold improvements reside and the carrying value of the leasehold improvements. An impairment charge for the leasehold improvements was recorded when it was determined that Sonic would not recover the carrying value of the leasehold improvements when considering the lease costs net of sublease receipts.
Derivative Instruments and Hedging Activities—Sonic utilizes derivative financial instruments for the purpose of hedging the risks of certain identifiable and anticipated transactions and the fair value of certain obligations classified as long-term debt on the accompanying Consolidated Balance Sheets. In general, the types of risks being hedged are those relating to the variability of cash flows, the delivery of Sonic’s Class A common stock in connection with the conversion of convertible debt and long-term debt fair values caused by fluctuations in interest rates. Sonic documents its risk management strategy and hedge effectiveness at the inception of and during the term of each hedge. The only derivatives currently being used are interest rate swaps, used for the purposes of hedging cash flows of variable rate debt and the fair value of fixed rate long-term debt, and options to buy and sell Sonic’s Class A common stock, used for the purpose of hedging the amount of Sonic’s Class A common stock required to be issued to holders of Sonic’s 4.25% convertible senior subordinated notes (the “2005 Convertibles”) upon conversion.
Prior to the current year, Sonic had utilized an interest rate swap agreement to effectively convert a portion of the LIBOR-based variable rate debt to a fixed rate. The swap agreement matured June 6, 2006 and had a notional principal of $100.0 million. Under the terms of the swap agreement, Sonic received interest payments on the notional amount at a rate equal to the one month LIBOR rate, adjusted monthly, and made interest payments at a fixed rate of 4.50%. Incremental interest expense incurred (the difference between interest received and interest paid) as a result of the swap was $1.2 million in 2005 and a benefit of $0.1 million in 2006, and has been included in interest expense, other, net in the accompanying Consolidated Statements of Income. The swap had been designated and qualified as a cash flow hedge and, as a result, changes in the fair value of the swap have been recorded in other comprehensive (loss)/income, net of related income taxes, in the accompanying Consolidated Statements of Stockholders’ Equity.
In 2003, Sonic entered into five separate interest rate swaps totaling $150.0 million (collectively the “Old Variable Swaps”) to effectively convert a portion of the Company’s fixed rate debt to a LIBOR-based variable rate debt. Under the Old Variable Swaps’ agreements, Sonic received 8.625% on the notional amounts, paid interest payments on the notional amounts at a rate equal to the six month LIBOR in arrears (as determined on February 15 and August 15 of each year) plus a spread ranging from 3.50% to 3.84% with a weighted average spread of 3.64%, through the expiration of August 15, 2013 and were designated and qualified as fair value hedges. In the second quarter of 2005, Sonic canceled all of the Old Variable Swaps. The Old Variable Swaps had a collective mark-to-market of a $0.4 million loss at cancellation. In connection with this cancellation, Sonic entered into five separate new interest rate swaps with identical terms to the Old Variable Swaps except that Sonic pays a variable rate equal to the fixed six month LIBOR rate which will be fixed on February 15 and August 15 of each year plus a spread ranging from 3.825% to 3.85% (with a weighted average spread of 3.83%) (collectively, the “New Variable Swaps”). The New Variable Swaps have been designated and qualify as fair value hedges and, as a result, the fair value of the New Variable Swaps of $3.7 million has been recorded against the associated fixed rate long-term debt with an equal offsetting amount of $3.7 million recorded as a derivative liability within other long-term liabilities. The benefit realized (the difference between interest paid and interest
F-10
SONIC AUTOMOTIVE, INC. AND SUBSIDIARIES
NOTES TO CONSOLIDATED FINANCIAL STATEMENTS—(Continued)
received) as a result of the Old and New Swaps was $1.5 million in 2005 and an expense of $0.4 million in 2006 and $1.3 million in 2007, and has been included in interest expense, other, net in the accompanying Consolidated Statements of Income.
During 2007, Sonic entered into interest rate swap agreements (the “Fixed Swaps”) to effectively convert a portion of its LIBOR-based variable rate debt to a fixed rate. Under the terms of the Fixed Swaps, Sonic will receive and pay interest based on the following:
| Notional |
Pay Rate | Receive Rate | Maturing Date | ||||
| (in millions) | |||||||
| $200.0 | 4.935 | % | one month LIBOR | May 1, 2012 | |||
| $100.0 | 5.002 | % | one month LIBOR | June 1, 2012 | |||
| $100.0 | 5.265 | % | one month LIBOR | June 1, 2012 | |||
| $100.0 | 5.319 | % | one month LIBOR | July 1, 2010 | |||
| $ 4.2 | 7.100 | % | one month LIBOR | July 10, 2017 | |||
| $ 25.0 | 5.160 | % | one month LIBOR | September 1, 2012 | |||
| $ 15.0 | 4.965 | % | one month LIBOR | September 1, 2012 | |||
| $ 25.0 | 4.885 | % | one month LIBOR | October 1, 2012 | |||
| $ 13.2 | 4.655 | % | one month LIBOR | December 10, 2017 |
The Fixed Swaps have been designated and qualify as cash flow hedges and, as a result, changes in the fair value of the Fixed Swaps have been recorded in other comprehensive (loss)/income, net of related income taxes in the Consolidated Statements of Stockholders’ Equity. The amount reclassified out of other comprehensive income into results of operations during the year ended December 31, 2007, was $0.3 million.
In connection with the issuance of Sonic’s 4.25% Convertible Senior Subordinated Notes due 2015 in 2005 (the “2005 Convertibles”), Sonic purchased five year call options on Sonic’s Class A common stock (collectively, the “Purchased Options”) from the initial purchasers of the 2005 Convertibles. Under the terms of the Purchased Options, which become exercisable upon conversion of the 2005 Convertibles, Sonic has the right to purchase a total of approximately 6.6 million shares of Sonic’s Class A common stock from the counterparties at a purchase price of $24.14 per share and are net share settleable upon conversion of the 2005 Convertibles. The total cost of the Purchased Options was $27.5 million, which was recorded in stockholders’ equity on the accompanying audited consolidated financial statements in accordance with EITF No. 00-19, “Accounting for Derivative Financial Instruments Indexed to, and Potentially Settled in, a Company’s Own Stock” and EITF No. 01-6, “The Meaning of “Indexed to a Company’s Own Stock”. Sonic anticipates that the cost of the Purchased Options will be deductible as original issue discount for income tax purposes over the expected life of the 2005 Convertibles (five years). The tax benefit of this original issue discount deduction will be recorded as a credit to stockholders’ equity as the deduction occurs.
The cost of the Purchased Options was partially offset by the sale of warrants to acquire shares of Sonic’s Class A common stock from Sonic with a term of five years (collectively, the “Warrants”) to the same counterparties with whom Sonic entered into the Purchased Options. The Warrants are exercisable for a total of approximately 7.0 million shares of Sonic’s Class A common stock at an exercise price of $33.00 per share subject to adjustment (at the sole discretion of the counterparties which shall be made in good faith and based on a commercially reasonable manner) for quarterly dividends in excess of $0.12 per quarter, liquidation, bankruptcy, delivery of shares that are not registered with the SEC, or a change in control of Sonic and other conditions. The settlement method for the warrants is net share settlement or cash at the option of Sonic. If Sonic chooses to deliver shares that are not registered with the SEC, the number of shares to be delivered will be determined by counterparties to the warrants in a commercially reasonable manner. Subject to these adjustments,
F-11
SONIC AUTOMOTIVE, INC. AND SUBSIDIARIES
NOTES TO CONSOLIDATED FINANCIAL STATEMENTS—(Continued)
the maximum amount of shares of Sonic’s Class A common stock that could be required to be issued under the warrants is 24.0 million shares. The proceeds from the sale of the Warrants were $9.1 million, which was also recorded in stockholders’ equity on the accompanying audited consolidated financial statements in accordance with EITF No. 00-19 and EITF No. 01-6. In accordance with EITF No. 00-19, the cost of the Purchased Options and Warrants will not be marked-to-market.
The Purchased Options and the Warrants are subject to early expiration upon the occurrence of certain events that may or may not be within Sonic’s control. Should there be an early termination of the Purchased Options and Warrants prior to the conversion of the 2005 Convertibles from an event outside of Sonic’s control, the amount of shares potentially due to and due from Sonic under the Purchased Options and Warrants will be based soley on Sonic’s Class A common stock price, and the amount of time remaining on the Purchased Options and the Warrants as set forth and agreed to upon the inception of the Purchased Options and Warrants and will be settled in shares of Sonic’s Class A Common Stock. The net effect of the Purchased Options and the Warrants was designed to increase the conversion price per share of Sonic’s Class A common stock from $24.14 to $33.00 (a 66.75% premium to the closing price of Sonic’s Class A common stock on the date that the 2005 Convertibles were priced to investors) and, therefore, mitigate the potential dilution of Sonic’s Class A Common Stock upon conversion of the 2005 Convertibles, if any.
No shares of Sonic’s Class A common stock were issued or received under the Purchased Options or Warrants in 2006 or 2007. Changes in the price of Sonic’s Class A common stock will impact the share settlement of the 2005 Convertibles, the Purchased Options and the Warrants as follows (shares in thousands):
| Stock Price at |
Shares Issued Under the 2005 Convertibles |
Shares Repurchased Under the Purchased Options |
Shares Issued Under the Warrants |
Net Shares Issued | |||||
| $24.00 | — | — | — | — | |||||
| $25.00 | 227.0 | (227.0 | ) | — | — | ||||
| $26.00 | 473.1 | (473.1 | ) | — | — | ||||
| $27.00 | 701.0 | (701.0 | ) | — | — | ||||
| $28.00 | 912.7 | (912.7 | ) | — | — | ||||
| $29.00 | 1,109.7 | (1,109.7 | ) | — | — | ||||
| $30.00 | 1,293.6 | (1,293.6 | ) | — | — | ||||
| $31.00 | 1,465.7 | (1,465.7 | ) | — | — | ||||
| $32.00 | 1,627.0 | (1,627.0 | ) | — | — | ||||
| $33.00 | 1,778.5 | (1,778.5 | ) | — | — | ||||
| $34.00 | 1,921.1 | (1,921.1 | ) | 204.7 | 204.7 | ||||
| $35.00 | 2,055.5 | (2,055.5 | ) | 397.7 | 397.7 | ||||
| $36.00 | 2,182.5 | (2,182.5 | ) | 579.9 | 579.9 | ||||
| $37.00 | 2,302.6 | (2,302.6 | ) | 752.3 | 752.3 | ||||
| $38.00 | 2,416.4 | (2,416.4 | ) | 915.6 | 915.6 | ||||
| $39.00 | 2,524.4 | (2,524.4 | ) | 1,070.5 | 1,070.5 | ||||
| $40.00 | 2,627.0 | (2,627.0 | ) | 1,217.7 | 1,217.7 |
Goodwill—Goodwill is recognized to the extent that the purchase price of the acquisition exceeds the estimated fair value of the net assets acquired, including other identifiable intangible assets.
Goodwill is tested for impairment at least annually, or more frequently when events or circumstances indicate that impairment might have occurred. Based on criteria established by the applicable accounting pronouncements, Sonic has one reporting unit. Goodwill on the balance sheet totaled $1,284.9 million at December 31, 2007, which includes approximately $8.8 million classified in assets held for sale.
F-12
SONIC AUTOMOTIVE, INC. AND SUBSIDIARIES
NOTES TO CONSOLIDATED FINANCIAL STATEMENTS—(Continued)
In evaluating goodwill for impairment, if the fair value of the reporting unit is less than its carrying value, Sonic is then required to proceed to the second step of the impairment test. The second step involves allocating the calculated fair value to all of the assets of the reporting unit as if the calculated fair value was the purchase price in a business combination. This allocation would include assigning value to any previously unrecognized identifiable assets (including franchise assets) which means the remaining fair value that would be allocated to goodwill would be significantly reduced. See discussion regarding franchise agreements acquired prior to July 1, 2001 in “Other Intangible Assets” below. Sonic would then compare the fair value of the goodwill resulting from this allocation process to the carrying value of the goodwill with the difference representing the amount of impairment.
Sonic uses several assumptions and various fair value approaches in evaluating our goodwill for impairment. These assumptions and approaches include an earnings multiple approach using historical cash flows along with a discounted cash flow model utilizing estimated future earnings and Sonic’s weighted average cost of capital.
At December 31, 2007, Sonic was not required to conduct the second step of the impairment test described above, and Sonic recognized no impairment of the carrying value of its goodwill on the balance sheet at December 31, 2007.
However, if in future periods Sonic determines that the fair value of its reporting unit is less than its carrying value, Sonic believes that application of the second step of the impairment test would result in a substantial impairment charge to goodwill and the amount of such impairment charge would likely be materially adverse to Sonic’s consolidated operating results and financial position.
Other Intangible Assets—The principal identifiable intangible assets other than goodwill acquired in an acquisition are rights under franchise agreements with manufacturers. Sonic classifies franchise agreements as indefinite lived intangible assets as it has been Sonic’s experience that renewals have occurred without substantial cost or material modifications to the underlying agreements. As such, Sonic believes that its franchise agreements will contribute to cash flows for an indefinite period, therefore the carrying amount of franchise rights is not amortized. Franchise agreements acquired after July 1, 2001 have been included in other intangible assets on the accompanying Consolidated Balance Sheets. Prior to July 1, 2001, franchise agreements were recorded and amortized as part of goodwill and remain as part of goodwill on the accompanying Consolidated Balance Sheets. See Note 5 regarding impairment charges on franchise agreements. Other intangible assets acquired in acquisitions include favorable lease agreements with definite lives which are amortized on a straight-line basis over the remaining lease term. Sonic tests other intangible assets for impairment annually or more frequently if events or circumstances indicate possible impairment.
Insurance Reserves—Sonic has various self-insured and high deductible casualty and medical insurance programs which require the Company to make estimates in determining the ultimate liability it may incur for claims arising under these programs. These insurance reserves are estimated by management using actuarial evaluations based on historical claims experience, claims processing procedures, medical cost trends and, in certain cases, a discount factor. At December 31, 2006 and 2007, Sonic had $22.6 million and $21.3 million, respectively, reserved for such programs.
Lease Exit Accruals—The majority of Sonic’s dealership properties are leased under long-term operating lease arrangements. When situations arise when the leased properties are no longer utilized in operations, Sonic records accruals for the present value of the lease payments, net of estimated sublease rentals, for the remaining life of the operating leases and other accruals necessary to satisfy the lease commitment to the landlord. These
F-13
SONIC AUTOMOTIVE, INC. AND SUBSIDIARIES
NOTES TO CONSOLIDATED FINANCIAL STATEMENTS—(Continued)
situations could include the relocation of an existing facility or the sale of a franchise whereby the buyer will not be subleasing the property for either the remaining term of the lease or for an amount equal to Sonic’s obligation under the lease. The lease exit accruals represent See Note 11 for further discussion.
Income Taxes—Income taxes are provided for the tax effects of transactions reported in the accompanying Consolidated Financial Statements and consist of taxes currently due plus deferred taxes. Deferred taxes are provided at currently enacted tax rates for the tax effects of carryforward items and temporary differences between the tax basis of assets and liabilities and their reported amounts. As a matter of course, the Company is regularly audited by various taxing authorities and from time to time, these audits result in proposed assessments where the ultimate resolution may result in the Company owing additional taxes. Sonic’s management believes that the Company’s tax positions comply with applicable tax law and that the Company has adequately provided for any reasonably foreseeable outcome related to these matters.
Sonic evaluates its tax positions using the recognition threshold and measurement attribute in accordance with FIN 48. From time to time, Sonic engages in transactions in which the tax consequences may be subject to uncertainty. Significant judgment is required in assessing and estimating the tax consequences of these transactions. Sonic determines whether it is more likely than not that a tax position will be sustained upon examination, including resolution of any related appeals or litigation processes, based on the technical merits of the position. In evaluating whether a tax position has met the more-likely-than-not recognition threshold, Sonic presumes that the position will be examined by the appropriate taxing authority that has full knowledge of all relevant information. A tax position that meets the more-likely-than-not recognition threshold is measured to determine the amount of benefit to be recognized in the financial statements. The tax position is measured at the largest amount of benefit that is greater than 50% likely of being realized upon ultimate settlement. Sonic adjusts its estimates periodically because of ongoing examinations by and settlements with the various taxing authorities, as well as changes in tax laws, regulations and precedent. See Note 7 for discussion related to the adoption of FIN 48.
Sonic has $9.8 million in deferred tax assets related to state net operating loss carryforwards that will expire between 2014 and 2026. Management reviews these carryforward positions, the time remaining until expiration and other opportunities to utilize these carryforwards in making an assessment as to whether it is more likely than not that these carryforwards will be utilized. Sonic has recorded a valuation allowance of $1.3 million in 2007 based on its judgment that certain state carryforwards will not be utilized. Sonic has not recorded a valuation allowance related to its remaining carryforwards because management believes it is more likely than not that taxable income for these states will be sufficient to realize the benefits of the associated deferred tax assets. However, the results of future operations, regulatory framework of these taxing authorities and other related matters cannot be predicted with certainty. Therefore, actual utilization of the losses which created these deferred tax assets which differs from the assumptions used in the development of management’s judgment could result in a charge that will be material to the Company’s consolidated operating results, financial position and cash flows.
Concentrations of Credit Risk—Financial instruments that potentially subject Sonic to concentrations of credit risk consist principally of cash on deposit with financial institutions. At times, amounts invested with financial institutions may exceed FDIC insurance limits. Concentrations of credit risk with respect to receivables are limited primarily to automobile manufacturers and financial institutions. The large number of customers comprising the trade receivables balances reduces credit risk arising from trade receivables from commercial customers.
During 2006, Sonic sold notes receivable held by its wholly owned finance subsidiary, Cornerstone Acceptance Corporation (“Cornerstone”), to a third party for approximately $26.8 million. During the third
F-14
SONIC AUTOMOTIVE, INC. AND SUBSIDIARIES
NOTES TO CONSOLIDATED FINANCIAL STATEMENTS—(Continued)
quarter of 2007, we disposed of substantially all of the remaining assets of Cornerstone for $34.0 million. No material gain or loss was recorded related to either of these sales. As of December 31, 2006, Sonic had outstanding notes receivable held by Cornerstone, of $28.5 million, net of an allowance for credit losses of $4.9 million. These notes receivable are recorded in receivables, net, and other assets on the accompanying Consolidated Balance Sheets.
The counterparties to Sonic’s interest rate swaps, Purchased Options and Warrants contracts consist of three large financial institutions. Sonic could be exposed to loss in the event of nonperformance by any of these counterparties. However, credit ratings and concentration of risk of these financial institutions are monitored by Sonic’s management and present no significant credit risk to Sonic.
Financial Instruments and Market Risks—As of December 31, 2006 and 2007 the fair values of Sonic’s financial instruments including receivables, notes receivable from finance contracts, notes payable-floor plan, trade accounts payable, payables for acquisitions and long-term debt, excluding Sonic’s 8.625% senior subordinated notes, 5.25% convertible senior subordinated notes, 2005 Convertibles and certain notes payable to a finance company, approximate their carrying values due either to length of maturity or existence of variable interest rates that approximate prevailing market rates.
The fair value and carrying value of Sonic’s fixed rate long-term debt was as follows:
| December 31, 2006 | December 31, 2007 | |||||||||||
| Fair Value | Carrying Value |
Fair Value | Carrying Value | |||||||||
| (dollars in thousands) | ||||||||||||
| 8.625% Senior Subordinated Notes (1) |
$ | 285,656 | $ | 272,530 | $ | 270,875 | $ | 272,798 | ||||
| 5.25% Convertible Senior Subordinated Notes (1) |
$ | 126,197 | $ | 128,611 | $ | 126,116 | $ | 129,221 | ||||
| 4.25% Convertible Senior Subordinated Notes (1) |
$ | 209,883 | $ | 156,798 | $ | 166,059 | $ | 157,558 | ||||
| Mortgage Notes |
$ | — | $ | — | $ | 46,415 | $ | 46,415 | ||||
| Notes Payable to a Finance Company (2) |
$ | 27,433 | $ | 27,904 | $ | 25,681 | $ | 25,490 | ||||
| (1) | As determined by market quotations. |
| (2) | As determined by discounted cash flows. |
Sonic has variable rate notes payable—floor plan, revolving credit facilities and other variable rate notes that expose Sonic to risks caused by fluctuations in the underlying interest rates. The total outstanding balance of such facilities before the effects of interest rate swaps was approximately $1,181.3 million at December 31, 2006 and $1,261.8 million at December 31, 2007.
Advertising—Sonic expenses advertising costs in the period incurred, net of earned cooperative manufacturer credits that represent reimbursements for specific, identifiable and incremental advertising costs. Advertising expense amounted to $58.8 million, $63.6 million and $68.0 million for the years ended December 31, 2005, 2006 and 2007, respectively, and has been classified as selling, general and administrative expenses in the accompanying Consolidated Statements of Income.
Sonic has cooperative advertising reimbursement agreements with certain automobile manufacturers it represents. In general, these cooperative programs require Sonic to provide the manufacturer with support for qualified, actual advertising expenditures in order to receive reimbursement under these cooperative agreements. It is uncertain whether or not Sonic would maintain the same level of advertising expenditures if these
F-15
SONIC AUTOMOTIVE, INC. AND SUBSIDIARIES
NOTES TO CONSOLIDATED FINANCIAL STATEMENTS—(Continued)
manufacturers discontinued their cooperative programs. Cooperative manufacturer credits classified as an offset to advertising expenses were $12.5 million, $16.7 million and $15.6 million in 2005, 2006 and 2007, respectively.
Segment Information—Sonic sells similar products and services, uses similar processes in selling products and services, and sells its products and services to similar classes of customers. As a result of this and the way Sonic manages its business, Sonic has determined it has a single segment for purposes of reporting financial condition and results of operations.
| 2. | BUSINESS ACQUISITIONS AND DISPOSITIONS |
Acquisitions
Sonic’s growth strategy is focused on metropolitan markets, predominantly in the Southeast, Southwest, Midwest and California. Where practicable, Sonic also seeks to acquire stable franchises that Sonic believes have above average sales prospects.
During 2007, Sonic acquired or were awarded ten franchises located in Houston, Texas, Panama City, Florida, the Los Angeles, California, market and Montgomery, Alabama, for an aggregate purchase price of approximately $212.5 million in cash, net of cash acquired, funded by cash from operations and borrowings under the revolving credit facilities. The accompanying Consolidated Balance Sheet as of December 31, 2007 includes preliminary allocations of the purchase price of these 2007 acquisitions to the assets and liabilities acquired based on their estimated fair market values at the date of acquisition and are subject to final adjustment. As a result of these acquisitions and purchase price adjustments made related to prior year acquisitions, Sonic has recorded the following:
| • | $77.3 million of net assets relating to dealership operations; |
| • | $7.9 million of intangible assets representing rights acquired under franchise agreements; |
| • | $119.2 million of goodwill, all of which is expected to be tax deductible; and |
| • | $8.1 million of intangible assets representing a favorable lease with a life of twenty years. |
One of the acquisitions completed in 2007 provides for additional cash consideration of up to $3.0 million to be paid if the dealership acquired achieves a prescribed level of earnings over a continuous twelve month period within the five years following the acquisition. As of December 31, 2007, the acquired dealership had not achieved the level of earnings which would result in additional consideration to be paid.
During 2006, Sonic acquired eight franchises for approximately $110.4 million in cash, net of cash acquired. During 2005, Sonic acquired five franchises for approximately $138.8 million in cash, net of cash acquired.
The following unaudited pro forma financial information presents a summary of consolidated results of operations as if all of the 2007 acquisitions had occurred at the beginning of 2006, after giving effect to certain adjustments, including interest expense on acquisition debt and related income tax effects. The pro forma financial information does not give effect to adjustments relating to net reductions in floorplan interest expense resulting from renegotiated floorplan financing agreements or to reductions in salaries and fringe benefits of former owners or officers of acquired dealerships who have not been retained by Sonic or whose salaries have been reduced pursuant to employment agreements with Sonic. The pro forma results have been prepared for comparative purposes only and are not necessarily indicative of the results of operations that would have
F-16
SONIC AUTOMOTIVE, INC. AND SUBSIDIARIES
NOTES TO CONSOLIDATED FINANCIAL STATEMENTS—(Continued)
occurred had the 2007 acquisitions actually been completed at the beginning of the periods presented. The pro forma results are also not necessarily indicative of the results of future operations.
| Year Ended December 31, | ||||||
| 2006 | 2007 | |||||
| (dollars in thousands, except per share amounts) | ||||||
| Total revenues |
$ | 8,516,845 | $ | 8,548,131 | ||
| Gross profit |
1,293,487 | 1,318,855 | ||||
| Income from continuing operations before taxes |
158,640 | 186,675 | ||||
| Net income |
78,920 | 93,962 | ||||
| Diluted earnings per share |
1.80 | 2.10 | ||||
Dispositions
During 2007, Sonic disposed of 12 franchises. These disposals, along with cash received related to the disposal of Cornerstone, generated cash of $62.9 million and resulted in a net loss of $0.6 million which is included in discontinued operations in the accompanying Consolidated Statements of Income. During 2005 and 2006, Sonic completed 22 and 12 franchise dispositions, respectively. These disposals generated cash of $61.6 million and $51.0 million, respectively. The 2005 and 2006 dispositions resulted in gains of $0.4 million and $3.7 million, respectively.
In conjunction with franchise dispositions, Sonic generally agrees to indemnify the buyers from certain liabilities and costs arising from operations or events that occurred prior to sale but which may or may not be known at the time of sale, including environmental liabilities and liabilities associated from the breach of representations or warranties made under the agreements. See Note 11 for further discussion.
In addition to the dispositions described above, as of December 31, 2007, Sonic had approved, but not completed, the disposition of 20 additional franchises. These franchises have been identified as held for sale because of unprofitable operations or various strategic considerations. The operating results of these franchises are included in discontinued operations in the accompanying Consolidated Statements of Income. Assets to be disposed of in connection with franchises not yet sold, which have been classified in assets held for sale in the accompanying Consolidated Balance Sheets, consist of the following:
| December 31, 2006 |
December 31, 2007 | |||||
| (dollars in thousands) | ||||||
| Inventories |
$ | 106,581 | $ | 54,028 | ||
| Property and equipment, net |
32,665 | 22,137 | ||||
| Goodwill |
12,325 | 8,777 | ||||
| Franchise assets |
9,000 | 2,400 | ||||
| Assets held for sale |
$ | 160,571 | $ | 87,342 | ||
F-17
SONIC AUTOMOTIVE, INC. AND SUBSIDIARIES
NOTES TO CONSOLIDATED FINANCIAL STATEMENTS—(Continued)
Liabilities to be disposed in connection with these dispositions are comprised entirely of notes payable—floor plan and are classified as liabilities associated with assets held for sale on the accompanying Consolidated Balance Sheets. Results associated with franchises classified as discontinued operations were as follows:
| Year Ended December 31, | |||||||||||
| 2005 | 2006 | 2007 | |||||||||
| (dollars in thousands) | |||||||||||
| Revenues |
$ | 1,062,625 | $ | 721,334 | $ | 512,163 | |||||
| Franchise agreement impairments |
— | 2,525 | 3,100 | ||||||||
| Lease exit charges |
649 | 7,577 | 2,174 | ||||||||
| Property impairment charges |
1,395 | 7,356 | 2,932 | ||||||||
| (Gain)/Loss on disposal of franchises |
(353 | ) | (3,541 | ) | 640 | ||||||
| Pre-tax losses |
17,433 | 23,054 | 26,585 | ||||||||
Sonic allocates corporate-level interest to discontinued operations based on the net assets of the discontinued operations group. Interest allocated to discontinued operations for the years ended December 31, 2005, 2006 and 2007 was $3.4 million, $3.3 million and $2.7 million, respectively.
| 3. | INVENTORIES AND RELATED NOTES PAYABLE—FLOOR PLAN |
Inventories consist of the following:
| December 31, | ||||||||
| 2006 | 2007 | |||||||
| (dollars in thousands) | ||||||||
| New vehicles |
$ | 827,630 | $ | 836,252 | ||||
| Used vehicles |
145,028 | 168,851 | ||||||
| Parts and accessories |
57,266 | 61,153 | ||||||
| Other |
68,641 | 80,789 | ||||||
| $ | 1,098,565 | $ | 1,147,045 | |||||
| Less inventories classified as assets held for sale |
(106,581 | ) | (54,028 | ) | ||||
| Inventories |
$ | 991,984 | $ | 1,093,017 | ||||
Sonic finances all of its new and certain of its used vehicle inventory through standardized floor plan facilities. In conjunction with entering into a new credit agreement in 2006 as discussed in Note 6, Sonic terminated certain of its floor plan facilities and entered into new arrangements with a syndicate of financial institutions and manufacturer captive finance companies. As part of the new credit agreement, Sonic may also finance certain used vehicle inventory which in the past was financed through its revolving credit facility.
The new and used floor plan facilities bear interest at variable rates based on prime and LIBOR. The weighted average interest rate for Sonic’s new vehicle floor plan facilities was 5.89% and 6.30% for the year ended December 31, 2006 and 2007, respectively. Sonic’s floor plan interest expense related to the new vehicle floor plan arrangements is partially offset by amounts received from manufacturers, in the form of floor plan assistance. Floor plan assistance received is capitalized in inventory and charged against cost of sales when the associated inventory is sold. For the years ended December 31, 2005, 2006 and 2007, Sonic recognized approximately $40.9 million, $42.2 million and $40.4 million, respectively, in manufacturer assistance. As a result of manufacturer assistance recognized, the effective borrowing rate under Sonic’s new floor plan facilities was approximately 1.96% and 3.41% for the years ended December 31, 2006 and 2007, respectively.
F-18
SONIC AUTOMOTIVE, INC. AND SUBSIDIARIES
NOTES TO CONSOLIDATED FINANCIAL STATEMENTS—(Continued)
The average interest rate for Sonic’s used vehicle floor plan facility was 5.74% and 5.90% for the years ended December 31, 2006 and 2007, respectively.
The new and used floor plan facilities are collateralized by vehicle inventories and other assets, excluding franchise agreements, of the relevant dealership subsidiary. The new and used floor plan facilities contain a number of covenants, including, among others, covenants restricting Sonic with respect to the creation of liens and changes in ownership, officers and key management personnel. Sonic was in compliance with all restrictive covenants as of December 31, 2007.
| 4. | PROPERTY AND EQUIPMENT |
Property and equipment consists of the following:
| December 31, | ||||||||
| 2006 | 2007 | |||||||
| (dollars in thousands) | ||||||||
| Land |
$ | 25,016 | $ | 30,644 | ||||
| Building and improvements |
143,345 | 218,383 | ||||||
| Office equipment and fixtures |
65,621 | 66,906 | ||||||
| Parts and service equipment |
44,778 | 53,091 | ||||||
| Company vehicles |
9,519 | 10,187 | ||||||
| Construction in progress |
70,594 | 34,265 | ||||||
| Total, at cost |
358,873 | 413,476 | ||||||
| Less accumulated depreciation |
(79,459 | ) | (98,327 | ) | ||||
| Subtotal |
279,414 | 315,149 | ||||||
| Less assets held for sale |
(32,665 | ) | (22,137 | ) | ||||
| Less construction in progress and land expected to be sold |
(26,198 | ) | (6,421 | ) | ||||
| Property and equipment, net |
$ | 220,551 | $ | 286,591 | ||||
Interest capitalized in conjunction with construction projects was approximately $2.3 million, $3.7 million and $2.5 million for the years ended December 31, 2005, 2006 and 2007, respectively. As of December 31, 2007, commitments for facility construction projects totaled approximately $22.2 million.
Construction in progress and land expected to be sold represent dealership facilities and land that are expected to be completed and sold within one year. Sonic sold $14.5 million, $26.6 million and $27.1 million in 2005, 2006 and 2007, respectively, in dealership equipment and properties in sale-leaseback transactions which resulted in no material gains and losses. Sonic has no continuing involvement or obligations under these arrangements other than lease payments.
F-19
SONIC AUTOMOTIVE, INC. AND SUBSIDIARIES
NOTES TO CONSOLIDATED FINANCIAL STATEMENTS—(Continued)
| 5. | INTANGIBLE ASSETS AND GOODWILL |
The changes in the carrying amount of franchise agreements and goodwill for the years ended December 31, 2006 and 2007 were as follows (dollars in thousands):
| Franchise Agreements |
Goodwill | |||||||
| Balance, December 31, 2005 |
$ | 84,700 | $ | 1,122,538 | ||||
| Additions through current year acquisitions |
5,000 | 46,737 | ||||||
| Prior year acquisition allocations |
(700 | ) | 101 | |||||
| Impairment expense (discontinued operations) |
(2,525 | ) | — | |||||
| Reductions from sales of franchises |
(2,775 | ) | (6,833 | ) | ||||
| Reclassification to assets held for sale, net |
(4,000 | ) | (7,115 | ) | ||||
| Balance, December 31, 2006 |
$ | 79,700 | $ | 1,155,428 | ||||
| Additions through current year acquisitions |
8,700 | 118,275 | ||||||
| Prior year acquisition allocations |
(800 | ) | 956 | |||||
| Impairment expense (discontinued operations) |
(3,100 | ) | — | |||||
| Reductions from sales of franchises |
(1,200 | ) | (2,133 | ) | ||||
| Reclassification from assets held for sale, net |
6,600 | 3,548 | ||||||
| Balance, December 31, 2007 |
$ | 89,900 | $ | 1,276,074 | ||||
Franchise asset impairment expense of $3.1 million was recorded within discontinued operations in the year ended December 31, 2007. The impairments relate to management’s estimate that the recorded franchise assets relating to several franchises held for sale will not be recovered through the sale of those franchises.
Definite life intangible assets consist of the following:
| December 31, | ||||||||
| 2006 | 2007 | |||||||
| (dollars in thousands) | ||||||||
| Lease agreements |
$ | 15,853 | $ | 24,015 | ||||
| Less accumulated amortization |
(1,417 | ) | (2,573 | ) | ||||
| Definite life intangibles, net |
$ | 14,436 | $ | 21,442 | ||||
Franchise values and definite life intangible assets are classified as Other Intangible Assets, net on the accompanying Consolidated Balance Sheets.
Amortization expense for definite life intangible assets was $0.3 million, $0.7 million and $1.2 million for the years ended December 31, 2005, 2006 and 2007, respectively. Future amortization expense is as follows:
| Year ending December 31, |
(dollars in thousands) | ||
| 2008 |
$ | 1,370 | |
| 2009 |
1,401 | ||
| 2010 |
1,425 | ||
| 2011 |
1,515 | ||
| 2012 |
1,626 | ||
| Thereafter |
14,105 | ||
| Total |
$ | 21,442 | |
F-20
SONIC AUTOMOTIVE, INC. AND SUBSIDIARIES
NOTES TO CONSOLIDATED FINANCIAL STATEMENTS—(Continued)
| 6. | LONG-TERM DEBT |
Long-term debt consists of the following:
| December 31 | ||||||||
| 2006 | 2007 | |||||||
| (dollars in thousands) | ||||||||
| $350 million 2006 Revolving Credit Sub-Facility bearing interest at 2.00 percentage points above LIBOR (4.6% at December 31, 2007), collateralized by all assets of Sonic. |
$ | 20,086 | $ | 70,000 | ||||
| Senior Subordinated Notes bearing interest at 8.625% maturing August 15, 2013, net of net discount of $2,470 and $2,202, respectively. |
272,530 | 272,798 | ||||||
| Convertible Senior Subordinated Notes bearing interest at 5.25%, maturing May 7, 2009, net of discount of $1,489 and $879, respectively . |
128,611 | 129,221 | ||||||
| Convertible Senior Subordinated Notes bearing interest at 4.25%, maturing November 30, 2015, redeemable on or after October 31, 2010, net of discount of $3,202 and $2,442, respectively |
156,798 | 157,558 | ||||||
| Notes payable to a finance company bearing interest from 9.52% to 10.52% (with a weighted average of 10.19%), with combined monthly principal and interest payments of $325, maturing November 1, 2015 through September 1, 2016, and collateralized by letters of credit, including premium of $4,840 and $4,010, respectively |
27,905 | 25,490 | ||||||
| Mortgage notes to finance companies, bearing interest from 6.60% to 7.03% (with a weighted average of 6.81%) with combined monthly principal and interest payments of $316, maturing July 2017 through May 2027. |
— | 46,415 | ||||||
| Fair value of Variable Swaps |
(4,710 | ) | 724 | |||||
| Other notes payable (primarily equipment notes) |
114 | (209 | ) | |||||
| $ | 601,334 | $ | 701,997 | |||||
| Less current maturities |
(2,707 | ) | (4,197 | ) | ||||
| Long-term debt |
$ | 598,627 | $ | 697,800 | ||||
The indenture governing Sonic’s 8.625% senior subordinated notes limits Sonic’s ability to pay quarterly cash dividends in excess of $0.10 per share. Sonic may only pay quarterly cash dividends in excess of this amount if Sonic complies with Section 1009 of the indenture governing these notes, which was filed as Exhibit 4.4 to the Registration Statement on Form S-4 (Reg. No. 333-109426). The indenture governing Sonic’s convertible senior subordinated notes (the “Convertibles”) does not limit Sonic’s ability to pay dividends. Sonic’s 2006 Credit Facility permits cash dividends so long as no event of default or unmatured default (as defined in the credit agreement) has occurred and is continuing and provided that, after giving effect to the payment of a dividend, Sonic remains in compliance with the other terms and conditions of the credit agreement.
F-21
SONIC AUTOMOTIVE, INC. AND SUBSIDIARIES
NOTES TO CONSOLIDATED FINANCIAL STATEMENTS—(Continued)
Future maturities of long-term debt are as follows:
| Year ending December 31, |
(Dollars in thousands) | ||
| 2008 |
4,197 | ||
| 2009 |
133,667 | ||
| 2010 |
232,149 | ||
| 2011 |
4,808 | ||
| 2012 |
5,038 | ||
| Thereafter. |
322,138 | ||
| Total |
$ | 701,997 | |
2006 Credit Facility
On February 17, 2006, Sonic entered into a new four-year syndicated credit facility (the “2006 Credit Facility”) with 14 financial institutions, including three manufacturer-affiliated finance companies, providing for up to $1.2 billion in revolving credit and floor plan financing. The 2006 Credit Facility replaces the 2001 Revolving Credit Facility, as amended, (which was terminated February 17, 2006) and a portion of Sonic’s existing floor plan financing arrangements.
The 2006 Credit Facility has a borrowing limit of $1.2 billion, which may be expanded up to $1.45 billion in total credit availability upon satisfaction of certain conditions. Under the terms of the 2006 Credit Facility, up to $700.0 million is available for new vehicle inventory floor plan financing (the “2006 New Vehicle Floor Plan Sub-Facility”), up to $150.0 million is available for used vehicle inventory floor plan financing (the “2006 Used Vehicle Floor Plan Sub-Facility”) and up to $350.0 million is available for working capital and general corporate purposes (the “2006 Revolving Credit Sub-Facility”). The amount available for borrowing under the 2006 Revolving Credit Sub-Facility is reduced on a dollar-for-dollar basis by the aggregate face amount of any outstanding letters of credit. The 2006 Revolving Credit Sub-Facility matures on February 17, 2010. The 2006 New Vehicle Floor Plan Sub-Facility and the 2006 Used Vehicle Floor Plan Sub-Facility mature on the earlier of February 17, 2010 or upon demand by the administrative agent at the request of more than 80% of the lenders under those facilities.
At December 31, 2007, our revolving credit facility (part of the New Credit Facility) had a borrowing limit of $350.0 million (the “Revolving Credit Facility”), subject to a borrowing base calculated on the basis of our receivables, inventory and equipment and a pledge of certain additional collateral by one of our affiliates (the borrowing base was approximately $385.2 million at December 31, 2007). The amount available to be borrowed under the Revolving Credit Facility is reduced on a dollar-for-dollar basis by the cumulative face amount of outstanding letters of credit. At December 31, 2007, we had $74.8 million in letters of credit outstanding and $205.2 million of borrowing availability.
The amounts outstanding under the 2006 Revolving Credit Sub-Facility bear interest at a specified percentage above LIBOR according to a performance-based pricing grid determined by Sonic’s Total Senior Secured Debt to EBITDA Ratio as of the last day of the immediately preceding fiscal quarter. The range of the performance-based pricing grid is from 1.75% above LIBOR to 2.75% above LIBOR. The weighted average rate of the 2006 Revolving Credit Sub-Facility during the year ended December 31, 2007 was 7.28%. In addition, there is a quarterly commitment fee payable by Sonic on the unused portion of the 2006 Revolving Credit Sub-Facility according to a performance-based pricing grid determined by Sonic’s Total Senior Secured Debt to EBITDA Ratio as of the last day of the immediately preceding fiscal quarter. The range of the performance-
F-22
SONIC AUTOMOTIVE, INC. AND SUBSIDIARIES
NOTES TO CONSOLIDATED FINANCIAL STATEMENTS—(Continued)
based pricing grid for the quarterly commitment fee is 0.20% to 0.45% on the unused portion of the 2006 Revolving Credit Sub-Facility. The amounts outstanding under the 2006 New Vehicle Floor Plan Sub-Facility bear interest at 1.00% above LIBOR. The amounts outstanding under the 2006 Used Vehicle Floor Plan Sub-Facility bear interest at 1.125% above LIBOR. In addition, there are quarterly commitment fees of 0.20% payable by Sonic on the unused portion of both the 2006 New Vehicle Floor Plan Sub-Facility and the 2006 Used Vehicle Floor Plan Sub-Facility. Under the terms of collateral documents entered into with the lenders under the 2006 Credit Facility, outstanding balances under the 2006 Credit Facility are secured by a pledge of substantially all of Sonic’s assets and the assets of substantially all of Sonic’s domestic subsidiaries, which domestic subsidiaries also guarantee Sonic’s obligations under the 2006 Credit Facility, and the pledge of certain additional collateral by one of Sonic’s affiliates. The collateral for the New Credit Facility also includes the pledge of the stock or equity interests of Sonic’s dealership franchise subsidiaries, except where such a pledge is prohibited by the applicable vehicle manufacturer.
Sonic agreed under the 2006 Credit Facility not to pledge any assets to any third party, subject to certain stated exceptions, including floor plan financing arrangements. In addition, the 2006 Credit Facility contains certain negative covenants, including covenants which could restrict or prohibit the payment of dividends, capital expenditures and material dispositions of assets as well as other customary covenants and default provisions. Specifically, the 2006 Credit Facility permits cash dividends on Sonic’s Class A and Class B common stock so long as no event of default or unmatured default (as defined in the New Credit Facility) has occurred and is continuing and provided that, after giving effect to the payment of a dividend, Sonic remains in compliance with other terms and conditions of the 2006 Credit Facility. Financial covenants include required specified ratios of:
| Covenant |
Required | ||
| Consolidated liquidity ratio |
³ | 1.15 | |
| Consolidated fixed charge coverage ratio |
³ | 1.20 | |
| Consolidated total senior secured debt to EBITDA ratio |
£ | 2.25 | |
The 2006 Credit Facility contains events of default, including cross-defaults to other material indebtedness, change of control events and events of default customary for syndicated commercial credit facilities. Upon the occurrence of an event of default, Sonic could be required to immediately repay all outstanding amounts under the 2006 Credit Facility.
On February 17, 2006, in conjunction with the entrance into the 2006 Credit Facility, Sonic and substantially all of Sonic’s domestic subsidiaries entered into collateral documents with the lenders, pursuant to which Sonic and substantially all of Sonic’s domestic subsidiaries granted a security interest in substantially all their assets to secure Sonic’s obligations under the 2006 Credit Facility, including a pledge of the stock or equity interests of Sonic’s dealership franchise subsidiaries except where such a pledge is prohibited by the applicable vehicle manufacturer. This grant of security interests replaces the grant under the 2001 Revolving Credit Facility, as amended.
2001 Revolving Credit Facility, as Amended
Prior to entering into the 2006 Credit Facility, Sonic utilized the 2001 Revolving Credit Facility, as amended. The amounts outstanding under the 2001 Revolving Credit Facility, as amended, bore interest at 2.55 percentage points above LIBOR. The 2001 Revolving Credit Facility, as amended, included an annual commitment fee equal to 0.25% of the unused portion of the 2001 Revolving Facility, as amended.
F-23
SONIC AUTOMOTIVE, INC. AND SUBSIDIARIES
NOTES TO CONSOLIDATED FINANCIAL STATEMENTS—(Continued)
Senior Subordinated 8.625% Notes
Sonic has $275.0 million of principal amount outstanding of 8.625% senior subordinated notes due 2013 (the “8.625% Notes”). The 8.625% Notes are unsecured obligations that rank equal in right of payment to all of Sonic’s existing and future senior subordinated indebtedness, mature on August 15, 2013 and are redeemable at Sonic’s option after August 15, 2008. In addition, up to 35% of the aggregate principal amount of the 8.625% Notes may be redeemed on or before August 15, 2006 with net cash proceeds from certain equity offerings. Sonic’s obligations under the 8.625% Notes are guaranteed by Sonic’s operating domestic subsidiaries.
The indentures governing the 8.625% Notes contain certain specified restrictive and required financial covenants. Sonic has agreed not to pledge any assets to any third party except under certain limited circumstances. Sonic also has agreed to certain other limitations or prohibitions concerning the incurrence of other indebtedness, capital stock, guaranties, asset sales, investments, cash dividends to shareholders, distributions and redemptions. Specifically, the indenture governing Sonic’s 8.625% Notes limits Sonic’s ability to pay quarterly cash dividends on Sonic’s Class A and B common stock in excess of $0.10 per share. Sonic may only pay quarterly cash dividends on Sonic’s Class A and B common stock if Sonic complies with Section 1009 of the indenture governing the 8.625% Notes, which was filed as Exhibit 4.4 to Sonic’s Registration Statement on Form S-4 (Reg. No. 333-109426). Sonic was in compliance with all restrictive covenants as of December 31, 2007.
5.25% Convertible Senior Subordinated Notes
Sonic has $130.1 million of principal amount outstanding of 5.25% convertible senior subordinated notes due 2009 (the “2002 Convertibles”). The 2002 Convertibles are unsecured obligations that rank equal in right of payment to all of Sonic’s existing and future senior subordinated indebtedness, mature on May 7, 2009 and are redeemable at Sonic’s option after May 7, 2005. Sonic’s obligations under the 2002 Convertibles are not guaranteed by any of Sonic’s subsidiaries.
The 2002 Convertibles are convertible into shares of Class A common stock, at the option of the holder, if as of the last day of the preceding fiscal quarter, the closing sale price of the Class A common stock for at least 20 trading days in a period of 30 consecutive trading days ending on the last trading-day of such preceding fiscal quarter is more than 110% of the conversion price per share of Class A common stock on the last day of such preceding fiscal quarter. If this condition is satisfied, then the 2002 Convertibles will be convertible at any time, at the option of the holder, through maturity. The initial conversion price per share is $46.87, and will be subject to adjustment for certain distributions on, or other changes in Sonic’s Class A common stock, if any, prior to the conversion date. In addition, on or before May 7, 2007, a holder also may convert the 2002 Convertibles into shares of the Class A common stock at any time after a 10 consecutive trading-day period in which the average of the trading day prices for the 2002 Convertibles for that 10 trading-day period is less than 103% of the average conversion value for the 2002 Convertibles during that period. The conversion value is equal to the product of the closing sale price for Sonic’s Class A common stock on a given day multiplied by the then current conversion rate, which is the number of shares of Class A common stock into which each $1,000 principal amount of 2002 Convertibles is then convertible. Neither of these conversion features were satisfied during 2007.
4.25% Convertible Senior Subordinated Notes
In November and December 2005, Sonic issued $160.0 million in aggregate principal amount of 2005 Convertibles with net proceeds, before expenses, of approximately $156.2 million. The 2005 Convertibles bear interest at an annual rate of 4.25% until November 30, 2010 and 4.75% thereafter. The net proceeds were used to repay a portion of the amounts outstanding under Sonic’s 2001 Revolving Credit Facility, as amended, and to pay
F-24
SONIC AUTOMOTIVE, INC. AND SUBSIDIARIES
NOTES TO CONSOLIDATED FINANCIAL STATEMENTS—(Continued)
the net cost of convertible note hedge and warrant transactions. The 2005 Convertibles are unsecured obligations that rank equal in right of payment to all of Sonic’s existing and future senior subordinated indebtedness, mature on November 30, 2015 and are redeemable on or after November 30, 2010. Sonic’s obligations under the 2005 Convertibles are not guaranteed by any of Sonic’s subsidiaries. Holders of the 2005 Convertibles may convert them into cash and shares of Sonic’s Class A common stock at an initial conversion rate of 41.4185 shares per $1,000 of principal amount, subject to distributions on, or other changes in Sonic’s Class A common stock, if any, prior to the conversion date.
The 2005 Convertibles are convertible into cash and shares of Sonic’s Class A common stock if prior to October 31, 2010, during the five business day period after any five consecutive trading day period in which the trading price per $1,000 principal amount of 2005 Convertibles was less than 103% of the product of the closing price of Sonic’s Class A common stock and the applicable conversion rate for the 2005 Convertibles; if Sonic calls the 2005 Convertibles for redemption; or upon the occurrence of certain corporate transactions; or on or after October 31, 2010. Upon conversion of the 2005 Convertibles, Sonic will be required to deliver cash equal to the lesser of the aggregate principal amount of the 2005 Convertibles being converted and Sonic’s total conversion obligation. If Sonic’s total conversion obligation exceeds the aggregate principal amount of the 2005 Convertibles being converted, Sonic will deliver shares of Class A common stock to the extent of the excess amount, if any. None of the conversion features on the 2005 Convertibles were triggered in 2006.
Sonic used $18.5 million of the net proceeds from the sale of the 2005 Convertibles to pay the net cost of convertible note hedge and warrant transactions entered into with the initial purchasers of the 2005 Convertibles. The convertible note hedge and warrant transactions were designed to increase the effective conversion price per share of Sonic’s Class A common stock from $24.14 to $33.00 and, therefore, mitigate the potential dilution upon conversion of the 2005 Convertibles at the time of conversion. See Note 1, “Derivative Instruments and Hedging Activities” for a discussion regarding the convertible note hedge and warrant transactions.
Notes Payable to a Finance Company
Three notes payable totaling $26.6 million in aggregate principal were assumed in connection with an acquisition during 2005 (the “Assumed Notes”). Sonic recorded the Assumed Notes at fair value using an interest rate of 5.35%. The interest rate used to calculate the fair value was based on a quoted market price for notes with similar terms as of the date of assumption. As a result of calculating the fair value, a premium of $7.3 million was recorded that will be amortized over the lives of the Assumed Notes. At December 31, 2007, the principal balance on the Assumed Notes was $21.5 million.
Mortgage Notes
During 2007, we obtained mortgage financing totaling $46.7 million in aggregate, on four of our dealership properties. These mortgage notes require monthly payments of principal and interest through maturity and are secured by the underlying properties. Maturity dates range between July 2017 and November 2027. The weighted average interest rate was 6.81% at December 31, 2007. Proceeds received were used to repay borrowings under our 2006 Revolving Credit Sub-Facility.
Subsidiary Guarantees
Balances outstanding under Sonic’s 8.625% Notes are guaranteed by all of Sonic’s operating domestic subsidiaries. These guarantees are full and unconditional and joint and several. The parent company has no independent assets or operations. The non-domestic and non-operating subsidiaries that are not guarantors are considered to be minor as defined by the Securities and Exchange Commission (the “SEC”).
F-25
SONIC AUTOMOTIVE, INC. AND SUBSIDIARIES
NOTES TO CONSOLIDATED FINANCIAL STATEMENTS—(Continued)
| 7. | INCOME TAXES |
The provision for income taxes from continuing operations consists of the following:
| 2005 | 2006 | 2007 | |||||||
| (amounts in thousands) | |||||||||
| Current: |
|||||||||
| Federal |
$ | 29,736 | $ | 42,815 | $ | 40,813 | |||
| State |
4,584 | 7,770 | 8,897 | ||||||
| 34,320 | 50,585 | 49,710 | |||||||
| Deferred |
28,142 | 14,905 | 24,667 | ||||||
| Total provision for income taxes for continuing operations |
$ | 62,462 | $ | 65,490 | $ | 74,377 | |||
The reconciliation of the statutory federal income tax rate with Sonic’s federal and state overall effective income tax rate from continuing operations is as follows:
| 2005 | 2006 | 2007 | |||||||
| Statutory federal rate |
35.00 | % | 35.00 | % | 35.00 | % | |||
| Effective state income tax rate |
1.81 | 3.39 | 4.18 | ||||||
| Other |
0.33 | 1.96 | 0.13 | ||||||
| Effective tax rate |
37.14 | % | 40.35 | % | 39.31 | % | |||
Deferred income taxes reflect the net tax effects of the temporary differences between the carrying amounts of assets and liabilities for financial reporting purposes and the amounts used for tax purposes. Significant components of Sonic’s deferred tax assets and liabilities as of December 31 are as follows:
| 2006 | 2007 | |||||||
| (dollars in thousands) | ||||||||
| Deferred tax assets: |
||||||||
| Allowance for bad debts |
$ | 791 | $ | 181 | ||||
| Accruals and reserves |
32,428 | 32,032 | ||||||
| Net operating loss carryforwards |
9,306 | 9,794 | ||||||
| Fair value of Fixed Swaps |
— | 9,071 | ||||||
| Interest and state taxes associated with FIN 48 liability |
— | 6,575 | ||||||
| Other |
46 | 195 | ||||||
| Total deferred tax assets |
42,571 | 57,848 | ||||||
| Deferred tax liabilities: |
||||||||
| Basis difference in inventory |
(4,485 | ) | (4,396 | ) | ||||
| Basis difference in property and equipment |
(13,783 | ) | (9,711 | ) | ||||
| Basis difference in goodwill |
(147,312 | ) | (168,280 | ) | ||||
| State valuation allowance |
(143 | ) | (1,305 | ) | ||||
| Other |
(2,368 | ) | (2,720 | ) | ||||
| Total deferred tax liability |
(168,091 | ) | (186,412 | ) | ||||
| Net deferred tax liability |
$ | (125,520 | ) | $ | (128,564 | ) | ||
F-26
SONIC AUTOMOTIVE, INC. AND SUBSIDIARIES
NOTES TO CONSOLIDATED FINANCIAL STATEMENTS—(Continued)
Net current deferred tax assets are recorded in other current assets on the accompanying Consolidated Balance Sheets. As of December 31, 2007, after considering the effect of state valuation allowances, Sonic had state net operating loss carryforwards of $236.9 million that will expire between 2014 and 2027.
Sonic adopted the provisions of FIN 48 on January 1, 2007. As allowed in the year of adoption, Sonic recorded a charge of $8.6 million to 2007 beginning retained earnings resulting from its initial application of the provisions of FIN 48. At January 1, 2007, Sonic had liabilities of $23.4 million recorded related to unrecognized tax benefits. Included in the liabilities related to unrecognized tax benefits at January 1, 2007, is $4.7 million related to interest and penalties which Sonic has estimated may be paid as a result of its tax positions. It is Sonic’s policy to classify the expense related to interest and penalties to be paid on underpayments of income taxes within income tax expense. A summary of the changes in the liability related to Sonic’s unrecognized tax benefits is presented below.
| (In thousands) | ||||
| Unrecognized tax benefit liability, January 1, 2007 (1) |
$ | 18,659 | ||
| Prior period positions: |
||||
| Increases |
273 | |||
| Decreases |
(42 | ) | ||
| Current period positions |
2,755 | |||
| Settlements |
(275 | ) | ||
| Lapse of statute of limitations |
(2,449 | ) | ||
| Unrecognized tax benefit liability, December 31, 2007 (2) |
$ | 18,921 | ||
| (1) | Excludes accrued interest and penalties of $4.7 million at January 1, 2007 |
| (2) | Excludes accrued interest and penalties of $5.6 million at December 31, 2007 |
Approximately $13.5 million of the unrecognized tax benefits as of December 31, 2007 would ultimately affect the income tax rate if ultimately recognized. Included in the December 31, 2007 recorded liability is $5.6 million related to interest and penalties which Sonic has estimated may be paid as a result of its tax positions. Sonic does not anticipate any significant changes in its unrecognized tax benefit liability within the next twelve months.
Sonic and its subsidiaries are subject to U.S. federal income tax as well as income tax of multiple state jurisdictions. Sonic’s 2004 through 2007 U.S. federal income tax returns remain open to examination by the Internal Revenue Service. Sonic and its subsidiaries’ state income tax returns are open to examination by state taxing authorities for years ranging from 2000 to 2007.
| 8. | RELATED PARTIES |
Registration Rights Agreement
Prior to the Company’s initial public offering, Sonic signed a Registration Rights Agreement dated as of June 30, 1997 with Sonic Financial Corporation (“SFC”), O. Bruton Smith, B. Scott Smith and William S. Egan (collectively, the “Class B Registration Rights Holders”). SFC currently owns 8,881,250 shares of Class B common stock; O. Bruton Smith, 2,171,250 shares; and B. Scott Smith, 976,875 shares; all of which are covered by the Registration Rights Agreement. The Egan Group LLC, an assignee of William S. Egan, also owns certain shares of Class A common stock to which the Registration Rights Agreement applies. If, among other things provided in Sonic’s charter, offers and sales of shares of Class B common stock are registered with the SEC, then such shares will automatically convert into a like number of shares of Class A common stock. The Registration Rights Agreement expired in November 2007. SFC is controlled by O. Bruton Smith.
F-27
SONIC AUTOMOTIVE, INC. AND SUBSIDIARIES
NOTES TO CONSOLIDATED FINANCIAL STATEMENTS—(Continued)
Other Transactions
Sonic leases office space in Charlotte from a subsidiary of SFC for a majority of its headquarters personnel. Annual aggregate rent under this lease was approximately $0.5 million in 2005, $0.6 million in 2006 and $0.6 million in 2007.
Sonic rents various aircraft owned by SFC, subject to their availability, for business-related travel by Sonic executives. Sonic incurred costs of approximately $0.8 million in 2005, $1.2 million in 2006 and $1.0 million in 2007 for the use of these aircraft.
Certain of Sonic’s dealerships purchase the Z-Max oil additive product from Oil Chem Research Company, a subsidiary of Speedway Motorsports, Inc. (“SMI”) who’s Chairman and Chief Executive Officer is O. Bruton Smith, for resale to service customers of Sonic’s dealerships in the ordinary course of business. Total purchases from Oil Chem by Sonic dealerships totaled approximately $1.5 million in 2005, $1.4 million in 2006 and $1.9 million in 2007.
Sonic donates cash throughout the year to Speedway Children’s Charities, a non-profit organization founded by O. Bruton Smith. O. Bruton Smith and B. Scott Smith are both board members of Speedway Children’s Charities. Donations to this organization amounted to $0.4 million, $0.3 million and $0.3 million in 2005, 2006 and 2007, respectively.
| 9. | CAPITAL STRUCTURE AND PER SHARE DATA |
Preferred Stock—Sonic has 3 million shares of “blank check” preferred stock authorized with such designations, rights and preferences as may be determined from time to time by the Board of Directors. The Board of Directors has designated 300,000 shares of preferred stock as Class A convertible preferred stock, par value $0.10 per share (the “Preferred Stock”) which is divided into 100,000 shares of Series I Preferred Stock, 100,000 shares of Series II Preferred Stock, and 100,000 shares of Series III Preferred Stock. There were no shares of Preferred Stock issued or outstanding at December 31, 2006 and 2007.
Common Stock—Sonic has two classes of common stock. Sonic has authorized 100.0 million shares of Class A common stock at a par value of $0.01 per share. Class A common stock entitles its holder to one vote per share. Sonic has also authorized 30 million shares of Class B common stock at a par value of $.01 per share. Class B common stock entitles its holder to ten votes per share, except in certain circumstances. Each share of Class B common stock is convertible into one share of Class A common stock either upon voluntary conversion at the option of the holder, or automatically upon the occurrence of certain events, as provided in Sonic’s charter. The two classes of stock share equally in dividends and in the event of liquidation.
Hedge and Warrants on 4.25% Convertible Notes—In connection with the sale of $160.0 million of 4.25% convertible notes in the fourth quarter of 2006, Sonic executed a hedge and sold warrants to purchase shares of Sonic Class A common stock designed to mitigate the dilutive effect of the delivery of Sonic’s Class A common stock upon conversion of these convertible notes. See Note 6.
Share Repurchases—Sonic’s Board of Directors has authorized Sonic to expend up to $255.0 million to repurchase shares of its Class A common stock or redeem securities convertible into Class A common stock. As of December 31, 2007, Sonic had repurchased a total of 13,115,164 shares of Class A common stock at an average price per share of approximately $15.85 and had redeemed 13,801.5 shares of Class A convertible preferred stock at an average price of $1,000 per share. As of December 31, 2007, Sonic had $33.3 million remaining under the Board’s authorization.
F-28
SONIC AUTOMOTIVE, INC. AND SUBSIDIARIES
NOTES TO CONSOLIDATED FINANCIAL STATEMENTS—(Continued)
Per Share Data—The calculation of diluted earnings per share considers the potential dilutive effect of options and shares under Sonic’s stock compensation plans, Class A common stock purchase warrants, the 2002 Convertibles and the 2005 Convertibles (see Notes 1 and 6). The following table illustrates the dilutive effect of such items on earnings per share:
| For the Year Ended December 31, 2005 | ||||||||||||||||||||||
| Income From Continuing Operations |
Loss From Discontinued Operations |
Net Income | ||||||||||||||||||||
| Shares | Amount | Per Share Amount |
Amount | Per Share Amount |
Amount | Per Share Amount | ||||||||||||||||
| (amounts in thousands except per share amounts) | ||||||||||||||||||||||
| Basic Earnings Per Share |
41,817 | $ | 105,713 | $ | 2.53 | $ | (13,852 | ) | $ | (0.33 | ) | $ | 91,861 | $ | 2.20 | |||||||
| Effect of Dilutive Securities: |
||||||||||||||||||||||
| Contingently Convertible Debt (2002 Convertibles) |
2,776 | 4,344 | 194 | 4,538 | ||||||||||||||||||
| Stock Compensation Plans |
940 | |||||||||||||||||||||
| Diluted Earnings (Loss) Per Share |
45,533 | $ | 110,057 | $ | 2.42 | $ | (13,658 | ) | $ | (0.30 | ) | $ | 96,399 | $ | 2.12 | |||||||
| For the Year Ended December 31, 2006 | ||||||||||||||||||||||
| Income From Continuing Operations |
Loss From Discontinued Operations |
Net Income | ||||||||||||||||||||
| Shares | Amount | Per Share Amount |
Amount | Per Share Amount |
Amount | Per Share Amount | ||||||||||||||||
| (amounts in thousands except per share amounts) | ||||||||||||||||||||||
| Basic Earnings Per Share |
42,336 | $ | 96,832 | $ | 2.29 | $ | (15,715 | ) | $ | (0.37 | ) | $ | 81,117 | $ | 1.92 | |||||||
| Effect of Dilutive Securities: |
||||||||||||||||||||||
| Contingently Convertible Debt (2002 Convertibles) |
2,776 | 4,093 | 271 | 4,364 | ||||||||||||||||||
| Contingently Convertible Debt (2005 Convertibles) |
302 | |||||||||||||||||||||
| Stock Compensation Plans |
851 | |||||||||||||||||||||
| Diluted Earnings (Loss) Per Share |
46,265 | $ | 100,925 | $ | 2.18 | $ | (15,444 | ) | $ | (0.33 | ) | $ | 85,481 | $ | 1.85 | |||||||
| For the Year Ended December 31, 2007 | ||||||||||||||||||||||
| Income From Continuing Operations |
Loss From Discontinued Operations |
Net Income | ||||||||||||||||||||
| Shares | Amount | Per Share Amount |
Amount | Per Share Amount |
Amount | Per Share Amount | ||||||||||||||||
| (amounts in thousands except per share amounts) | ||||||||||||||||||||||
| Basic Earnings Per Share |
42,479 | $ | 114,836 | $ | 2.70 | $ | (19,334 | ) | $ | (0.45 | ) | $ | 95,502 | $ | 2.25 | |||||||
| Effect of Dilutive Securities: |
||||||||||||||||||||||
| Contingently Convertible Debt (2002 Convertibles) |
2,776 | 4,203 | 223 | 4,426 | ||||||||||||||||||
| Contingently Convertible Debt (2005 Convertibles) |
819 | |||||||||||||||||||||
| Stock Compensation Plans |
867 | |||||||||||||||||||||
| Diluted Earnings (Loss) Per Share |
46,941 | $ | 119,039 | $ | 2.54 | $ | (19,111 | ) | $ | (0.41 | ) | $ | 99,928 | $ | 2.13 | |||||||
F-29
SONIC AUTOMOTIVE, INC. AND SUBSIDIARIES
NOTES TO CONSOLIDATED FINANCIAL STATEMENTS—(Continued)
In addition to the stock options included in the tables above, options to purchase approximately 1.7 million, 0.6 million and 1.8 million shares of Class A common stock were outstanding during the years ended December 31, 2005, 2006 and 2007, respectively, but were not included in the computation of diluted net income per share because the options were antidilutive.
| 10. | EMPLOYEE BENEFIT PLANS |
Substantially all of the employees of Sonic are eligible to participate in a 401(k) plan. In accordance with the formula in the 401(k) plan agreement, contributions by Sonic to the 401(k) plan were $4.5 million in 2005, $5.6 million in 2006 and $6.0 million in 2007.
Stock Compensation Plans
Effective January 1, 2006, Sonic adopted SFAS No. 123(R), “Share-Based Payment”, using the modified prospective application transition method. Prior to Sonic’s adoption of SFAS No. 123(R), benefits of tax deductions in excess of recognized compensation costs were reported as operating cash flows on the statement of cash flows. SFAS No. 123(R) requires excess tax benefits to be reported as a financing cash inflow rather than as a reduction of taxes paid on the statement of cash flows.
Sonic currently has two stock compensation plans, the Sonic Automotive, Inc. 2004 Stock Incentive Plan (the “2004 Plan”) and the 2005 Formula Restricted Stock Plan for Non-Employee Directors (the “2005 Formula Plan”) (collectively, the “Stock Plans”). During the second quarter of 2007, Sonic’s stockholders approved amendments to the 2004 Plan and the 2005 Formula Plan to increase the number of shares issuable under these plans to 3,000,000 and 90,000, respectively. The First America Automotive, Inc. 1997 Stock Option Plan (the “First America Plan”) and the Sonic Automotive, Inc. 1997 Stock Option Plan (the “1997 Plan”) terminated during the third and fourth quarters, respectively.
The 2004 Plan and the 1997 Plan were adopted by the Board of Directors in order to attract and retain key personnel and currently authorize the issuance of options to purchase 2.0 million and 9.0 million shares of Class A common stock, respectively. Under the 2004 Plan and the 1997 Plan, options to purchase shares of Class A common stock may be granted to key employees of Sonic and its subsidiaries and to officers, directors, consultants and other individuals providing services to Sonic. The options are granted at the fair market value of Sonic’s Class A common stock at the date of grant, vest over a period ranging from six months to three years, are exercisable upon vesting and expire ten years from the date of grant. The 2004 Plan also authorizes the issuance of restricted stock. Restricted stock issued under the 2004 plan generally vests at the end of a three year term. The 2005 Formula Plan provides for grants of restricted stock to non-employee directors and restrictions on those shares generally expire one year from the date of grant. Individuals receiving restricted shares under both the 2005 Formula Plan and the 2004 Plan have voting rights and receive dividends on unvested shares. The First America Plan was assumed by Sonic in connection with the purchase of First America Automotive in 1999. Although Sonic does not issue stock-based awards under the First America Plan, options to purchase Sonic’s Class A common stock were outstanding under this plan during the year ended December 31, 2006. Sonic issues new shares of Class A common stock to employees and directors to satisfy its option exercise and stock grant obligations. To offset the effects of these transactions, Sonic will periodically buy back shares of Class A common stock after considering cash flow, market conditions and other factors.
F-30
SONIC AUTOMOTIVE, INC. AND SUBSIDIARIES
NOTES TO CONSOLIDATED FINANCIAL STATEMENTS—(Continued)
A summary of the status of the options related to the Stock Plans, 1997 Plan and the First American Plan is presented below:
| Options Outstanding |
Exercise Price Per Share |
Weighted Average Exercise Price |
Weighted Average Remaining Contractual Term |
Aggregate Intrinsic Value | ||||||||||
| (in thousands) | (in years) | (in thousands) | ||||||||||||
| Balance—December 31, 2006 |
4,734 | $ | 7.01-37.50 | $ | 20.24 | 6.00 | $ | 53,323 | ||||||
| Granted |
358 | 23.29-30.07 | 29.21 | |||||||||||
| Exercised |
(771 | ) | 7.01-26.92 | 17.43 | ||||||||||
| Forfeited |
(383 | ) | 13.12-37.50 | 25.95 | ||||||||||
| Balance—December 31, 2007 |
3,938 | $ | 7.80-37.50 | $ | 21.05 | 5.3 | $ | 9,707 | ||||||
| Exercisable |
3,069 | $ | 7.80-37.50 | $ | 19.92 | 4.5 | $ | 9,678 | ||||||
| December 31, | |||||||||
| 2005 | 2006 | 2007 | |||||||
| (amounts in thousands, except per option data) | |||||||||
| Weighted Average Grant-Date Fair Value of Options Granted |
$ | 7.50 | $ | 7.87 | $ | 8.24 | |||
| Intrinsic Value of Options Exercised |
$ | 3,565 | $ | 11,972 | $ | 9,226 | |||
| Fair Value of Shares Vested |
$ | 14,135 | $ | 4,356 | $ | 4,499 | |||
Sonic recognized compensation expense within selling, general and administrative expenses related to the options in the Stock Plans of $4.5 million and $5.6 million in the years ended December 31, 2006 and 2007, respectively. Tax benefits recognized related to the compensation expenses were $1.7 million and $2.1 million for the years ended December 31, 2006 and 2007, respectively. No compensation expense related to these plans was recorded in the year ended December 31, 2005. The total compensation cost related to unvested options not yet recognized at December 31, 2007 was $2.4 million and is expected to be recognized over a weighted average period of 0.5 years. Sonic received $13.4 million in cash from the exercise of stock options during the year ended December 31, 2007. Sonic’s tax benefit associated with these stock option exercises was $3.5 million during the year ended December 31, 2007.
Black-Scholes Assumptions
The weighted average fair value of options granted in each of the three years ended December 31, 2005, 2006 and 2007 was estimated using the Black-Scholes option pricing model with the following weighted average assumptions:
| 2005 | 2006 | 2007 | |||||||
| Stock Option Plans |
|||||||||
| Dividend yield |
2.02-2.50 | % | 1.82-2.06 | % | 1.60-2.06 | % | |||
| Risk free interest rates |
3.58-4.34 | % | 4.54-4.97 | % | 4.04-4.91 | % | |||
| Expected lives |
5 years | 3.5-5 years | 3.5-5 years | ||||||
| Volatility |
47.69% | 36.60% | 33.10% |
Sonic used an expected term of three and a half to five years for current year option grants based on several facts associated with past grants and exercises. First, the historical exercise experience indicates that the expected term is at least three years (consistent with the three year graded vesting period attached to the majority of these
F-31
SONIC AUTOMOTIVE, INC. AND SUBSIDIARIES
NOTES TO CONSOLIDATED FINANCIAL STATEMENTS—(Continued)
options) and the majority of Sonic’s grants are in the early to middle stages of their contractual terms of ten years; second, the contractual term of all of Sonic’s options is ten years; and third, since Sonic began granting stock options in 1997, none of these stock option grants have completed their contractual term of ten years.
Expected volatility was estimated using Sonic’s stock price over the last three years. Prior to this period, Sonic was a fast growing, new company in an un-established retail sector of the equity market. As such, the volatility of Sonic’s stock between 1997 and 2002 was higher than what is expected in the future due to a change in strategy that includes slowing the pace of acquisitions and the payment of quarterly dividends and the establishment of the retail automotive sector in the equity market.
Prior to the adoption of SFAS No. 123(R), Sonic accounted for stock option grants under the recognition and measurement provisions of APB Opinion No. 25, “Accounting for Stock Issued to Employees”, and related interpretations. In accordance with those provisions, because the exercise price of all options granted under those plans equaled the market value of the underlying stock at the grant date, no stock-based employee compensation cost was recorded in the accompanying financial statements for periods prior to January 1, 2006. Using the Black-Scholes option pricing model for all options granted, the following table illustrates what net income and earnings per share would have been if Sonic had applied the fair value recognition provisions of SFAS No. 123, “Accounting for Stock-Based Compensation”, to stock-based employee compensation for the year ended December 31, 2005:
| For the Year ended December 31, 2005 |
||||
| (dollars in thousands except per share amounts) |
||||
| Net income as restated |
$ | 91,861 | ||
| Fair value compensation cost, net of tax benefits of |
(5,523 | ) | ||
| Pro forma net income |
$ | 86,338 | ||
| Basic earnings (loss) per share: |
||||
| Net income as restated |
$ | 2.20 | ||
| Fair value compensation cost, net of tax |
(0.14 | ) | ||
| Pro forma net income |
$ | 2.06 | ||
| Diluted earnings (loss) per share: |
||||
| Net income as restated |
$ | 2.12 | ||
| Fair value compensation cost, net of tax |
(0.12 | ) | ||
| Pro forma net income |
$ | 2.00 | ||
A summary of the status of restricted stock and restricted stock unit grants related to the Stock Plans is presented below:
| Unvested Restricted Stock and Restricted Stock Units |
Weighted Average Grant Date Fair Value | |||||
| (in thousands) | ||||||
| Balance—December 31, 2006 |
265 | $ | 25.52 | |||
| Granted |
328 | 22.53 | ||||
| Forfeited |
(166 | ) | 23.76 | |||
| Vested |
(16 | ) | 25.68 | |||
| Balance—December 31, 2007 |
411 | $ | 23.76 | |||
F-32
SONIC AUTOMOTIVE, INC. AND SUBSIDIARIES
NOTES TO CONSOLIDATED FINANCIAL STATEMENTS—(Continued)
In the year ended December 31, 2007, approximately 328,000 restricted shares of Class A common stock and restricted stock units were awarded to Sonic’s Board of Directors, executive officers and other key associates under the 2004 Plan. The awards of restricted shares to directors were made pursuant to the 2005 Formula Plan and vest the day before the next annual meeting of Sonic’s stockholders. The awards to executive officers and other key associates were made in connection with establishing the objective performance criteria for 2007 incentive compensation and cliff-vest in three years. The shares and units awarded to executive officers and other key associates are subject to forfeiture, in whole or in part, based upon specified measures of Sonic’s earnings per share performance for the 2007 fiscal year, continuation of employment and compliance with any restrictive covenants contained in any agreement between Sonic and the respective officer and other key associates. These awards are generally subject to the same restrictions and rights as the shares of restricted stock granted to certain executive officers in 2005 and 2006, except that the restricted stock units do not have voting rights and that dividends on the restricted stock units are paid to the holders in the year subsequent to the dividend declarations. Sonic recognized compensation expense within selling, general and administrative expenses related to unvested restricted stock and restricted stock units of $1.3 million, $2.3 million and $0.9 million in the years ended December 31, 2005, 2006 and 2007, respectively. Tax benefits recognized related to the compensation expenses were $0.5 million, $0.9 million and $0.3 million for the years ended December 31, 2005, 2006 and 2007, respectively. Total compensation cost related to unvested restricted stock not yet recognized at December 31, 2007 was $6.2 million and is expected to be recognized over a weighted average period of 1.9 years.
| 11. | COMMITMENTS AND CONTINGENCIES |
Facility and Equipment Leases
During 2007, Sonic’s management decided to cease using several dealership properties which are leased under operating leases. Accordingly, accruals in the amount of $3.4 million were established in the year ended December 31, 2007 for the present value of the lease payments, net of estimated sublease rentals, for the remaining life of the operating leases and other accruals necessary to satisfy the lease commitment to the landlord. . Of the $3.4 million accrual established in the year ended December 31, 2007, $1.2 million was recorded in selling, general and administrative expenses and $2.2 million was recorded in discontinued operations. A summary of the activity of these operating lease accruals consists of the following:
| (dollars in thousands) | ||||
| Balance, December 31, 2006 |
$ | 8,731 | ||
| Lease exit expense |
3,370 | |||
| Payments |
(2,841 | ) | ||
| Reversals |
(1,096 | ) | ||
| Balance, December 31, 2007 |
$ | 8,164 | ||
F-33
SONIC AUTOMOTIVE, INC. AND SUBSIDIARIES
NOTES TO CONSOLIDATED FINANCIAL STATEMENTS—(Continued)
The Company leases facilities for the majority of its dealership operations under operating lease arrangements. These facility lease arrangements generally have fifteen to twenty year terms with one or two five year renewal options and do not contain provisions for contingent rent related to dealership’s operations. Approximately 20% of these facility leases are based on capitalization rates with payments that vary based on interest rates. The Company also leases certain equipment for use in dealership operations. These equipment lease arrangements generally have three to five year terms with one or two year renewal options. Minimum future lease payments for both facility and equipment leases and sub-leases to be received as required under noncancelable operating leases for both continuing and discontinued operations based on interest rates as of the inception of each lease are as follows:
| Year ending December 31, |
Future Minimum Lease Payments, Net |
Receipts from Future Subleases |
|||||
| (Dollars in thousands) | |||||||
| 2008 |
$ | 116,209 | $ | (9,492 | ) | ||
| 2009 |
$ | 105,943 | (8,490 | ) | |||
| 2010 |
$ | 101,280 | (7,729 | ) | |||
| 2011 |
$ | 97,326 | (7,175 | ) | |||
| 2012 |
$ | 93,162 | (7,123 | ) | |||
| Thereafter |
$ | 543,624 | (50,364 | ) | |||
Total lease expense for continuing operations in 2005, 2006 and 2007 was approximately $108.1 million, $114.6 million and $121.6 million, respectively. Total lease expense for discontinued operations in 2005, 2006 and 2007 was approximately $10.8 million, $22.3 million and $18.1 million, respectively. The total net contingent rent benefit relating to a decrease in interest rates since the underlying leases commenced for continuing operations in 2006 and 2007 was $3.1 million and $2.2 million, respectively. The total net contingent rent benefit relating to a decrease in interest rates since the underlying leases commenced for discontinued operations in 2006 and 2007 was $0.1 million and $0.3 million, respectively. Total contingent rent expense relating to an increase in interest rates since the underlying leases commenced for continuing and discontinued operations in 2007 was $2.1 million and $0.2 million, respectively.
Guarantees and Indemnifications
In accordance with the terms of Sonic’s operating lease agreements, Sonic’s dealership subsidiaries, acting as lessees, generally agree to indemnify the lessor from certain exposure arising as a result of the use of the leased premises, including environmental exposure and repairs to leased property upon termination of the lease. In addition, Sonic has generally agreed to indemnify the lessor in the event of a breach of the lease by the lessee.
In connection with franchise dispositions, certain of Sonic’s dealership subsidiaries have assigned or sublet to the buyer its interests in real property leases associated with such dealerships. In general, the subsidiaries retain responsibility for the performance of certain obligations under such leases, including rent payments, and repairs to leased property upon termination of the lease, to the extent that the assignee or sub lessee does not perform. These obligations are included within the future minimum lease payments, net, in the table above. However, there are situations where Sonic has assigned a lease to the buyer and Sonic was not able to obtain a release from the landlord. In these situations, although Sonic is no longer the primary obligor, Sonic is contingently liable if the buyer does not perform under the lease terms. The total estimated minimum lease payments remaining related to these leases totaled $1.9 million at December 31, 2007. However, in accordance with the terms of the assignment and sublease agreements, the assignees and sub lessees have generally agreed to indemnify Sonic and its subsidiaries in the event of non-performance. Additionally, in connection with certain
F-34
SONIC AUTOMOTIVE, INC. AND SUBSIDIARIES
NOTES TO CONSOLIDATED FINANCIAL STATEMENTS—(Continued)
dispositions, Sonic has obtained indemnifications from the parent company or owners of these assignees and sub lessees in the event of non-performance.
In accordance with the terms of agreements entered into for the sale of Sonic’s franchises, Sonic generally agrees to indemnify the buyer from certain liabilities and costs arising subsequent to the date of sale, including environmental exposure and exposure resulting from the breach of representations or warranties made in accordance with the agreement. While Sonic’s exposure with respect to environmental remediation and repairs is difficult to quantify, Sonic’s maximum exposure associated with these general indemnifications was $14.8 million at December 31, 2007. These indemnifications generally expire within a period of one to three years following the date of sale. The estimated fair value of these indemnifications was not material.
Legal Matters
Sonic is a defendant in the matter of Galura, et al. v. Sonic Automotive, Inc., a private civil action filed in the Circuit Court of Hillsborough County, Florida. In this action, originally filed on December 30, 2002, the plaintiffs allege that Sonic and Sonic’s Florida dealerships sold an antitheft protection product in a deceptive or otherwise illegal manner, and further sought representation on behalf of any customer of any of Sonic’s Florida dealerships who purchased the antitheft protection product since December 30, 1998. The plaintiffs are seeking monetary damages and injunctive relief on behalf of this class of customers. In June 2005, the court granted the plaintiffs’ motion for certification of the requested class of customers, but the court has made no finding to date regarding actual liability in this lawsuit. Sonic subsequently filed a notice of appeal of the court’s class certification ruling with the Florida Court of Appeals. In April 2007, the Florida Court of Appeals affirmed a portion of the trial court’s class certification, and overruled a portion of the trial court’s class certification. Sonic intends to continue its vigorous appeal and defense of this lawsuit and to assert available defenses. However, an adverse resolution of this lawsuit could result in the payment of significant costs and damages, which could have a material adverse effect on Sonic’s future results of operations, financial condition and cash flows. Currently, Sonic is unable to estimate a range of potential loss related to this matter.
Sonic is involved, and expects to continue to be involved, in numerous legal and administrative proceedings arising out of the conduct of Sonic’s business, including regulatory investigations and private civil actions brought by plaintiffs purporting to represent a potential class or for which a class has been certified. Although Sonic vigorously defends itself in all legal and administrative proceedings, the outcomes of pending and future proceedings arising out of the conduct of Sonic’s business, including litigation with customers, employment related lawsuits, contractual disputes, class actions, purported class actions and actions brought by governmental authorities, cannot be predicted with certainty. An unfavorable resolution of one or more of these matters could have a material adverse effect on Sonic’s business, financial condition, results of operations, cash flows or prospects. Included in other accrued liabilities at December 31, 2006 and 2007 were $2.0 million and $1.9 million, respectively, in reserves that Sonic has provided for pending proceedings.
F-35
SONIC AUTOMOTIVE, INC. AND SUBSIDIARIES
NOTES TO CONSOLIDATED FINANCIAL STATEMENTS—(Continued)
| 12. | SUMMARY OF QUARTERLY FINANCIAL DATA (UNAUDITED) |
The following table summarizes Sonic’s results of operations as presented in the Consolidated Statements of Income by quarter for 2006 and 2007.
| First Quarter |
Second Quarter |
Third Quarter |
Fourth Quarter | |||||||||
| (Dollars in thousands, except per share amounts) | ||||||||||||
| Year Ended December 31, 2006: |
||||||||||||
| Total revenues |
$ | 1,882,254 | $ | 2,071,736 | $ | 2,067,830 | $ | 1,963,259 | ||||
| Gross profit |
$ | 295,244 | $ | 312,014 | $ | 315,978 | $ | 305,055 | ||||
| Net income |
$ | 17,082 | $ | 12,188 | $ | 28,608 | $ | 23,239 | ||||
| Earnings per share—Basic |
$ | 0.41 | $ | 0.29 | $ | 0.68 | $ | 0.54 | ||||
| Earnings per share—Diluted |
$ | 0.39 | $ | 0.29 | $ | 0.65 | $ | 0.52 | ||||
| Year Ended December 31, 2007: |
||||||||||||
| Total revenues |
$ | 1,947,818 | $ | 2,089,976 | $ | 2,185,875 | $ | 2,113,264 | ||||
| Gross profit |
$ | 308,315 | $ | 325,939 | $ | 334,953 | $ | 322,378 | ||||
| Net income |
$ | 19,991 | $ | 26,368 | $ | 26,107 | $ | 23,036 | ||||
| Earnings per share—Basic |
$ | 0.47 | $ | 0.61 | $ | 0.61 | $ | 0.55 | ||||
| Earnings per share—Diluted |
$ | 0.44 | $ | 0.57 | $ | 0.58 | $ | 0.54 | ||||
| (1) | Operations are subject to seasonal variations. The first and fourth quarters generally contribute less operating profits than the second and third quarters. Parts and service demand remains more stable throughout the year. |
| (2) | The sum of diluted net income per share for the quarters may not equal the full year amount due to weighted average common shares being calculated on a quarterly versus annual basis. |
| (3) | Amounts presented differ from amounts previously reported on Form 10-Q due to the classification of certain franchises in discontinued and continuing operations in accordance with SFAS No. 144 (see Note 2). |
F-36