 Exhibit 99.2 |
| Exhibit 99.2 |
 Cautionary Notice Regarding Forward-Looking Statements •This presentation contains statements that constitute
“forward-looking statements” within the meaning of Section 27A of the Securities Act of 1933 and Section 21E of the Securities Exchange Act of 1934. •These forward-looking statements are not
historical facts, but only predictions by our company and/or
our company’s management. •These statements generally can be identified by
lead-in words such as
“believe,” “expect” “anticipate,” “intend,” “plan,” “foresee” and other similar words. Similarly, statements that describe our company’s objectives, plans or goals are also forward-looking statements. •You are cautioned that these forward-looking
statements are not guarantees of future performance and
involve risks and uncertainties, and that actual results may
differ materially from those projected in the forward-looking
statements as a result of various factors. Among others,
factors that could materially adversely affect actual results and performance include those risk factors that are listed in Sonic Automotive’s Form 10-K for the year ended December 31, 2007. |
 First Quarter 2008 Earnings Review April 29, 2008 |
 Discussion Topics 1 •Building for the long term Update on strategic initiatives •Quarter review •Questions •Closing comments |
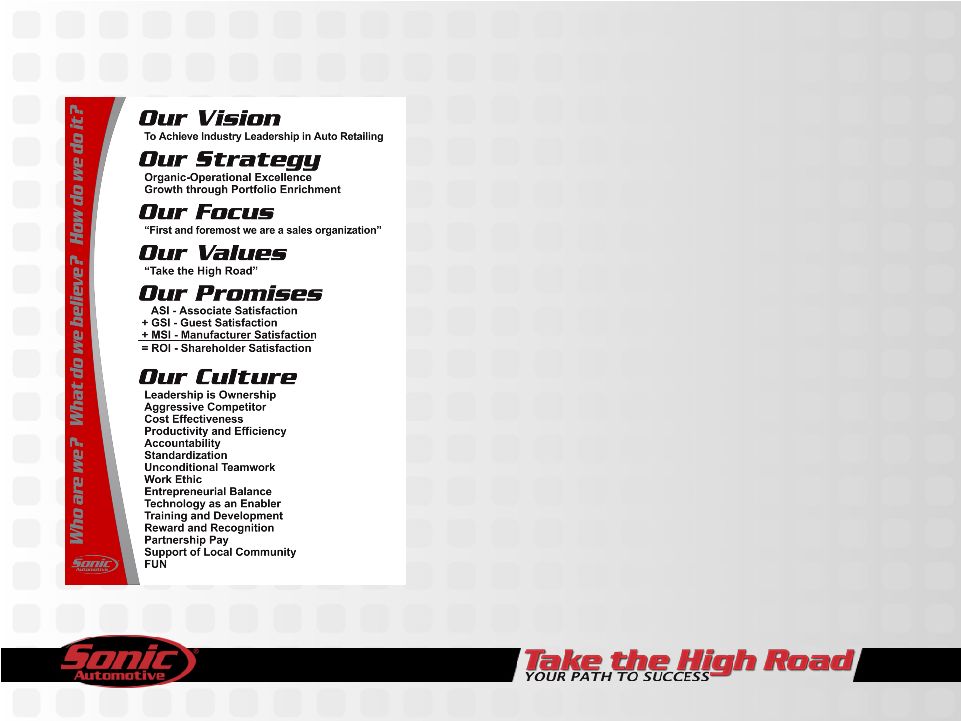
     Develop Associates Well Run Operations Valued Customers Grow the Business •Deliver Industry Leading Customer Experience •Differentiate through target based Marketing & eCommerce Web Infrastructure •Strengthen the Balance Sheet •Targeted Acquisitions & disposals •Optimize Cost Structure Sonic’s vision is to preserve the core automotive retail principles that have driven its past success and at the same time leverage the opportunities of scale. Building for the Long Term 2008 Strategic Focus 2 •Acquire, Develop, and Retain Top Talent •Launch Phase 1 of Best -in-class automotive retail training. •Institutionalize Operational Excellence •Standardize & Improve Sales & Marketing processes •Leverage common systems and centralize |
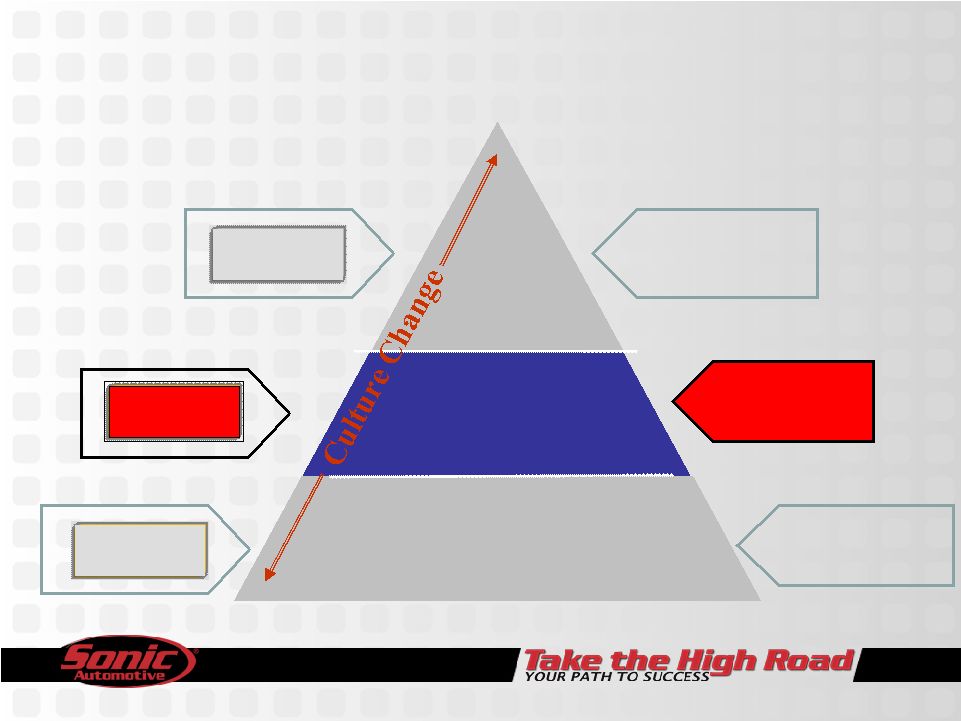 Building for the Long Term Used Vehicle Strategy Trade Trade Desk Desk Phase II – In Process Phase III Web-Tail Maximize Margin Maximize Margin Volume Growth Volume Growth Increased Profitability Increased Profitability Right inventory, Right Location, Right Price On-line Branding Virtual Lot Sonic “Auto Pilot” National National Inventory Inventory Optimization Optimization Interactive Internet Basic Process rollout (best practices) Less Wholesale/Keep more trades Common Technology (S.I.M.S) Inventory Control Process Standardization Phase I - Complete 3 |
 Building for the Long Term The Quarter in Review • Business performed well in tough environment • On track with internal expectations – reaffirming full year guidance • Total revenue up – New vehicle environment challenging – Used volume continues to be a strength • Sticking with our strategy – Investment in Associates and technology progressing as planned 4 |
 Financial Performance 1.0% 2.5% (9.6%) (19.0%) (28.9%) (10.3%) (20.5%) 30bps 30bps 5 2008 2007 Better/ (Worse) Revenue $1,901 $1,883 $18 Gross Profit $306 $298 $7 – Margin 16.1% 15.8% Operating Income – Amount $55 $61 ($6) – Margin 2.9% 3.2% Net Income – Continuing Operations $18.0 $22.3 ($4.2) – Total Operations 14.2 20.0 (5.8) EPS - Diluted – Continuing Operations $0.44 $0.49 ($0.05) – Total Operations 0.35 0.44 (0.09) Q1 |
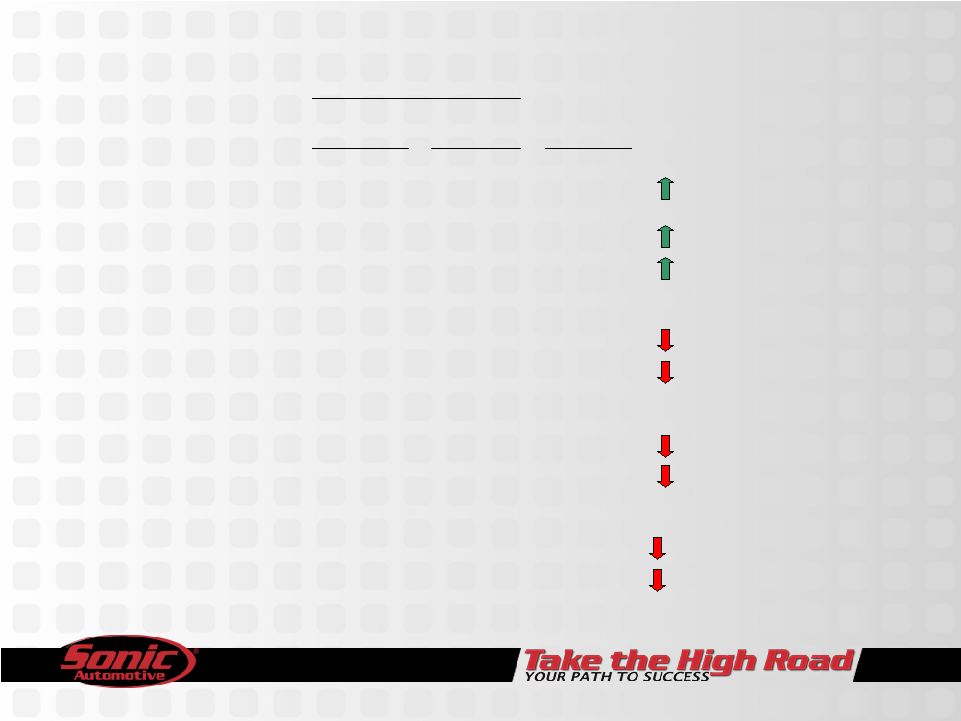
 Same Store Revenue Growth – Q1 2008 • Challenging new vehicle environment • Used retail volume, F&I and customer pay expanding (8.2%) 11.5% 0.7% 5.9% (2.9%) (23.5%) (4.0%) New Used Fixed Operations F&I Sub Total Wholesale Total 6 |
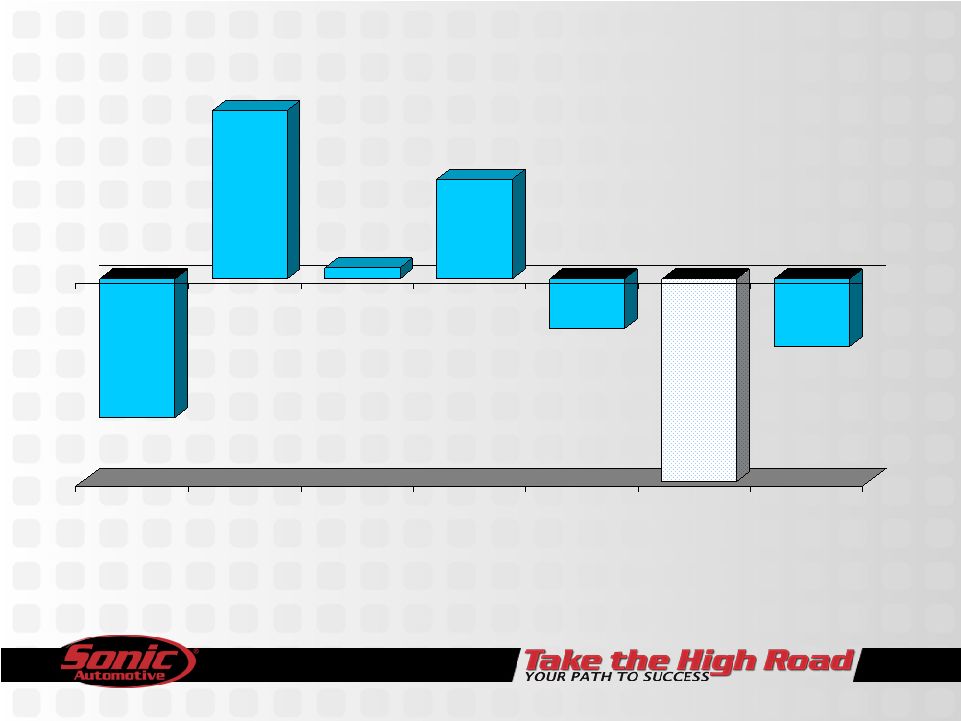
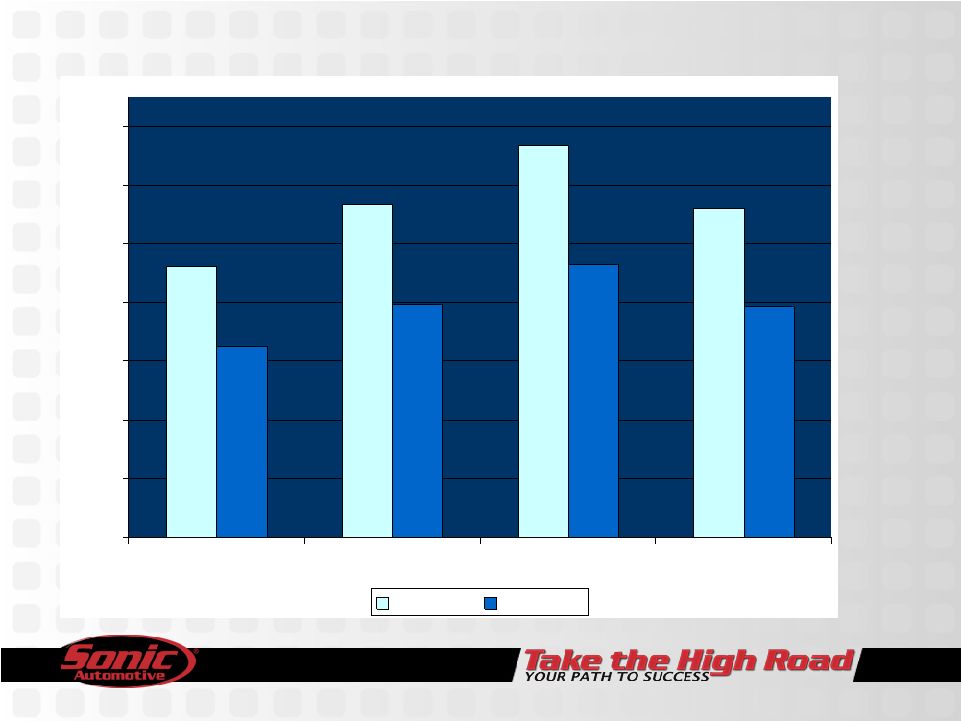
 -12.0% -7.0% -2.0% 3.0% 8.0% 13.0% 18.0% 23.0% Sonic -8.7% 10.2% 20.5% Industry -10.9% 2.1% 0.8% Q1 New** Q1 Used* CPO Q1 New, Used, & CPO Retail Unit Sales Same Store vs. Industry *National Franchised Dealers Focus on used vehicles is paying off *National franchise dealers **Excluding fleet – with fleet, industry off 8.0% 7 |
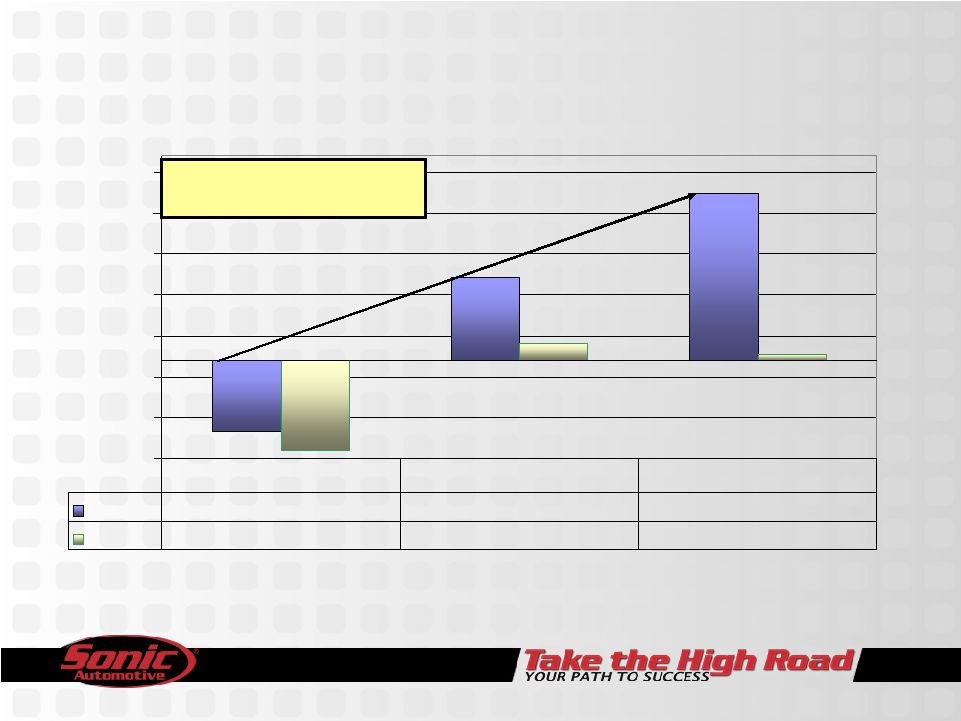
 $984 $1,027 $1,067 $1,024 $930 $959 $986 $957 800 840 880 920 960 1,000 1,040 1,080 Q3 '07 Q4 '07 Q1 '08 Last 3 Qtr 2007/2008 2006/2007 F&I – Same Store 8 |
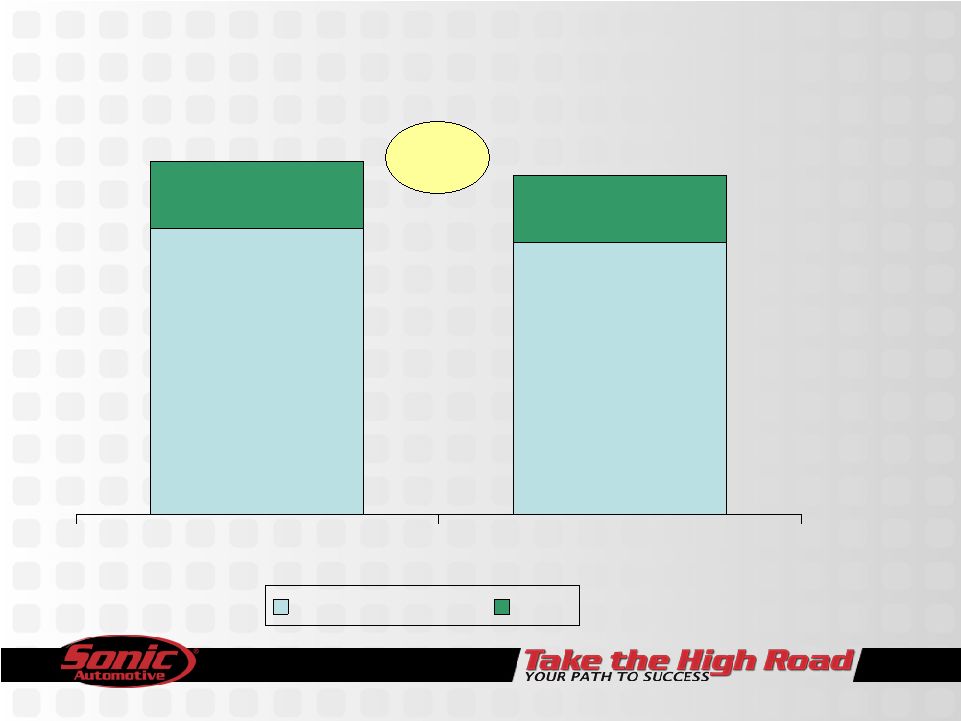 8.5% 69.1% 70.9% 8.4% Q1 2008 Q1 2007 All Other SG&A Rent SG&A Expenses as % of Gross Profit 77.6% 79.3% 170 bps 9 |
 Inventory Management Days Supply 10 Mar-08 Mar 08 Industry New Vehicles Domestic (excluding Cadillac) 63.1 73.1 Luxury ( including Cadillac) 66.0 53.5 Import 58.6 53.2 Overall 63.1 62.6 Used Vehicles 35.7 |
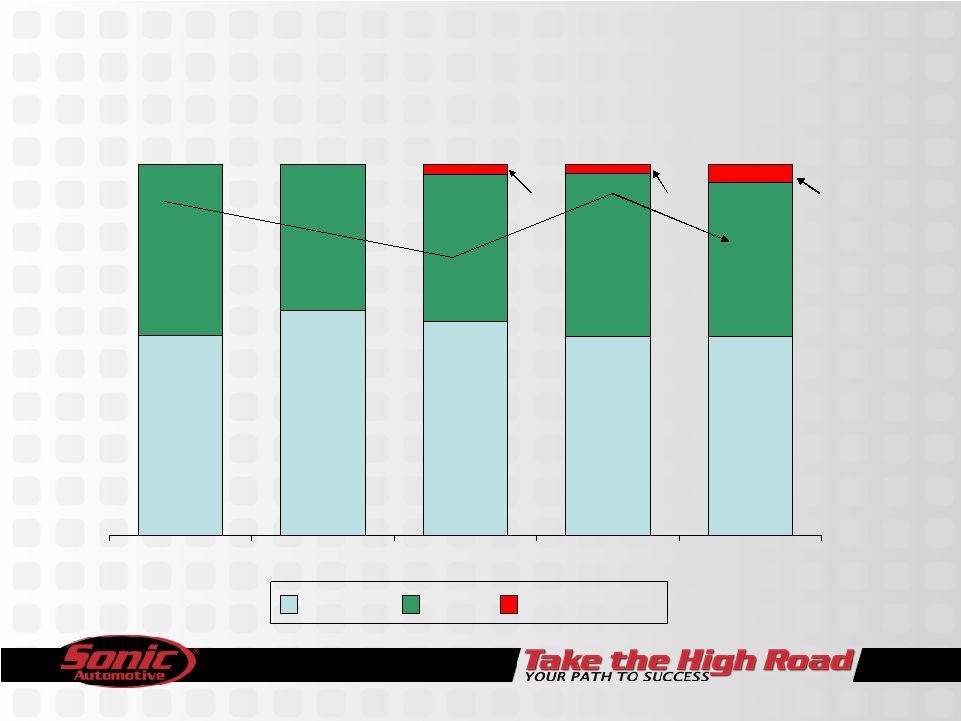 Capitalization 53.7% 53.7% 57.6% 60.6% 54.0% 46.0% 39.4% 39.6% 43.7% 41.4% 2005 2006 2007 Act Q1 2008 Pro Forma Q1 2008 Equity Debt Mortgages 46.3% 42.4% 46.3% Debt to Cap With Mortgages 2.8% 2.6% 4.9% 11 |
 Summary • Reaffirming full year guidance – we are on the right track • In a difficult economic environment, Sonic expanded revenue in Used, F&I and Fixed Operations • Sticking to our strategy – Investing in our people – Digital marketing – Technology – Phase II of our used vehicle process • Q2 Outlook – New vehicle environment challenging in terms of both volume and gross
margin – Consumer confidence low • We are building for the long term 12 |
 |