 Exhibit 99.2 |
| Exhibit 99.2 |
 Cautionary Notice Regarding Forward-Looking Statements •This presentation contains statements that constitute
“forward-looking statements” within the meaning of Section 27A of the Securities Act of 1933 and Section 21E of the Securities Exchange Act of 1934. •These forward-looking statements are not
historical facts, but only predictions by our company and/or
our company’s management. •These statements generally can be identified by
lead-in words such as
“believe,” “expect” “anticipate,” “intend,” “plan,” “foresee” and other similar words. Similarly, statements that describe our company’s objectives, plans or goals are also forward-looking statements. •You are cautioned that these forward-looking
statements are not guarantees of future performance and
involve risks and uncertainties, and that actual results may
differ materially from those projected in the forward-looking
statements as a result of various factors. Among others,
factors that could materially adversely affect actual results and performance include those risk factors that are listed in Sonic Automotive’s Form 10-Q for the year ended March 31, 2008. |
 Second Quarter 2008 Earnings Review July 29, 2008 |
 Building for the Long-Term The Quarter in Review Produced solid results in tough environment • Outperformed industry • Expanded used retail volume, F&I PUR • Controlled inventory What are we doing now? PLENTY! • Ongoing expense initiatives • Streamlined field operations • Refined focus on fixed operations Sticking with our long-term strategy • 2008 initiatives – Training, e-commerce, enhanced customer experience • Focus on the higher margin segments of the business • Sound spending principles • Portfolio enrichment / grow the business |
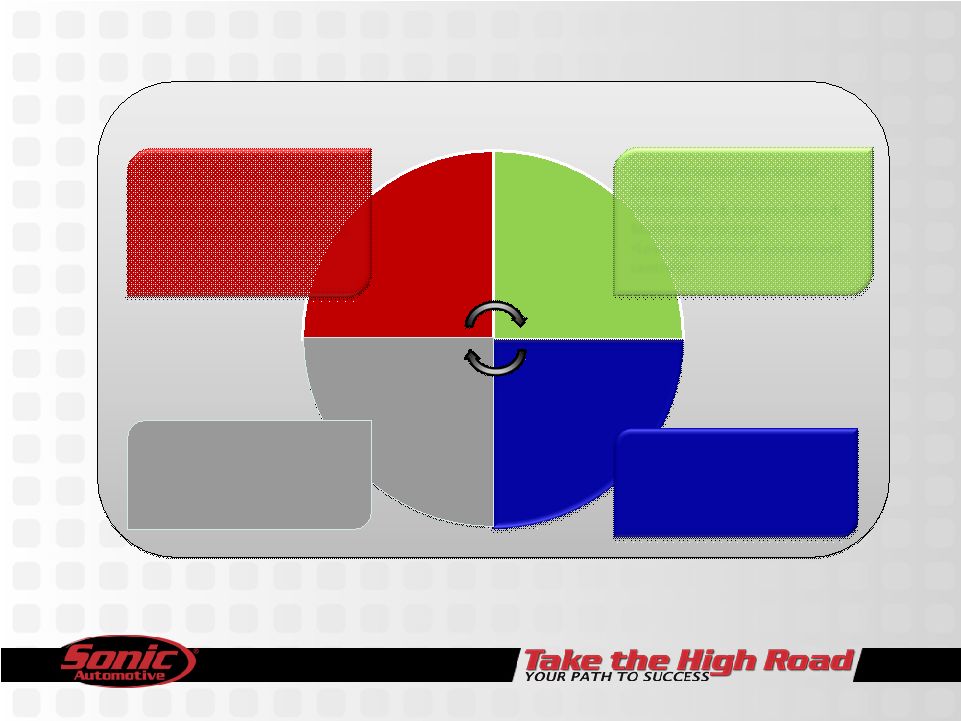     Develop
Associates Well Run Operations Valued Customers Grow the Business •Institutionalize Operational
Excellence •Standardize & Improve Sales &
Marketing processes •Leverage common systems and
centralize •Deliver Industry Leading
Customer Experience •Differentiate through target
based Marketing & eCommerce Web Infrastructure •Acquire, Develop, and Retain
Top Talent •Launch Phase 1 of
Best-in- class automotive retail training. •Strengthen the Balance
Sheet •Targeted Acquisitions & disposals •Optimize Cost Structure
Sonic’s vision is to preserve the core automotive retail principles
that have driven its past success and at the same time leverage the opportunities of scale. Building for the Long-Term 2008 Strategic Focus |
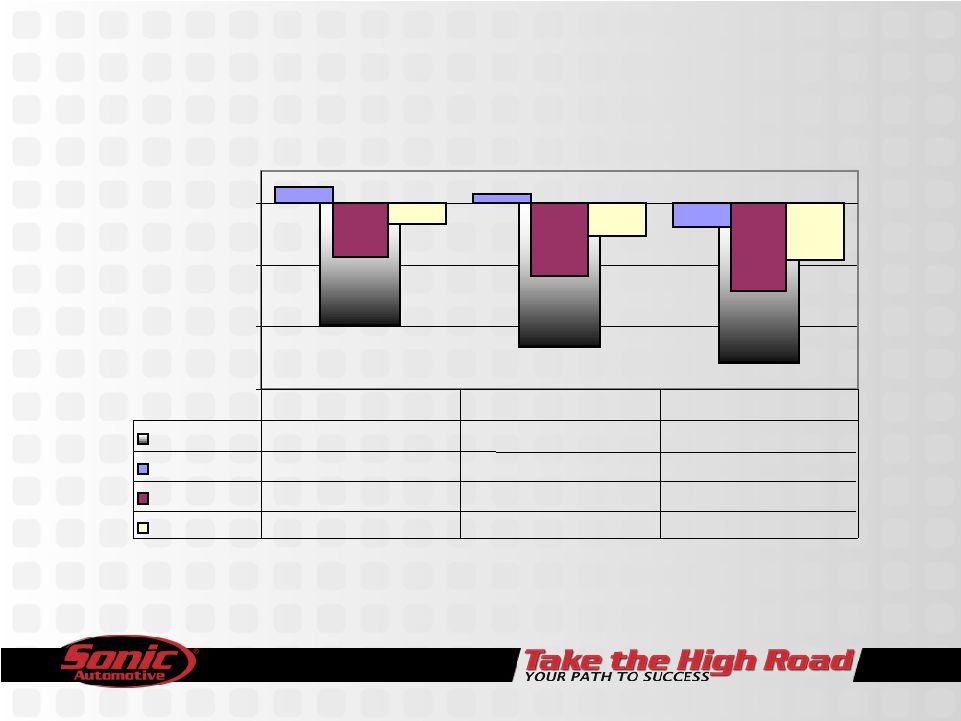
 Financial Performance (1.7%) (1.0%) (18.0%) (30.2%) (59.0%) (21.0%) (52.6%) 60bps 10bps 2008 2007 Better/ (Worse) Revenue $1,980 $2,015 ($35) Gross Profit $311 $314 ($3) – Margin 15.7% 15.6% Operating Income – Amount $60 $73 ($13) – Margin 3.0% 3.6% Net Income – Continuing Operations $20.1 $28.8 ($8.7) – Total Operations 10.8 26.4 (15.6) EPS - Diluted – Continuing Operations $0.49 $0.62 ($0.13) – Total Operations 0.27 0.57 (0.30) Q2 (amounts in millions, except per share data) |
 Q2 2008 Amount After Taxes (000's) Loss from Operations (3,369) $ Asset Impairments (3,010) Lease Exit Accruals (529) Loss on Disposal (2,414) Subtotal (5,953) Total (9,322) $ Discontinued Operations Non-Cash |
 New Vehicle Industry/Consumer Confidence Trends Year over Year (60.0%) (40.0%) (20.0%) 0.0% Cons Conf (39.6%) (46.5%) (51.5%) Car 5.2% 2.4% (7.9%) Truck (17.4%) (23.6%) (28.4%) Total (6.9%) (10.7%) (18.3%) Apr May June |
 Days Supply Jun-08 Jun 08 Industry New Vehicles Domestic 61.2 77.7 Luxury 65.9 58.3 Import 48.9 49.0 Overall 60.1 62.8 Used Vehicles 30.4 Note: Industry truck days supply was 90 at the end of June, while car
inventory was 41. |
 Gross Margin % (Continuing Operations) New vehicle factors: • Industry days supply on trucks, shortage of hot selling models • Shift to less expensive vehicles Used vehicle factors: • Less trades coming in, more purchases • Large % CPO • Truck / SUV values plunged Fixed Operations: • Softening demand • Shift to lower margin services 2008 2007 B / (W) New - Retail 7.5% 7.4% 10 bps Used 8.5% 9.3% (80) bps Fixed Ops 50.0% 50.8% (80) bps |
 Same Store Revenue Change – Q2 2008 • F&I per unit increased $27 or 2.7% • Certified pre-owned volume up 23.9% (11.7%) 2.7% (0.8%) (2.1%) (7.2%) (18.8%) (7.8%) New Used Fixed Operations F&I Sub Total Wholesale Total |
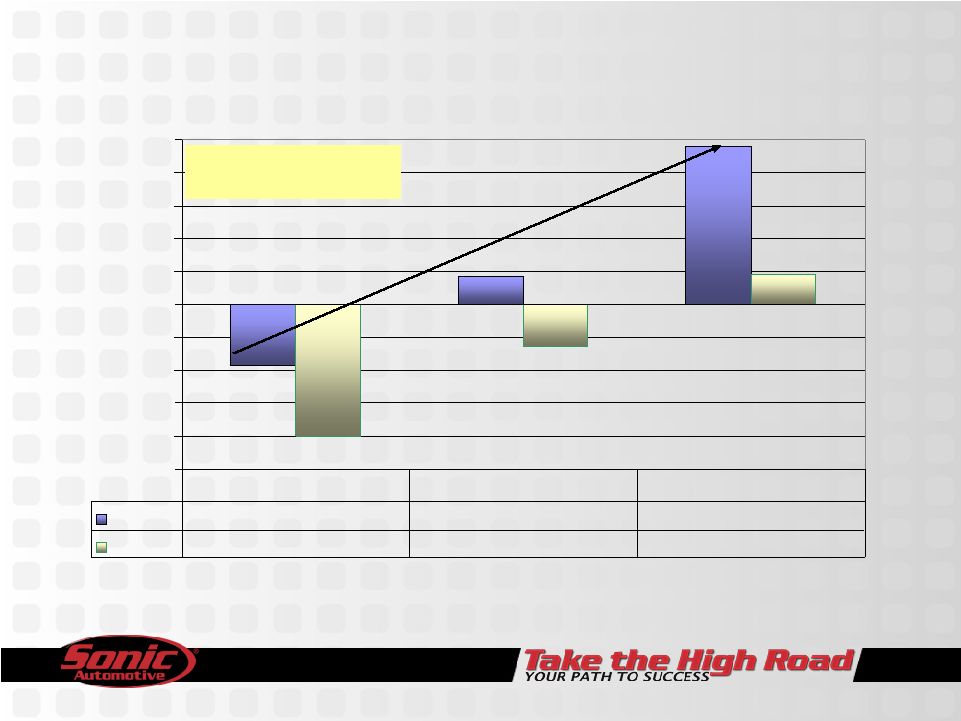 New, Used, & CPO Retail Unit Sales Same Store vs. Industry *National Franchised Dealers *National franchise dealers **Excluding fleet – with fleet, industry off 12.0% (25.0%) (20.0%) (15.0%) (10.0%) (5.0%) 0.0% 5.0% 10.0% 15.0% 20.0% 25.0% Sonic (9.2%) 4.3% 23.9% Industry (20.0%) (6.5%) 4.6% Q2 New** Q2 Used* CPO Q2 Focus on used vehicles continues to pay off |
 Fixed Operations Same Store 0.4% (4.0%) (0.8%) (5.0%) (3.0%) (1.0%) 1.0% Customer Pay Warranty Total |
 8.3% 70.3% 70.9% 66.2% 6.9% 7.9% Q2 2007 Q1 2008 Q2 2008 All Other SG&A Q2 08 Hail Damage Rent SG&A Expenses as % of Gross Profit 74.1% 77.9% 79.2% 0.7% |
 Capitalization 54.8% 53.7% 57.6% 60.6% 54.0% 46.0% 39.4% 39.5% 43.6% 39.2% 2005 2006 2007 Q1 2008 Q2 Proforma Equity Debt Mortgages 46.3% 42.4% 45.2% Debt to Cap With Mortgages 2.9% 2.7% 6.0%* *includes mortgages set to close in August |
 Forecast Assumptions Original Revised Forecast Forecast Same Store Sales: New Units* (4.5%) (7.2%) Used Units 3.0% 4.4% Fixed Operations Revenue 3.5% (0.5%) Hail Loss - $2.0M Bond Redemption Premium (Int Exp) - $1.0M LIBOR Rate 3.5% - 4.5% 2.5% - 3.0% SAAR 15.5M 14.5M *Includes fleet |
 Summary • Delivered sound results in a difficult environment • Sticking to our strategy – Focus on higher margin business – Investing in our people, alignment of regional teams – Digital marketing – Technology • Q3 Outlook – New vehicle environment will continue to be very challenging – New and Used gross margin pressure – Low consumer confidence low + higher energy prices = slower consumer
spending • We are building for the long-term |
 |