 Exhibit 99.2 |
| Exhibit 99.2 |
 Cautionary Notice Regarding Forward-Looking Statements •This presentation contains statements that constitute
“forward-looking statements” within the meaning of Section 27A of the Securities Act of 1933 and Section 21E of the Securities Exchange Act of 1934. •These forward-looking statements are not
historical facts, but only predictions by our company and/or
our company’s management. •These statements generally can be identified by
lead-in words such as
“believe,” “expect” “anticipate,” “intend,” “plan,” “foresee” and other similar words. Similarly, statements that describe our company’s objectives, plans or goals are also forward-looking statements. •You are cautioned that these forward-looking
statements are not guarantees of future performance and
involve risks and uncertainties, and that actual results may
differ materially from those projected in the forward-looking
statements as a result of various factors. Among others,
factors that could materially adversely affect actual results and performance include those risk factors that are listed in Sonic Automotive’s Form 10-Q for the quarter ended June 30, 2008. |
 Third Quarter 2008 Earnings Review October 28, 2008 |
 Sonic Automotive Q3 2008 Conference Call Topics Overview of the Quarter Vision & Strategy / Investment Principles Operational Priorities Financial Review Closing Comments |
 Building for the Long-Term The Quarter in Review External Operating Environment •Hurricane, credit, consumer confidence •SAAR Impairment Charges Internal Operating Environment •Realignment – team aligned, focused on generating revenue / cash
|
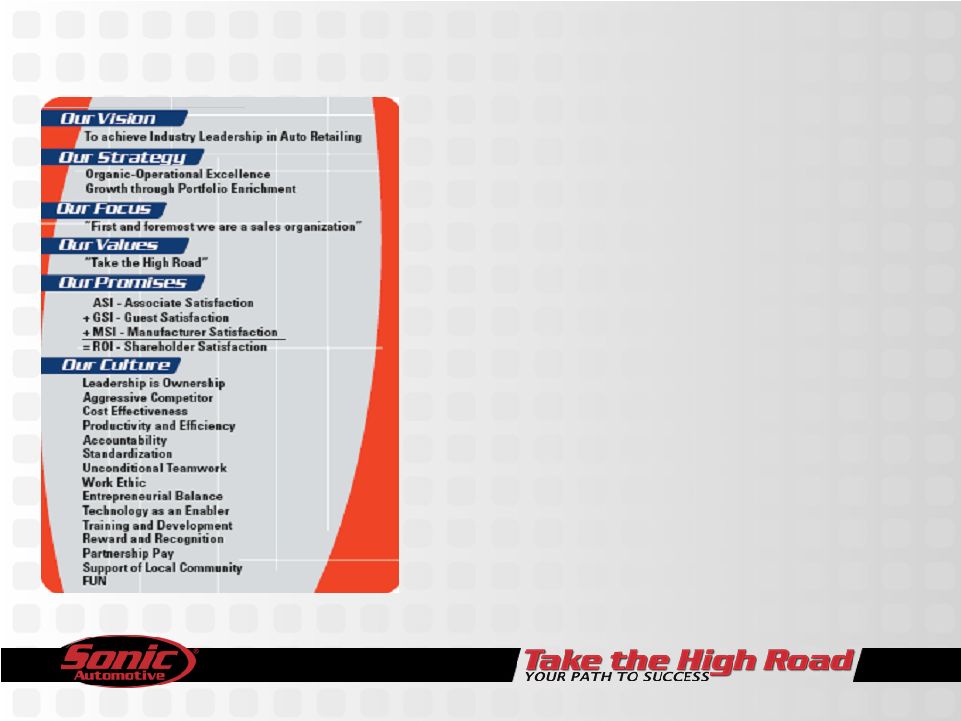 Building for the Long-Term Vision and Strategy • Our Vision – To Achieve Industry Leadership in Automotive Retailing • Our Strategy – Operational Excellence – Growth through Portfolio Enrichment |
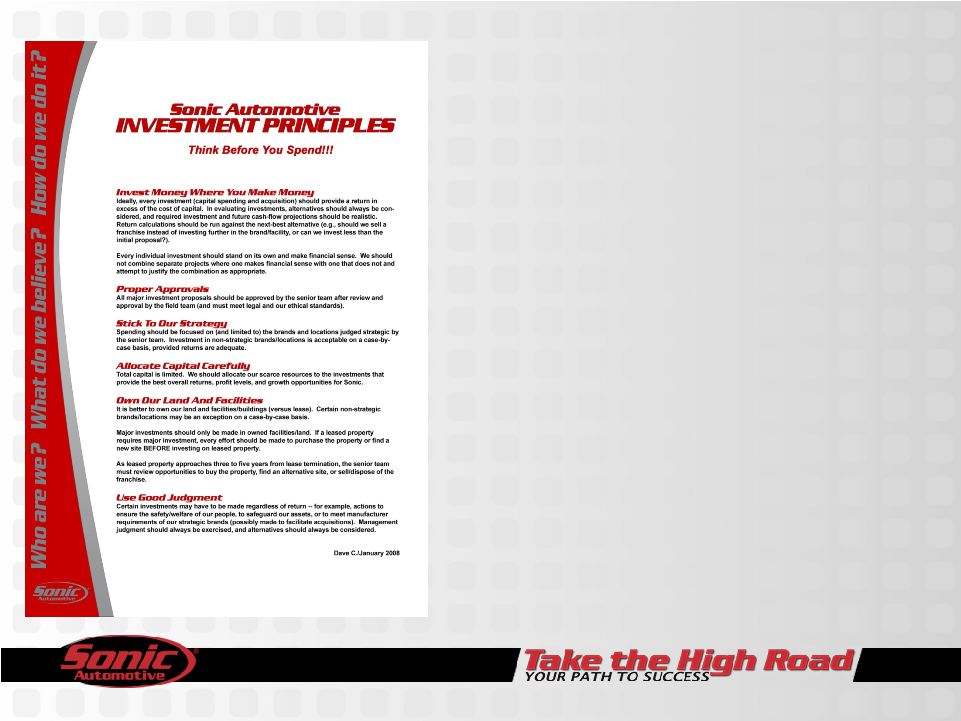 • First Order – Stop Making Stupid Mistakes – Stop Friendly Fire • Principles – Guide decision making – Discipline to stick to them Building for the Long-Term Investment Principles |
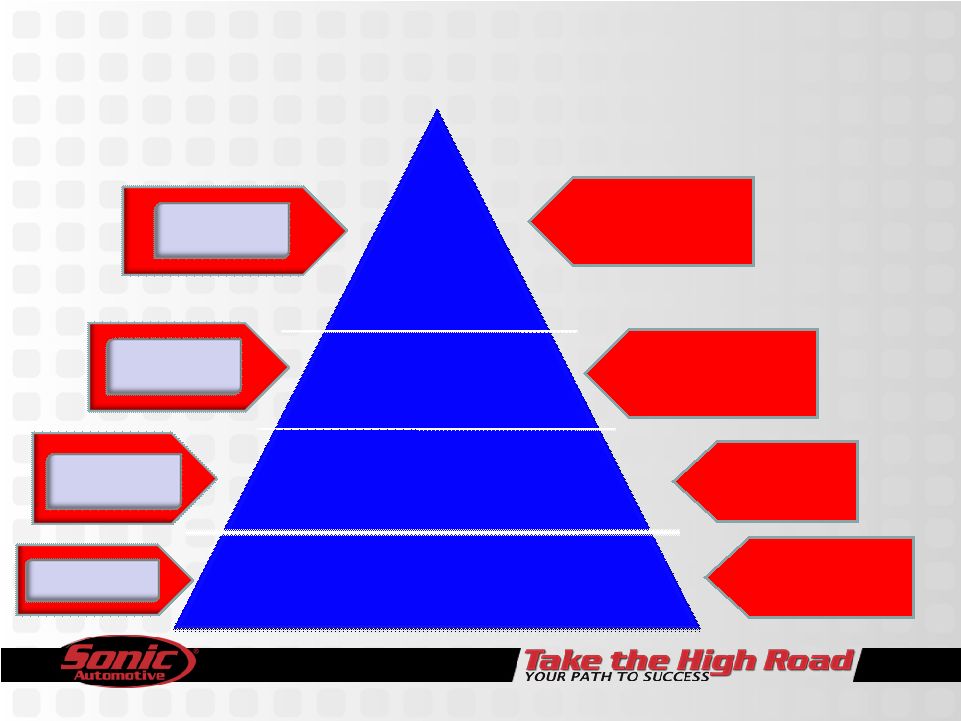
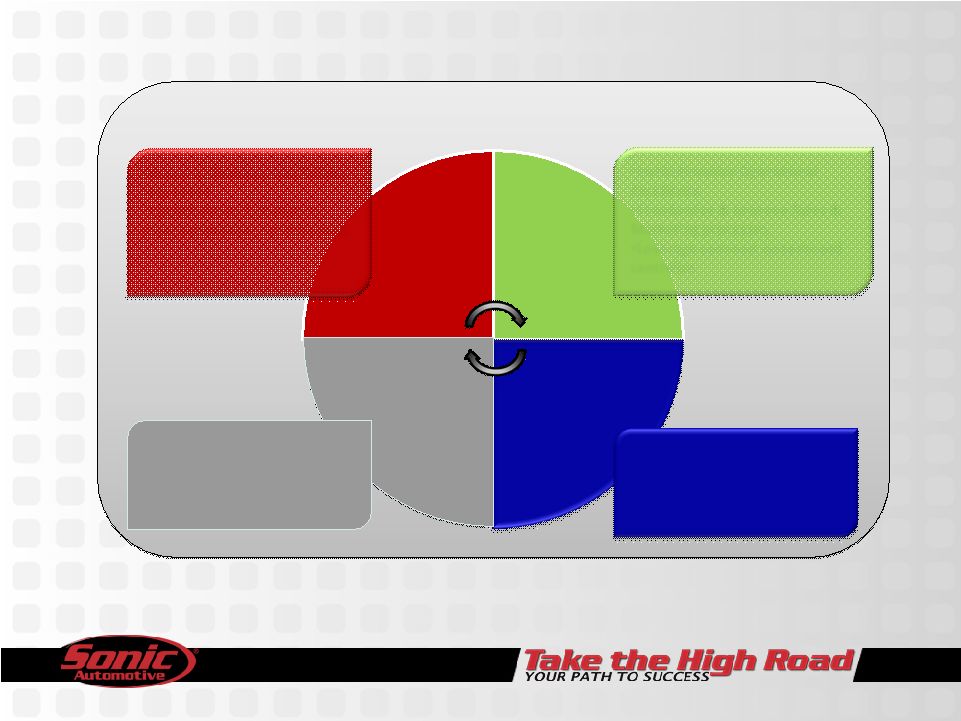     Develop
Associates Well Run Operations Valued Customers Grow the Business •Institutionalize Operational
Excellence •Standardize & Improve Sales &
Marketing processes •Leverage common systems and
centralize •Deliver Industry Leading
Customer Experience •Differentiate through target
based Marketing & eCommerce Web Infrastructure •Acquire, Develop, and Retain
Top Talent •Launch Phase 1 of
Best-in- class automotive retail training. •Strengthen the Balance
Sheet •Targeted Acquisitions & disposals •Optimize Cost Structure
Sonic’s vision is to preserve the core automotive retail principles that have driven its past success and at the same time leverage the opportunities of scale. Building for the Long-Term 2008 Strategic Focus |
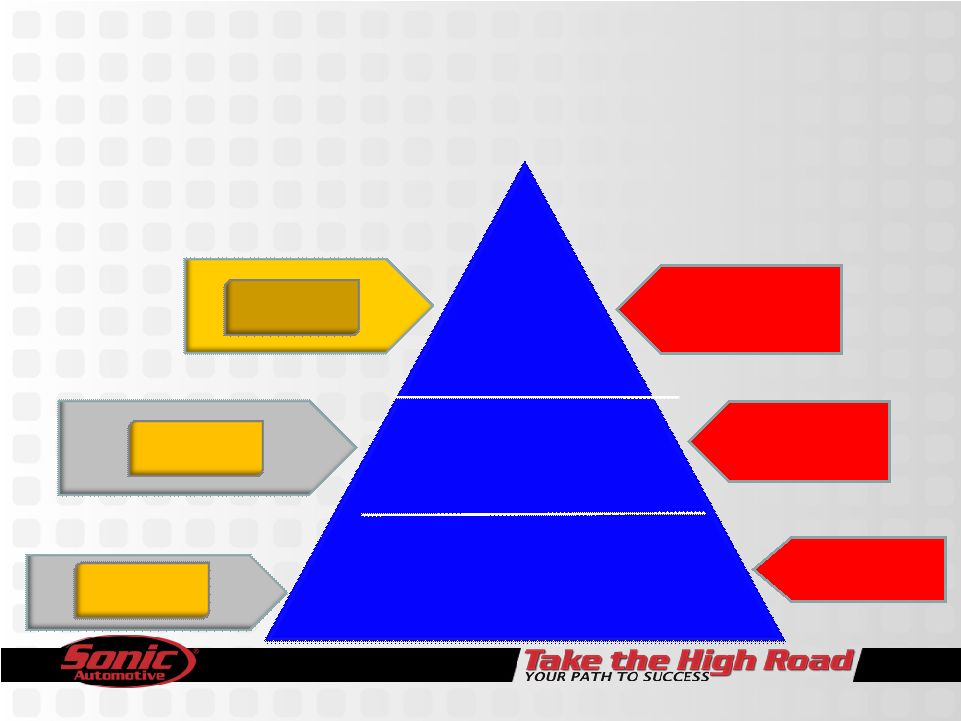 Operating Priorities Used Vehicle Strategy Trade Desk Phase II Phase III Web-Tail Maximize Margin Improved Turns Increased Profitability Right inventory, Right Location, Right Price On-line Branding Virtual Lot Optimizing Inventory Market Shift to Consumer Control Basic Process rollout Less Auction Activity Common Technology 5 Inventory Control Process Standardization Phase I |
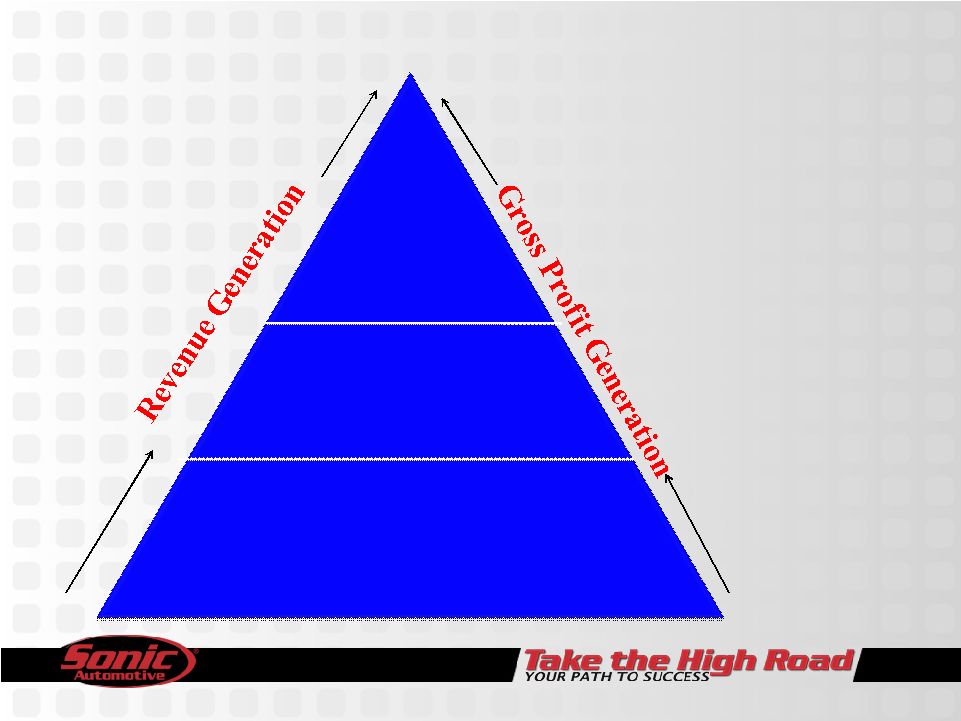 Operating Priorities Fixed Operations Strategy Phase II Sales Training and Merchandising Phase I Standardized Menu Utilization and Pricing Structure Phase III Technology Complete Q4 2009 Complete Q3 2009 Complete Q1 2009 |
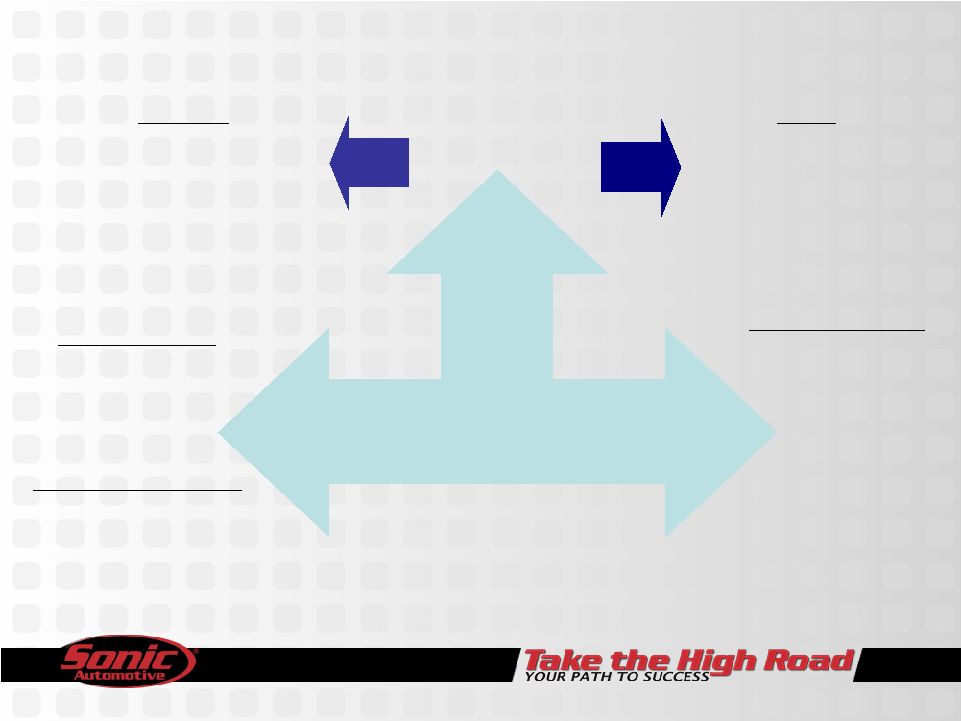
 Merchandising Action Build customer –friendly websites that create engagement Deliver the offer – buy here, buy now Online App’ts Right Inventory Video Fixed Operations Used Vehicles New Vehicles Drive more traffic through more targeted marketing Traffic Generation Meet the Customer on Their Terms Operating Priorities Internet Lead Strategy Fulfill
the customer experience through disciplined Sales Process Dealership Sales Team Search Engine Optimization |
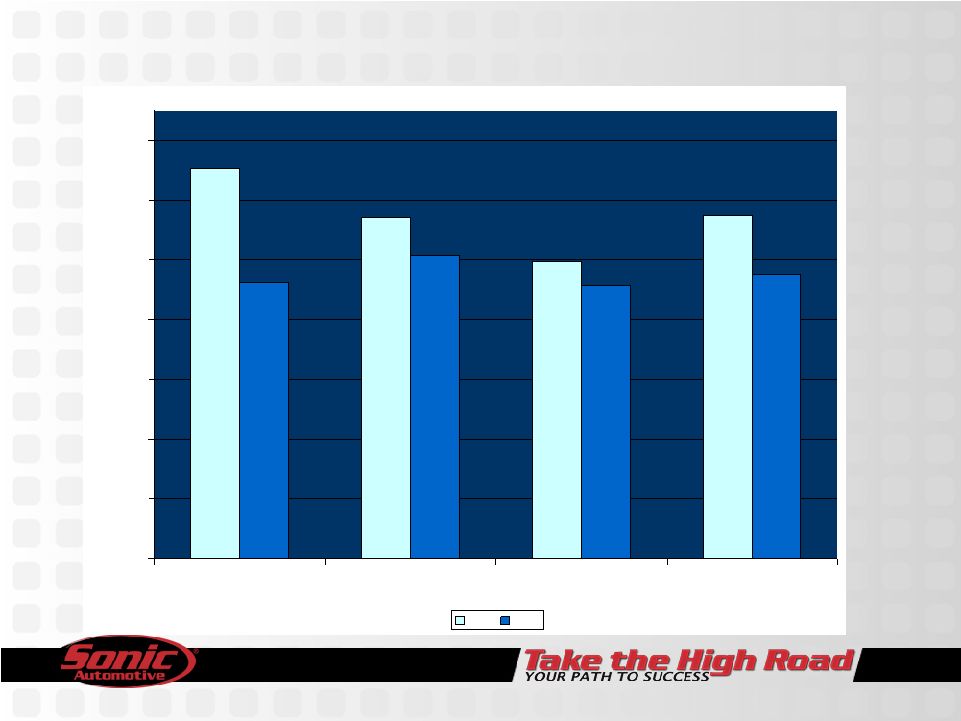 Operating Priorities F&I – Same Store $1,061 $1,028 $999 $1,030 $985 $1,003 $983 $990 800 840 880 920 960 1,000 1,040 1,080 Q1 '08 Q2 '08 Q3 '08 Last 3 Qtr 2008 2007 |
 Operating Priorities Expense Management Inventory Advertising Headcount Controlling Inventory New – 60.1 Used – 32.2 Parts – 36.4 Reduce Floorplan expense Free up frozen cash Reduce bad debt Right size to new environment Compared to Q3 07 In terms of dollars
down $2.8m or 16.2% In terms of gross profit 5.1% down 20bps Focus on Ad Effectiveness Internet Fixed Pre owned Dealership Reduced annual expenses by over $7.0 million which will begin to be realized in Q4 and moving forward Region Restructured regional staff ($4.6m savings) Leverage of our staff’s expertise |
 Geographic / Brand Review New Vehicle • California – 30% of total new vehicle revenue – Brand mix: 70% Luxury, 28% Mid-Line Imports and 2% Domestic • Texas – 26% of total new vehicle revenue – BMW, Chevrolet and Ford brands outpaced local market during the
quarter. • Florida – 6% of total revenues, dependant on Cadillac • Brand Commentary – Cadillac is difficult – BMW/Mini – 22% of total new vehicle revenue • BMW gaining share in local markets; Mini sales up; – Honda - 16% of total new vehicle revenue • Gaining or maintaining share in markets; 44% of unit volume comprised of CA
dealerships – Mercedes – 11% of total new vehicle revenue • Outperforming local markets – C Class, E Class sales good |
 Financial Performance (amounts in millions, except per share data) (15.5%) (11.8%) (43.6%) (68.9%) (72.4%) (63.2%) (67.2%) 320bps 70bps (1) – Includes estimated $0.08/diluted share loss associated with Hurricane
Ike (2) - Excludes continuing ops and discontinued ops after tax charges of $21.0
million and $11.9 million, respectively 2008 2008 Better/ Actual (1) Adjusted (1)(2) 2007 (Worse) Revenue $1,785 $1,785 $2,112 ($327) Gross Profit $286 $286 $324 ($38) – Margin 16.0% 16.0% 15.3% Operating Income – Amount $9 $44 $78 ($34) – Margin 0.5% 2.5% 3.7% Net Income – Continuing Operations ($11.4) $9.6 $30.9 ($21.3) – Total Operations ($25.3) $7.2 $26.1 ($18.9) EPS - Diluted – Continuing Operations ($0.28) $0.25 $0.68 ($0.43) – Total Operations ($0.63) $0.19 $0.58 ($0.39) Q3 |
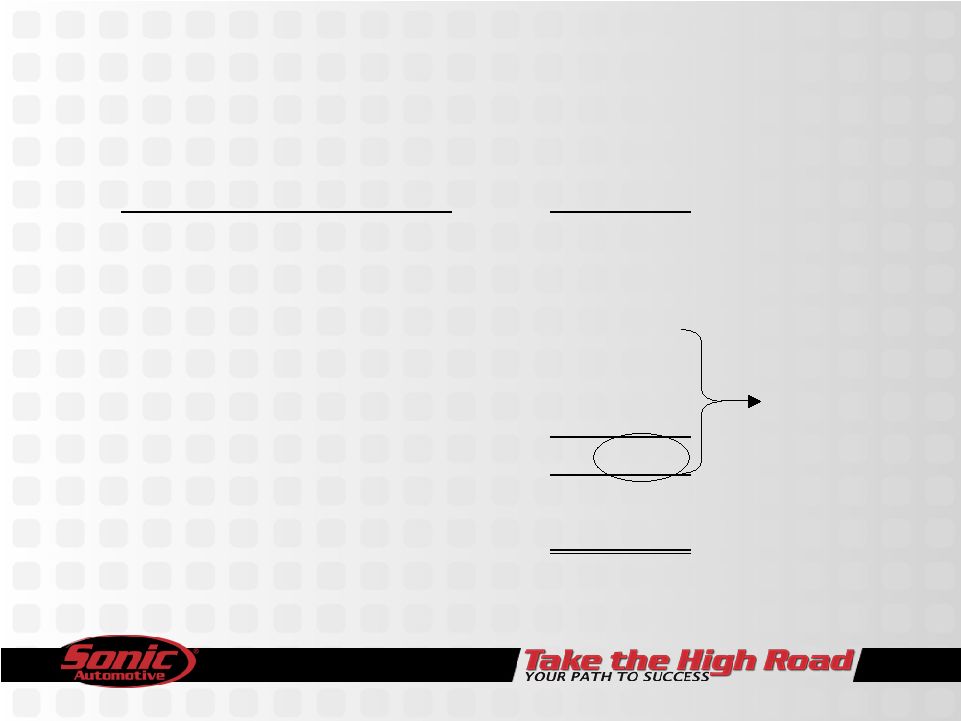 Q3 2008 Amount After Taxes (000's) Loss from Operations (2,011) $ Asset Impairments (4,212) Lease Exit Accruals (7,649) Loss on Disposal (96) Subtotal (11,957) Total (13,968) $ Discontinued Operations Non-Cash |
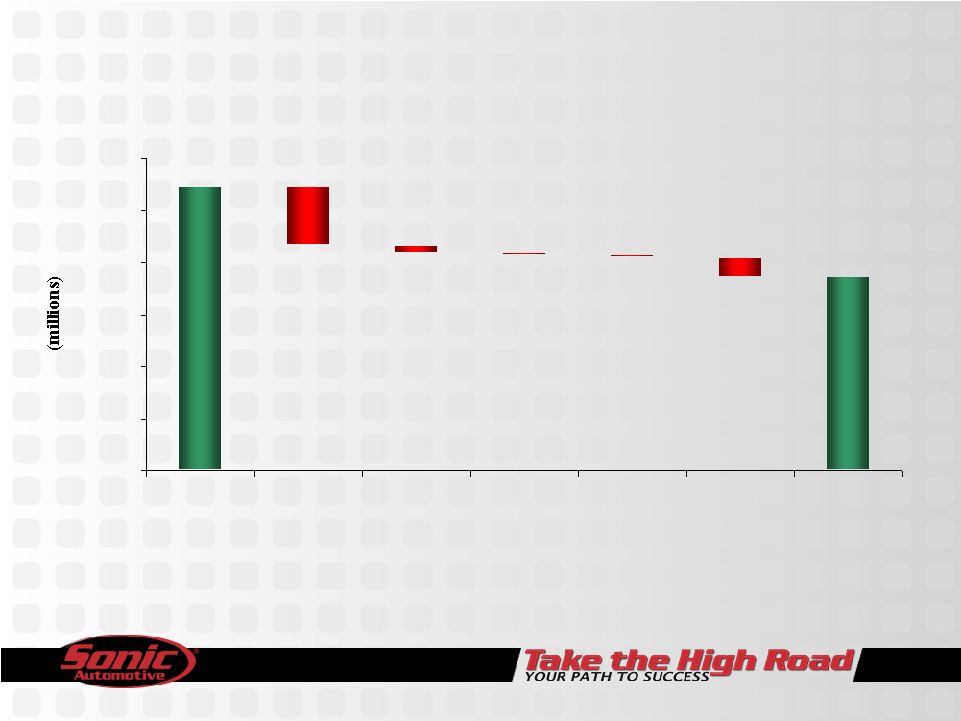 Same Store Revenue Change – Q3 2008 $1,000 $1,200 $1,400 $1,600 $1,800 $2,000 $2,200 Prior Year New Retail Used Retail F&I Fixed Ops Rev Other* Current Year $2,088 ($224) ($28) ($7) ($11) ($72) $1,746 Volume Rate: 12.6% Vol: 87.4% Volume *The “Other” Category includes used wholesale and fleet revenue
|
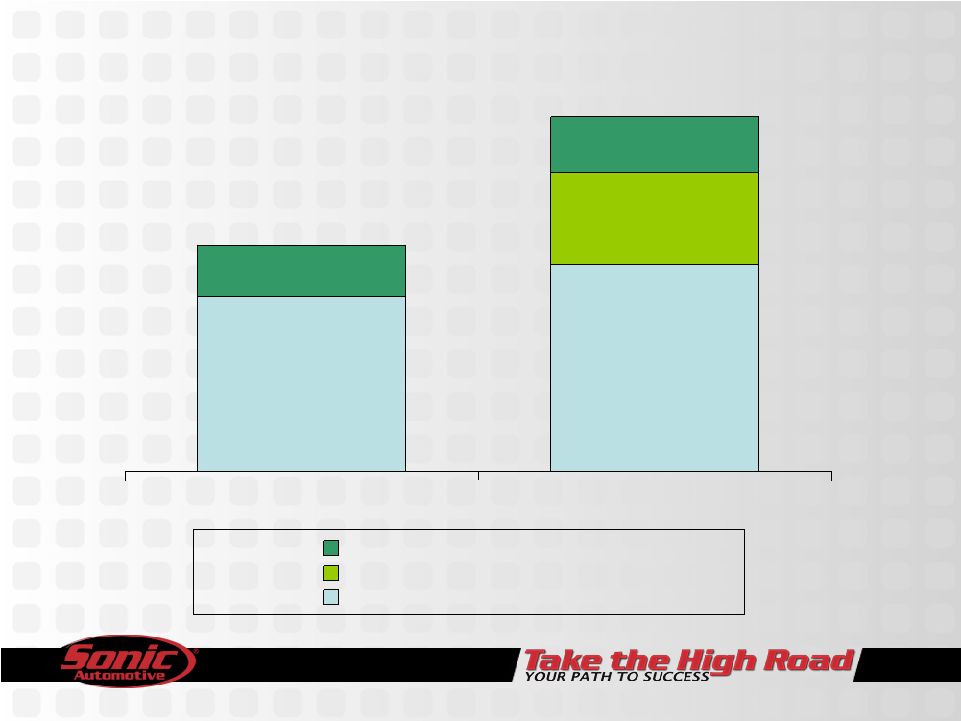 14.0% 8.5% 71.3% 66.5% 7.7% Q3 2007 Q3 2008 Rent Hurricane & Q3 Charges All Other SG&A SG&A Expenses as % of Gross Profit 74.2% 93.8% |
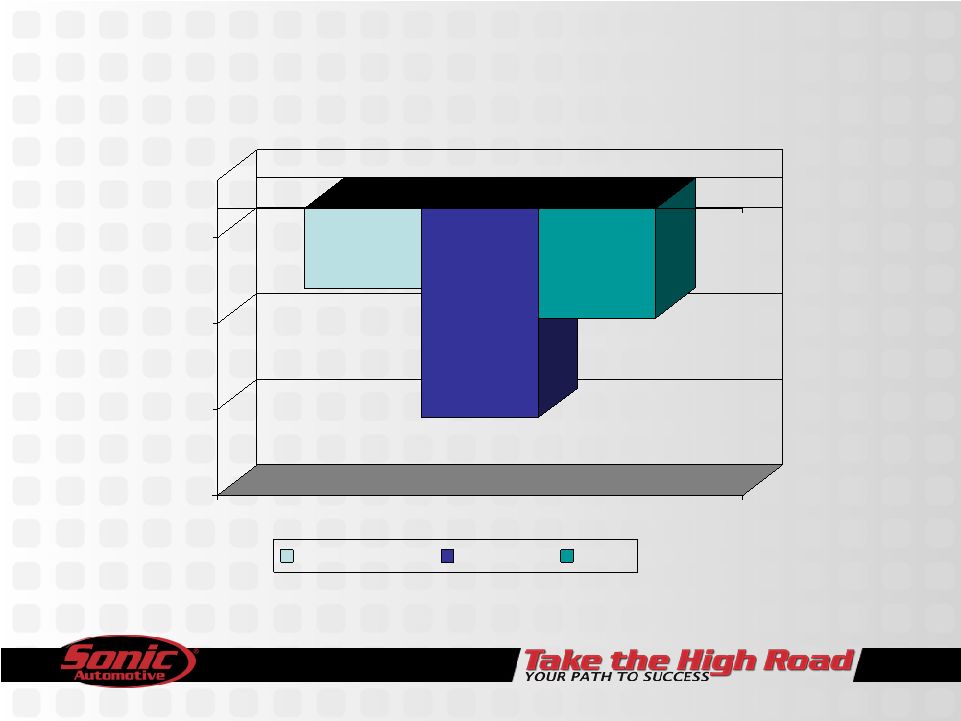 Fixed Operations Same Store - Q3 2008 (2.8%) (7.3%) (3.8%) (10.0%) (7.0%) (4.0%) (1.0%) Customer Pay Warranty Total |
 Days Supply Sep-08 Sept 08 Industry New Vehicles Domestic 66.0 73.4 Luxury 63.0 67.4 Import 50.7 64.7 Overall 60.1 69.4 Used Vehicles 32.2 Note: Industry truck days supply was 79 at the end of September, while car inventory was 60. |
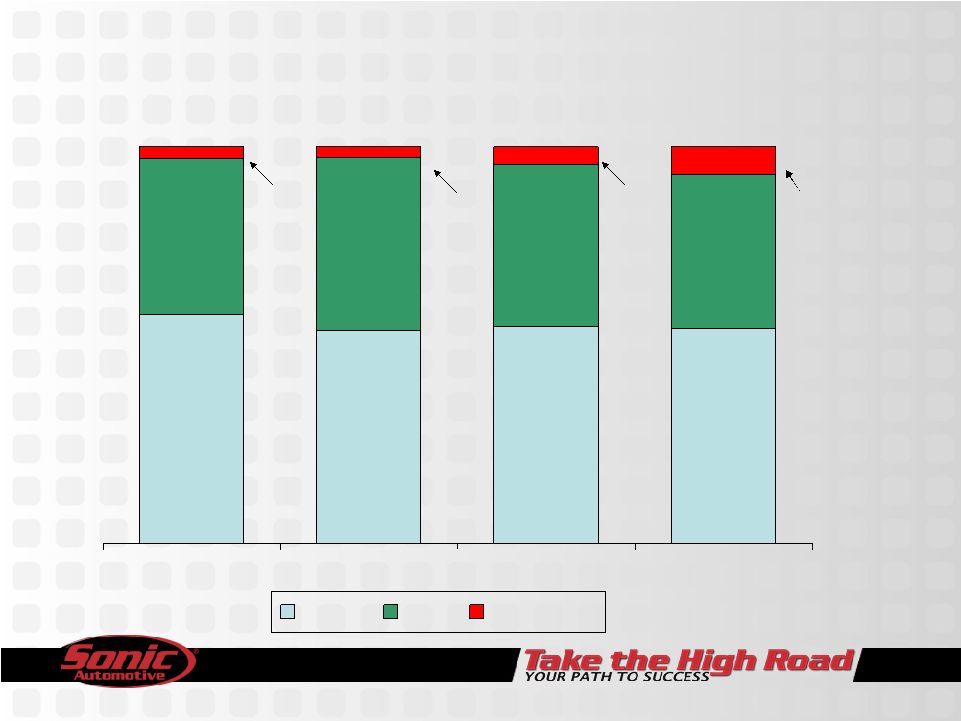 Capitalization 54.2% 54.8% 53.7% 57.6% 39.5% 43.6% 40.7% 38.9% Q4 2007 Q1 2008 Q2 2008 Q3 2008 Equity Debt Mortgages 46.3% 45.2% Debt to Cap With Mortgages 2.7% 4.5% 6.9% 42.4% 45.8% 2.9% |
 Liquidity – Revolver Availability June September (mils) (mils) Revolver Balance $115 $69 Revolver Availability 110 153 Memo: Mortgage Funding $76 $115 |
 Debt Covenants June September Covenants Current Ratio 1.18 1.23 >=1.15 Fixed Charge Coverage 1.72 1.65 >=1.20 Debt to EBITDA 0.94 0.82 <2.25 We are in full compliance with all debt covenants |
 Capital Spending Third Quarter Nine Months (mils) (mils) Capital Spending - property $7 $70 - traditional 12 52 Total $19 $122 Mortgage Funding Secured in the Period $39 $57 |
 Q4 Outlook Forecast Assumptions Revised Forecast Same Store Gross Margins: New 6.5% Used 8.0% Fixed Operations 49.7% LIBOR Rate 4.3% SAAR 12.0M Q4 2008 Guidance $.10 - $.20 Relatively Stable |
 Summary • We are controlling what we can – our ability to execute our operational priorities • Q4 Outlook – New vehicle environment will continue to be very challenging, not looking
for usual Holiday Push with Luxury. – New and Used gross margin pressure – Continued Challenging Economic and Capital Market Environments • Sticking to our strategy – Generating Revenue – Expense Control – Cash & Spending – Debt Reduction • We are building for the long-term – We are a Sales Organization that is made up of Ladies and Gentlemen who are
Committed to Taking the High Road.
|
 |