
Exhibit 99.2
Exhibit 99.2
Cautionary Notice Regarding Forward-Looking Statements
This presentation contains statements that constitute “forward-looking statements” within the meaning of Section 27A of the Securities Act of 1933 and Section 21E of the Securities Exchange Act of 1934.
These forward-looking statements are not historical facts, but only predictions by our company and/or our company’s management.
These statements generally can be identified by lead-in words such as “believe,” “expect” “anticipate,” “intend,” “plan,” “foresee” and other similar words. Similarly, statements that describe our company’s objectives, plans or goals are also forward-looking statements.
You are cautioned that these forward-looking statements are not guarantees of future performance and involve risks and uncertainties, and that actual results may differ materially from those projected in the forward-looking statements as a result of various factors. Among others, factors that could materially adversely affect actual results and performance include those risk factors that are listed in Sonic Automotive’s Form 10-K for the year ended December 31, 2008.
| 2 |
|
Fourth Quarter 2008 Earnings Review April 1, 2009
| 3 |
|
Sonic Automotive Q4 2008
Conference Call Topics
Quarterly Overview
Financial Review
Same Store and Operations Review Closing Comments
| 4 |
|
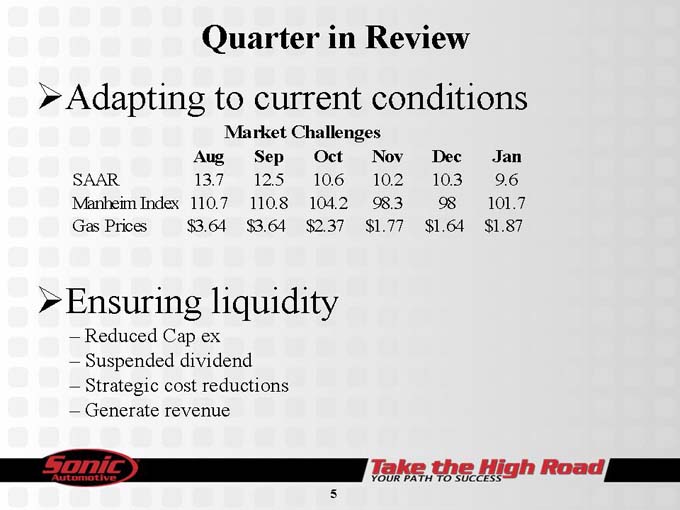
Quarter in Review
?Adapting to current conditions
Market Challenges
Aug Sep Oct Nov Dec Jan
SAAR 13.7 12.5 10.6 10.2 10.3 9.6
Manheim Index 110.7 110.8 104.2 98.3 98 101.7
Gas Prices $3.64 $3.64 $2.37 $1.77 $1.64 $1.87
Ensuring liquidity
Reduced Cap ex
Suspended dividend
Strategic cost reductions
Generate revenue
| 5 |
|
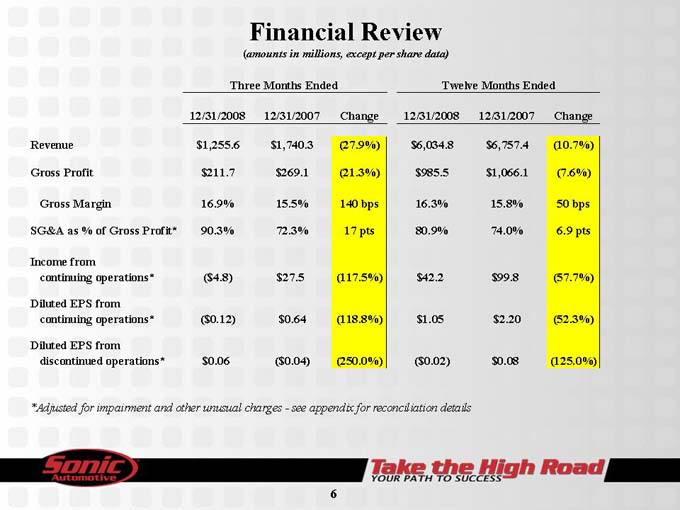
Financial Review
(amounts in millions, except per share data)
Three Months Ended Twelve Months Ended
12/31/2008 12/31/2007 Change 12/31/2008 12/31/2007 Change
Revenue $1,255.6 $1,740.3(27.9%) $6,034.8 $6,757.4(10.7%)
Gross Profit $211.7 $269.1(21.3%) $985.5 $1,066.1(7.6%)
Gross Margin 16.9% 15.5% 140 bps 16.3% 15.8% 50 bps
SG&A as % of Gross Profit* 90.3% 72.3% 17 pts 80.9% 74.0% 6.9 pts
Income from continuing operations*($4.8) $27.5(117.5%) $42.2 $99.8(57.7%)
Diluted EPS from continuing operations*($0.12) $0.64(118.8%) $1.05 $2.20(52.3%)
Diluted EPS from discontinued operations* $0.06($0.04)(250.0%)($0.02) $0.08(125.0%)
*Adjusted for impairment and other unusual charges—see appendix for reconciliation details
| 6 |
|
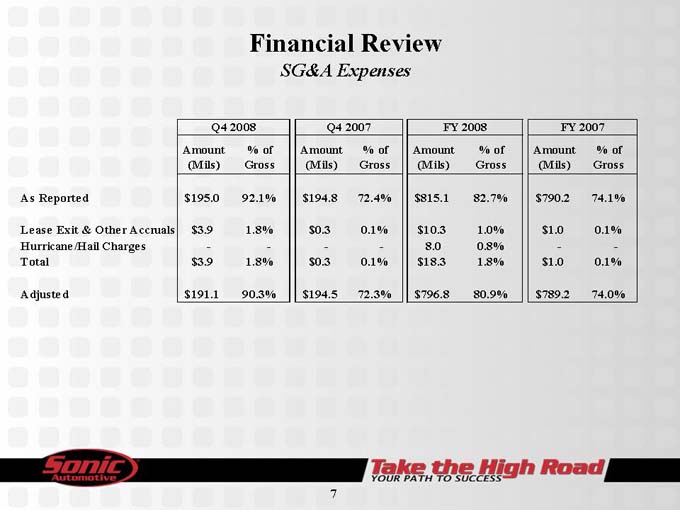
Financial Review
SG&A Expenses
Q4 2008 Q4 2007 FY 2008 FY 2007
Amount% of Amount% of Amount% of Amount% of
(Mils) Gross(Mils) Gross(Mils) Gross(Mils) Gross
As Reported $195.0 92.1% $194.8 72.4% $815.1 82.7% $790.2 74.1%
Lease Exit & Other Accruals $3.9 1.8% $0.3 0.1% $10.3 1.0% $1.0 0.1%
Hurricane/Hail Charges———8.0 0.8%—-
Total $3.9 1.8% $0.3 0.1% $18.3 1.8% $1.0 0.1%
Adjusted $191.1 90.3% $194.5 72.3% $796.8 80.9% $789.2 74.0%
| 7 |
|
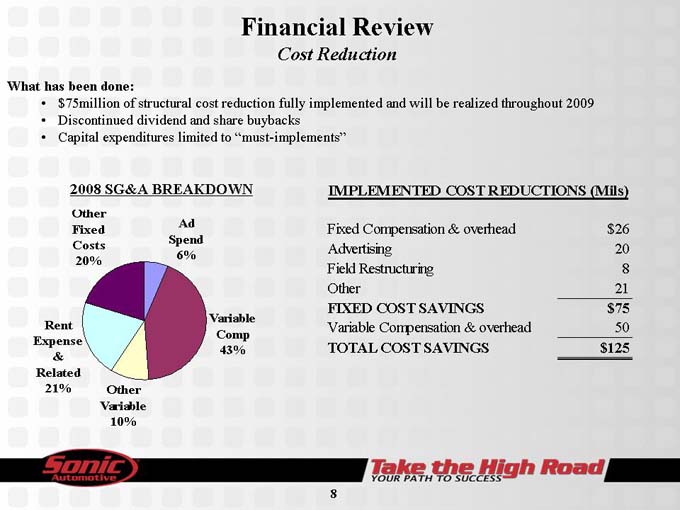
Financial Review
Cost Reduction
What has been done:
$75million of structural cost reduction fully implemented and will be realized throughout 2009
Discontinued dividend and share buybacks
Capital expenditures limited to “must-implements”
IMPLEMENTED COST REDUCTIONS (Mils)
Fixed Compensation & overhead $26
Advertising 20
Field Restructuring 8
Other 21
FIXED COST SAVINGS $75
Variable Compensation & overhead 50
TOTAL COST SAVINGS $125
2008 SG&A BREAKDOWN
Other Fixed Costs 20%
Ad Spend 6%
Rent Expense & Related 21%
Other Variable 10%
Variable Comp 43%
| 8 |
|
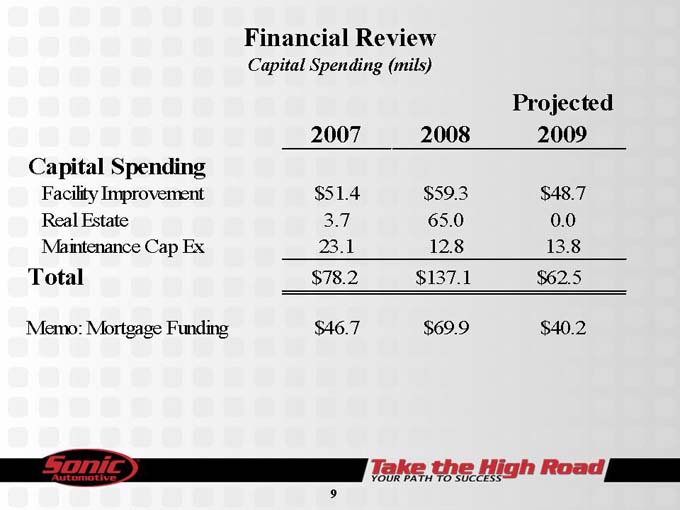
Financial Review
Capital Spending (mils)
2007 2008 Projected 2009
Capital Spending
Facility Improvement $51.4 $59.3 $48.7
Real Estate 3.7 65.0 0.0
Maintenance Cap Ex 23.1 12.8 13.8
Total $78.2 $137.1 $62.5
Memo: Mortgage Funding $46.7 $69.9 $40.2
9
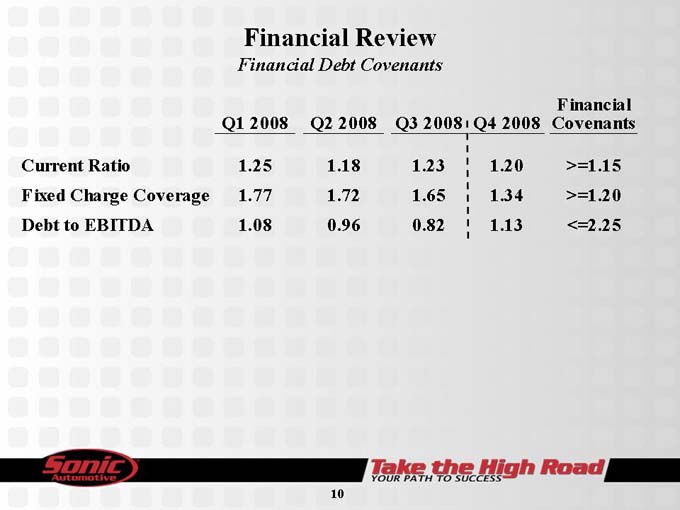
Financial Review
Financial Debt Covenants
Q1 2008 Q2 2008 Q3 2008 Q4 2008 Financial Covenants
Current Ratio 1.25 1.18 1.23 1.20 >=1.15
Fixed Charge Coverage 1.77 1.72 1.65 1.34 >=1.20
Debt to EBITDA 1.08 0.96 0.82 1.13 <=2.25
10
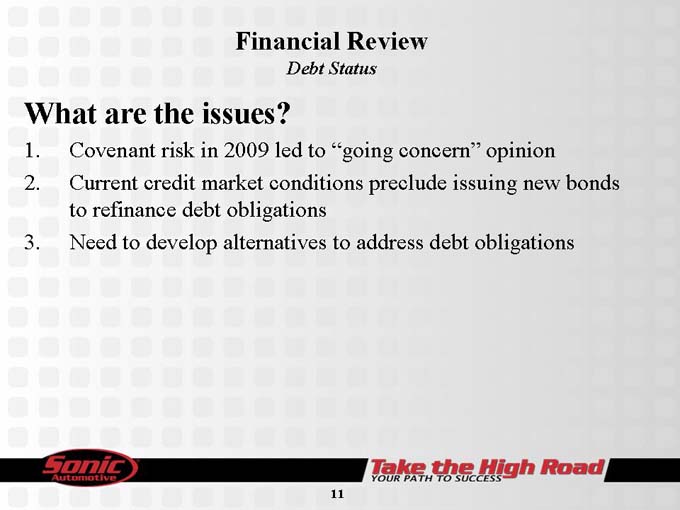
Financial Review
Debt Status
What are the issues?
1. Covenant risk in 2009 led to “going concern” opinion
2. Current credit market conditions preclude issuing new bonds to refinance debt obligations
3. Need to develop alternatives to address debt obligations
11
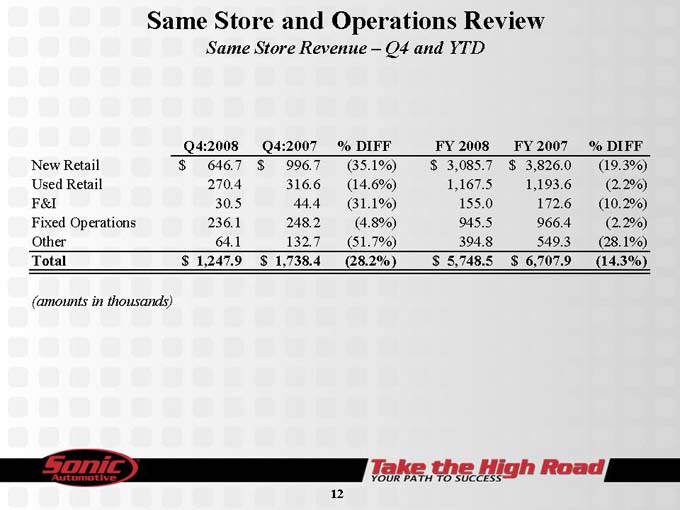
Same Store and Operations Review
Same Store Revenue – Q4 and YTD
Q4:2008 Q4:2007% DIFF FY 2008 FY 2007% DIFF
New Retail $ 646.7 $ 996.7(35.1%) $ 3,085.7 $ 3,826.0(19.3%)
Used Retail 270.4 316.6(14.6%) 1,167.5 1,193.6(2.2%)
F&I 30.5 44.4(31.1%) 155.0 172.6(10.2%)
Fixed Operations 236.1 248.2(4.8%) 945.5 966.4(2.2%)
Other 64.1 132.7(51.7%) 394.8 549.3(28.1%)
Total $ 1,247.9 $ 1,738.4(28.2%) $ 5,748.5 $ 6,707.9(14.3%)
(amounts in thousands)
12
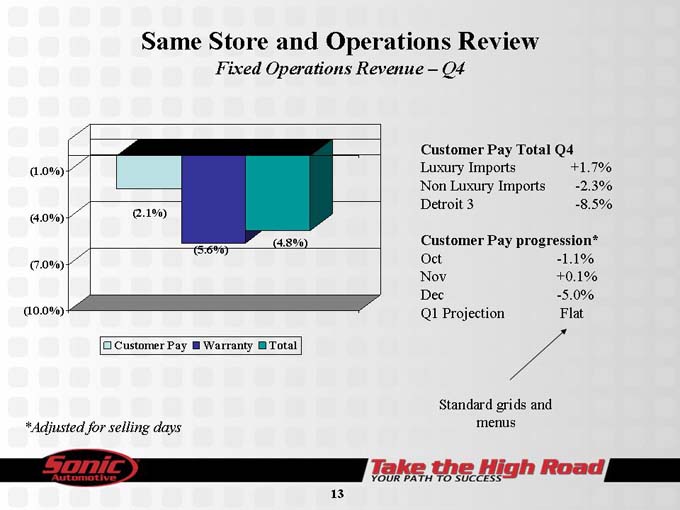
Same Store and Operations Review
Fixed Operations Revenue – Q4
Customer Pay Total Q4
Luxury Imports +1.7%
Non Luxury Imports -2.3%
Detroit 3 -8.5%
Customer Pay progression*
Oct -1.1%
Nov +0.1%
Dec -5.0%
Q1 Projection Flat
(1.0%)
(4.0%)
(7.0%)
(10.0%)
(2.1%)
(5.6%)
(4.8%)
Customer Pay
Warranty
Total
Standard grids and
menus
*Adjusted for selling days
13
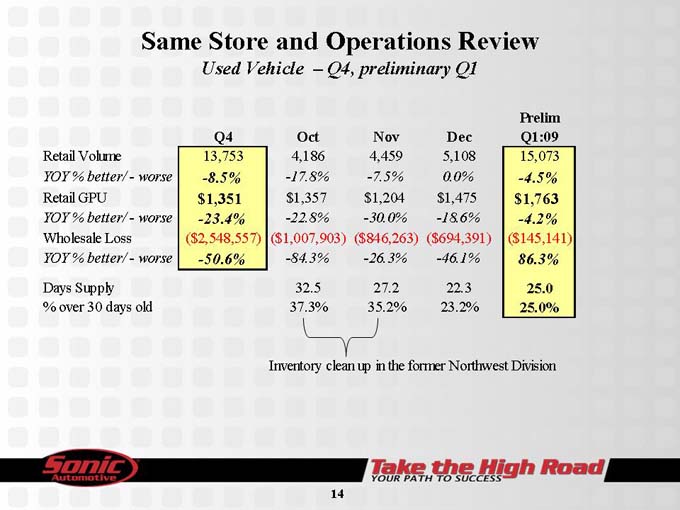
Same Store and Operations Review
Used Vehicle – Q4, preliminary Q1
Q4 Oct Nov Dec Prelim Q1:09
Retail Volume 13,753 4,186 4,459 5,108 15,073
YOY % better/—worse -8.5% -17.8% -7.5% 0.0% -4.5%
Retail GPU $1,351 $1,357 $1,204 $1,475 $1,763
YOY % better/—worse -23.4% -22.8% -30.0% -18.6% -4.2%
Wholesale Loss($2,548,557)($1,007,903)($846,263)($694,391)($145,141)
YOY % better/—worse -50.6% -84.3% -26.3% -46.1% 86.3%
Days Supply 32.5 27.2 22.3 25.0
% over 30 days old 37.3% 35.2% 23.2% 25.0%
Inventory clean up in the former Northwest Division
14
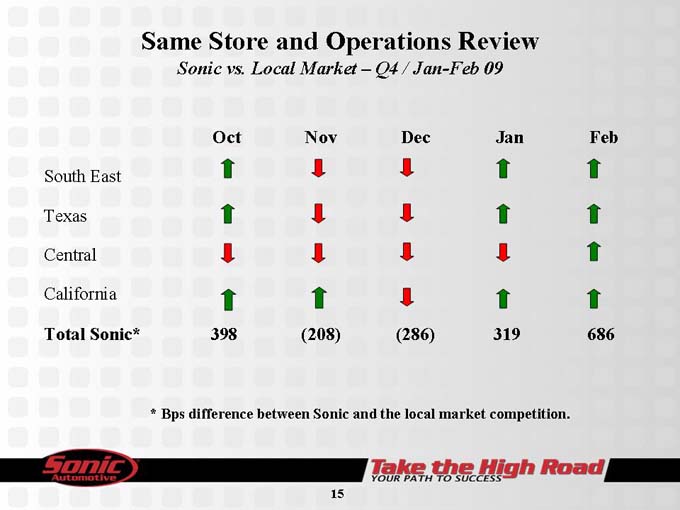
Same Store and Operations Review
Sonic vs. Local Market – Q4 / Jan-Feb 09
Oct Nov Dec Jan Feb
South East Texas Central California
Total Sonic*
398 (208) (286) 319 686
| * |
|
Bps difference between Sonic and the local market competition. |
15
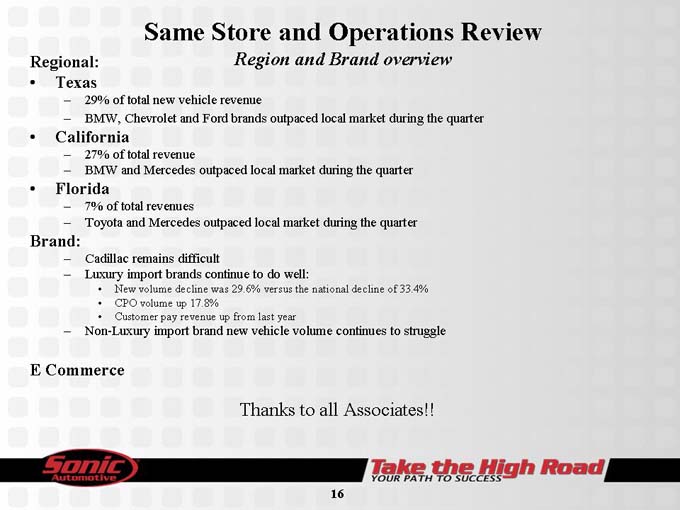
Same Store and Operations Review
Regional:
Region and Brand overview
Texas
29% of total new vehicle revenue
BMW, Chevrolet and Ford brands outpaced local market during the quarter
California
27% of total revenue
BMW and Mercedes outpaced local market during the quarter
Florida
7% of total revenues
Toyota and Mercedes outpaced local market during the quarter
Brand:
Cadillac remains difficult
Luxury import brands continue to do well:
New volume decline was 29.6% versus the national decline of 33.4%
CPO volume up 17.8%
Customer pay revenue up from last year
Non-Luxury import brand new vehicle volume continues to struggle
E Commerce
Thanks to all Associates!!
16
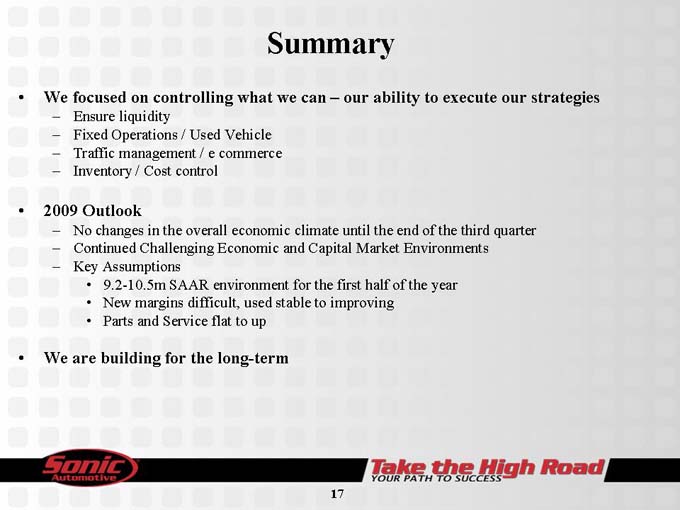
Summary
We focused on controlling what we can – our ability to execute our strategies
Ensure liquidity
Fixed Operations / Used Vehicle
Traffic management / e commerce
Inventory / Cost control
2009 Outlook
No changes in the overall economic climate until the end of the third quarter
Continued Challenging Economic and Capital Market Environments
Key Assumptions
9.2 -10.5m SAAR environment for the first half of the year
New margins difficult, used stable to improving
Parts and Service flat to up
We are building for the long-term
17
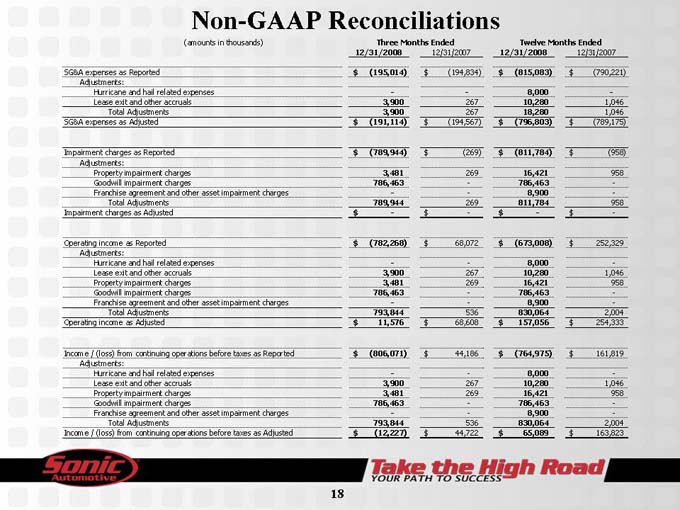
Non-GAAP Reconciliations
(amounts in thousands) Three Months Ended Twelve Months Ended
12/31/2008 12/31/2007 12/31/2008 12/31/2007
SG&A expenses as Reported $ (195,014) $ (194,834) $ (815,083) $ (790,221)
Adjustments:
Hurricane and hail related expenses—- 8,000 -
Lease exit and other accruals 3,900 267 10,280 1,046
Total Adjustments 3,900 267 18,280 1,046
SG&A expenses as Adjusted $ (191,114) $ (194,567) $ (796,803) $ (789,175)
Impairment charges as Reported $ (789,944) $ (269) $ (811,784) $ (958)
Adjustments:
Property impairment charges 3,481 269 16,421 958
Goodwill impairment charges 786,463—786,463 -
Franchise agreement and other asset impairment charges—- 8,900 -
Total Adjustments 789,944 269 811,784 958
Impairment charges as Adjusted $—$—$—$ -
Operating income as Reported $ (782,268) $ 68,072 $ (673,008) $ 252,329
Adjustments:
Hurricane and hail related expenses—- 8,000 -
Lease exit and other accruals 3,900 267 10,280 1,046
Property impairment charges 3,481 269 16,421 958
Goodwill impairment charges 786,463—786,463 -
Franchise agreement and other asset impairment charges—- 8,900 -
Total Adjustments 793,844 536 830,064 2,004
Operating income as Adjusted $ 11,576 $ 68,608 $ 157,056 $ 254,333
Income / (loss) from continuing operations before taxes as Reported $ (806,071) $ 44,186 $ (764,975) $ 161,819
Adjustments:
Hurricane and hail related expenses—- 8,000 -
Lease exit and other accruals 3,900 267 10,280 1,046
Property impairment charges 3,481 269 16,421 958
Goodwill impairment charges 786,463—786,463 -
Franchise agreement and other asset impairment charges—- 8,900 -
Total Adjustments 793,844 536 830,064 2,004
Income / (loss) from continuing operations before taxes as Adjusted $ (12,227) $ 44,722 $ 65,089 $ 163,823
18
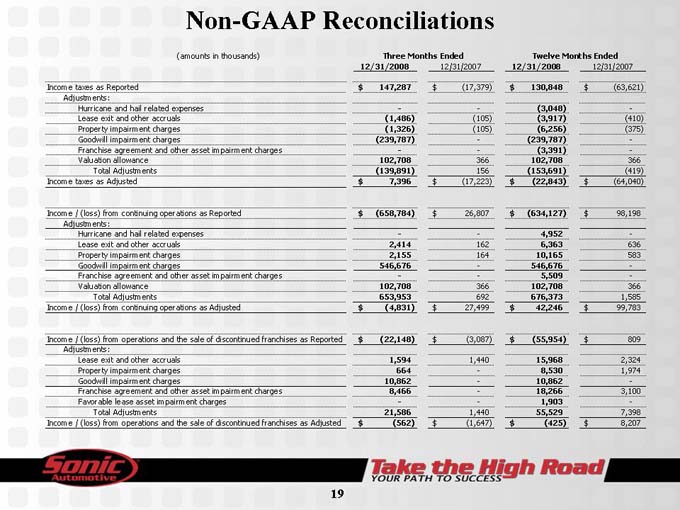
Non-GAAP Reconciliations
(amounts in thousands) Three Months Ended Twelve Months Ended
12/31/2008 12/31/2007 12/31/2008 12/31/2007
Income taxes as Reported $ 147,287 $ (17,379) $ 130,848 $ (63,621)
Adjustments:
Hurricane and hail related expenses—-(3,048) -
Lease exit and other accruals(1,486)(105)(3,917)(410)
Property impairment charges(1,326)(105)(6,256)(375)
Goodwill impairment charges(239,787) -(239,787) -
Franchise agreement and other asset impairment charges—-(3,391) -
Valuation allowance 102,708 366 102,708 366
Total Adjustments(139,891) 156(153,691)(419)
Income taxes as Adjusted $ 7,396 $ (17,223) $ (22,843) $ (64,040)
Income / (loss) from continuing operations as Reported $ (658,784) $ 26,807 $ (634,127) $ 98,198
Adjustments:
Hurricane and hail related expenses—- 4,952 -
Lease exit and other accruals 2,414 162 6,363 636
Property impairment charges 2,155 164 10,165 583
Goodwill impairment charges 546,676—546,676 -
Franchise agreement and other asset impairment charges—- 5,509 -
Valuation allowance 102,708 366 102,708 366
Total Adjustments 653,953 692 676,373 1,585
Income / (loss) from continuing operations as Adjusted $ (4,831) $ 27,499 $ 42,246 $ 99,783
Income / (loss) from operations and the sale of discontinued franchises as Reported $ (22,148) $ (3,087) $ (55,954) $ 809
Adjustments:
Lease exit and other accruals 1,594 1,440 15,968 2,324
Property impairment charges 664—8,530 1,974
Goodwill impairment charges 10,862—10,862 -
Franchise agreement and other asset impairment charges 8,466—18,266 3,100
Favorable lease asset impairment charges—- 1,903 -
Total Adjustments 21,586 1,440 55,529 7,398
Income / (loss) from operations and the sale of discontinued franchises as Adjusted $ (562) $ (1,647) $ (425) $ 8,207
19
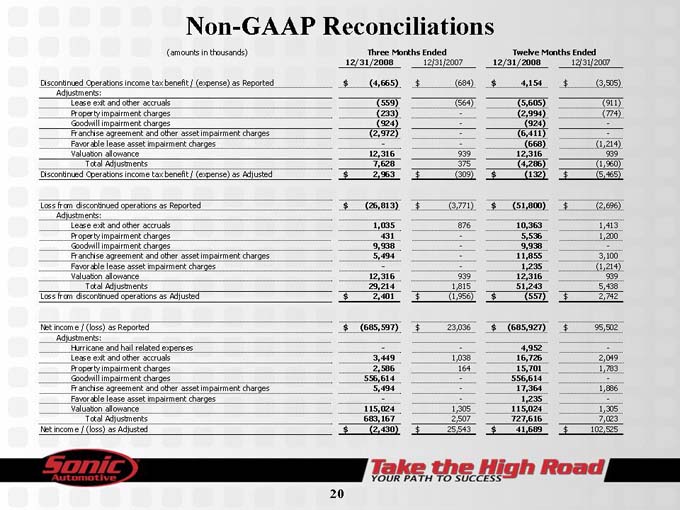
Non-GAAP Reconciliations
(amounts in thousands) Three Months Ended Twelve Months Ended
12/31/2008 12/31/2007 12/31/2008 12/31/2007
Discontinued Operations income tax benefit / (expense) as Reported $ (4,665) $ (684) $ 4,154 $ (3,505)
Adjustments:
Lease exit and other accruals(559)(564)(5,605)(911)
Property impairment charges(233) -(2,994)(774)
Goodwill impairment charges(924) -(924) -
Franchise agreement and other asset impairment charges(2,972) -(6,411) -
Favorable lease asset impairment charges—-(668)(1,214)
Valuation allowance 12,316 939 12,316 939
Total Adjustments 7,628 375(4,286)(1,960)
Discontinued Operations income tax benefit / (expense) as Adjusted $ 2,963 $ (309) $ (132) $ (5,465)
Loss from discontinued operations as Reported $ (26,813) $ (3,771) $ (51,800) $ (2,696)
Adjustments:
Lease exit and other accruals 1,035 876 10,363 1,413
Property impairment charges 431—5,536 1,200
Goodwill impairment charges 9,938—9,938 -
Franchise agreement and other asset impairment charges 5,494—11,855 3,100
Favorable lease asset impairment charges—- 1,235(1,214)
Valuation allowance 12,316 939 12,316 939
Total Adjustments 29,214 1,815 51,243 5,438
Loss from discontinued operations as Adjusted $ 2,401 $ (1,956) $ (557) $ 2,742
Net income / (loss) as Reported $ (685,597) $ 23,036 $ (685,927) $ 95,502
Adjustments:
Hurricane and hail related expenses—- 4,952 -
Lease exit and other accruals 3,449 1,038 16,726 2,049
Property impairment charges 2,586 164 15,701 1,783
Goodwill impairment charges 556,614—556,614 -
Franchise agreement and other asset impairment charges 5,494—17,364 1,886
Favorable lease asset impairment charges—- 1,235 -
Valuation allowance 115,024 1,305 115,024 1,305
Total Adjustments 683,167 2,507 727,616 7,023
Net income / (loss) as Adjusted $ (2,430) $ 25,543 $ 41,689 $ 102,525
20
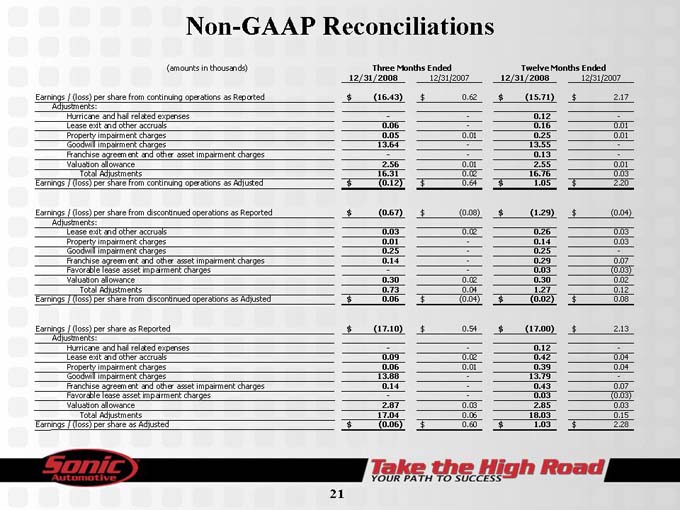
Non-GAAP Reconciliations
(amounts in thousands) Three Months Ended Twelve Months Ended
12/31/2008 12/31/2007 12/31/2008 12/31/2007
Earnings / (loss) per share from continuing operations as Reported $ (16.43) $ 0.62 $ (15.71) $ 2.17
Adjustments:
Hurricane and hail related expenses—- 0.12 -
Lease exit and other accruals 0.06—0.16 0.01
Property impairment charges 0.05 0.01 0.25 0.01
Goodwill impairment charges 13.64—13.55 -
Franchise agreement and other asset impairment charges—- 0.13 -
Valuation allowance 2.56 0.01 2.55 0.01
Total Adjustments 16.31 0.02 16.76 0.03
Earnings / (loss) per share from continuing operations as Adjusted $ (0.12) $ 0.64 $ 1.05 $ 2.20
Earnings / (loss) per share from discontinued operations as Reported $ (0.67) $ (0.08) $ (1.29) $ (0.04)
Adjustments:
Lease exit and other accruals 0.03 0.02 0.26 0.03
Property impairment charges 0.01—0.14 0.03
Goodwill impairment charges 0.25—0.25 -
Franchise agreement and other asset impairment charges 0.14—0.29 0.07
Favorable lease asset impairment charges—- 0.03(0.03)
Valuation allowance 0.30 0.02 0.30 0.02
Total Adjustments 0.73 0.04 1.27 0.12
Earnings / (loss) per share from discontinued operations as Adjusted $ 0.06 $ (0.04) $ (0.02) $ 0.08
Earnings / (loss) per share as Reported $ (17.10) $ 0.54 $ (17.00) $ 2.13
Adjustments:
Hurricane and hail related expenses—- 0.12 -
Lease exit and other accruals 0.09 0.02 0.42 0.04
Property impairment charges 0.06 0.01 0.39 0.04
Goodwill impairment charges 13.88—13.79 -
Franchise agreement and other asset impairment charges 0.14—0.43 0.07
Favorable lease asset impairment charges—- 0.03(0.03)
Valuation allowance 2.87 0.03 2.85 0.03
Total Adjustments 17.04 0.06 18.03 0.15
Earnings / (loss) per share as Adjusted $ (0.06) $ 0.60 $ 1.03 $ 2.28
21
