Exhibit 99.2
Exhibit 99.2
Cautionary Notice Regarding Forward-Looking Statements
This presentation contains statements that constitute “forward-looking statements” within the meaning of Section 27A of the Securities Act of 1933 and Section 21E of the Securities Exchange Act of 1934.
These forward-looking statements are not historical facts, but only predictions by our company and/or our company’s management.
These statements generally can be identified by lead-in words such as “believe,” “expect” “anticipate,” “intend,” “plan,” “foresee” and other similar words. Similarly, statements that describe our company’s objectives, plans or goals are also forward-looking statements.
You are cautioned that these forward-looking statements are not guarantees of future performance and involve risks and uncertainties, and that actual results may differ materially from those projected in the forward-looking statements as a result of various factors. Among others, factors that could materially adversely affect actual results and performance include those risk factors that are listed in Sonic Automotive’s Form 10-K for the year ended December 31, 2008.
First Quarter 2009 Earnings Review May 8, 2009
Sonic Automotive Q1 2009
Conference Call Topics
Quarterly Overview
Financial Review
Operations Review
Closing Comments

Quarter in Review
Strong performance in a tough environment
Gained new vehicle market share
Used vehicle performance solid – CPO again outperformed industry
Expanded service customer pay
Cost optimization
Made money
Successfully restructured debt
Strategic initiatives continue to gain traction
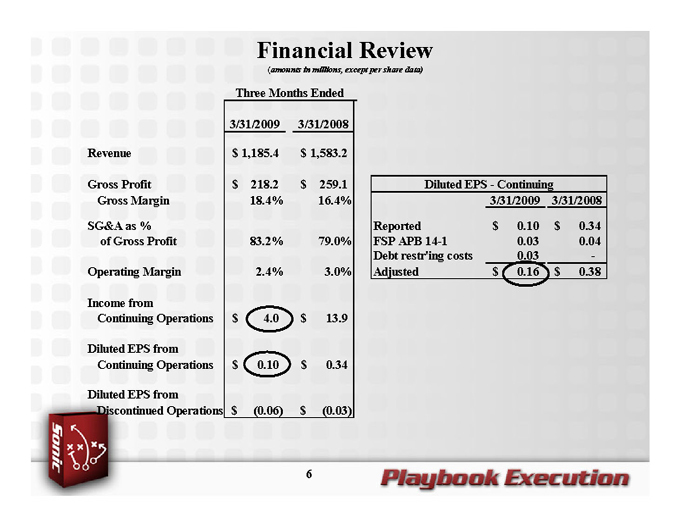
Financial Review
(amounts in millions, except per share data)
Three Months Ended
3/31/2009 3/31/2008
Revenue $ 1,185.4 $ 1,583.2
Gross Profit $ 218.2 $ 259.1
Gross Margin 18.4% 16.4%
SG&A as %
of Gross Profit 83.2% 79.0%
Operating Margin 2.4% 3.0%
Income from
Continuing Operations $ 4.0 $ 13.9
Diluted EPS from
Continuing Operations $ 0.10 $ 0.34
Diluted EPS from
Discontinued Operations $ (0.06) $ (0.03)
Diluted EPS - Continuing
3/31/2009 3/31/2008
Reported $ 0.10 $ 0.34
FSP APB 14-1 0.03 0.04
Debt restr’ing costs 0.03 -
Adjusted $ 0.16 $ 0.38
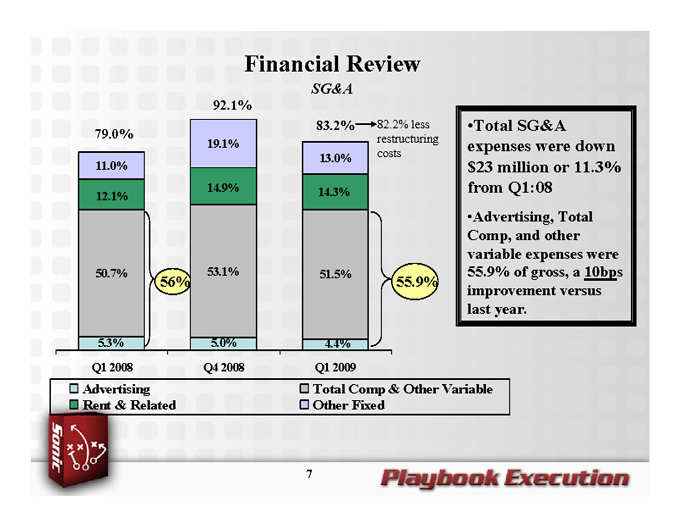
Financial Review
SG&A
92.1%
83.2% 82.2% less
79.0% 19.1% restructuring
13.0% costs
11.0%
14.9%
12.1% 14.3%
50.7% 53.1% 51.5%
56% 55.9%
5.3% 5.0% 4.4%
Q1 2008 Q4 2008 Q1 2009
Advertising
Total Comp & Other Variable
Rent & Related
Other Fixed
Total SG&A expenses were down $23 million or 11.3% from Q1:08
Advertising, Total Comp, and other variable expenses were 55.9% of gross, a 10bps improvement versus last year.
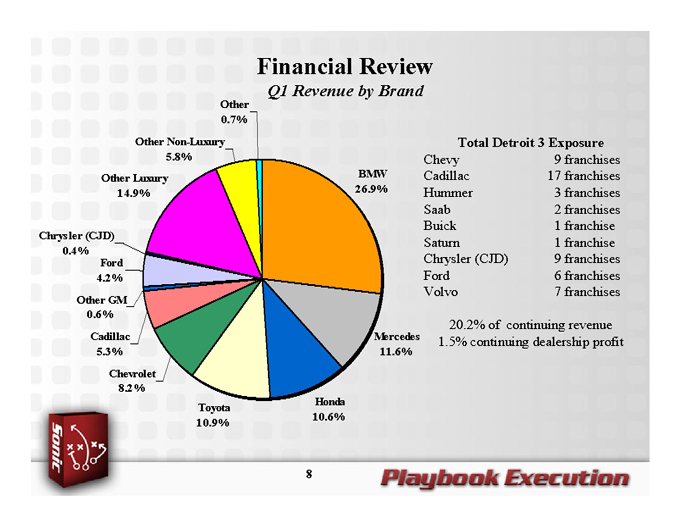
Financial Review
Q1 Revenue by Brand
Other
0.7%
Other Non-Luxury
5.8%
Other Luxury BMW
14.9% 26.9%
Chrysler (CJD)
0.4%
Ford
4.2%
Other GM
0.6%
Cadillac Mercedes
5.3% 11.6%
Chevrolet
8.2%
Toyota Honda
10.9% 10.6%
Total Detroit 3 Exposure
Chevy 9 franchises
Cadillac 17 franchises
Hummer 3 franchises
Saab 2 franchises
Buick 1 franchise
Saturn 1 franchise
Chrysler (CJD) 9 franchises
Ford 6 franchises
Volvo 7 franchises
20.2% of continuing revenue
1.5% continuing dealership profit
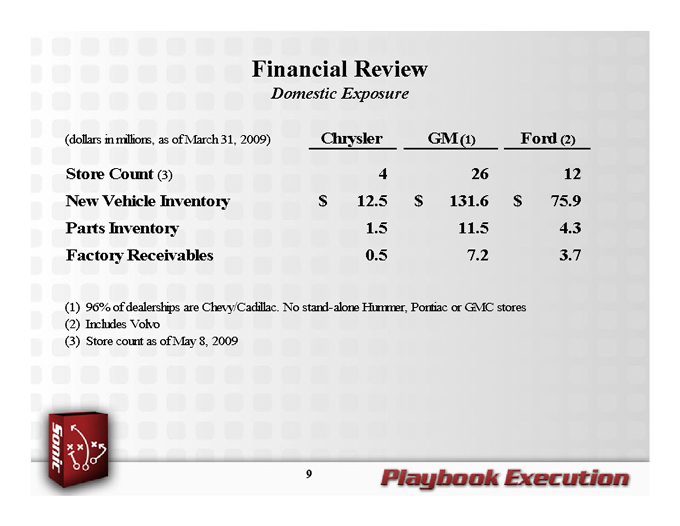
Financial Review
Domestic Exposure
(dollars in millions, as of March 31, 2009) Chrysler GM (1) Ford (2)
Store Count (3) 4 26 12
New Vehicle Inventory $ 12.5 $ 131.6 $ 75.9
Parts Inventory 1.5 11.5 4.3
Factory Receivables 0.5 7.2 3.7
| (1) |
|
96% of dealerships are Chevy/Cadillac. No stand-alone Hummer, Pontiac or GMC stores |
| (2) |
|
Includes Volvo |
| (3) |
|
Store count as of May 8, 2009 |
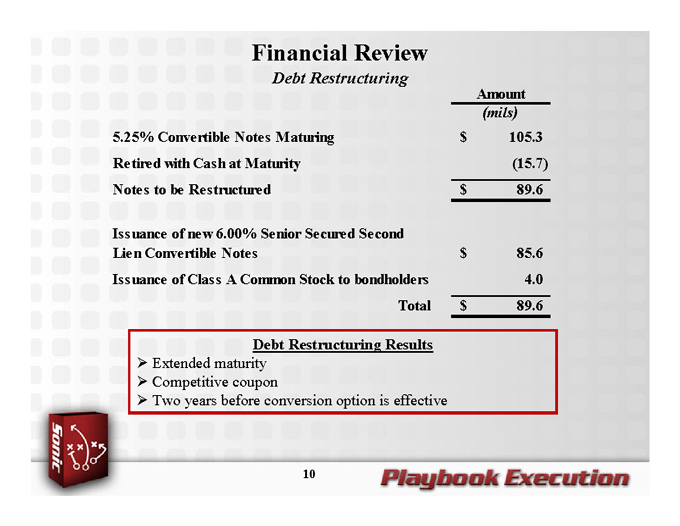
Financial Review
Debt Restructuring
Amount
(mils)
5.25% Convertible Notes Maturing $ 105.3
Retired with Cash at Maturity (15.7)
Notes to be Restructured $ 89.6
Issuance of new 6.00% Senior Secured Second
Lien Convertible Notes $ 85.6
Issuance of Class A Common Stock to bondholders 4.0
Total $ 89.6
Debt Restructuring Results
Extended maturity
Competitive coupon
Two years before conversion option is effective
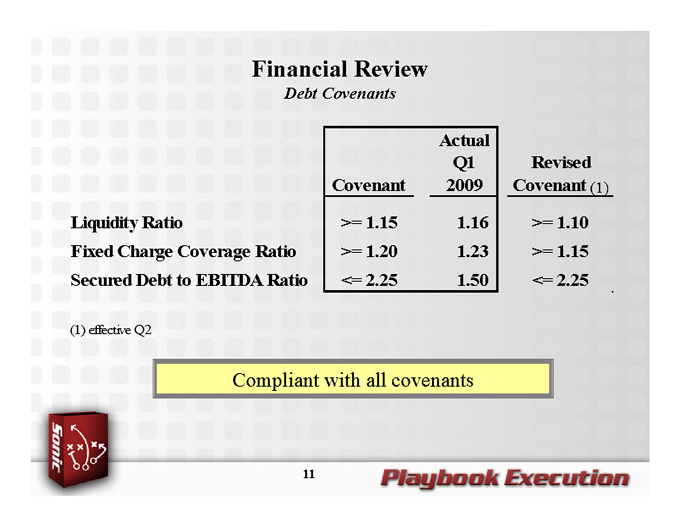
Financial Review
Debt Covenants
Actual
Q1 Revised
Covenant 2009 Covenant (1)
Liquidity Ratio >= 1.15 1.16 >= 1.10
Fixed Charge Coverage Ratio >= 1.20 1.23 >= 1.15
Secured Debt to EBITDA Ratio <= 2.25 1.50 <= 2.25
(1) effective Q2
Compliant with all covenants
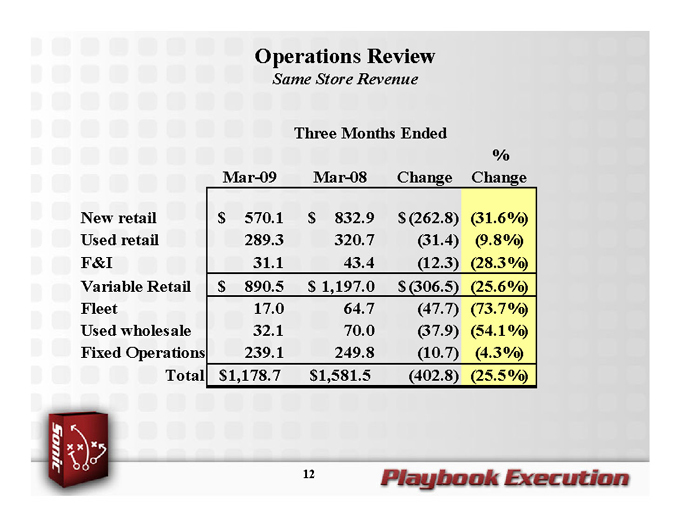
Operations Review
Same Store Revenue
Three Months Ended
%
Mar-09 Mar-08 Change Change
New retail $ 570.1 $ 832.9 $ (262.8) (31.6%)
Used retail 289.3 320.7 (31.4) (9.8%)
F&I 31.1 43.4 (12.3) (28.3%)
Variable Retail $ 890.5 $ 1,197.0 $ (306.5) (25.6%)
Fleet 17.0 64.7 (47.7) (73.7%)
Used wholesale 32.1 70.0 (37.9) (54.1%)
Fixed Operations 239.1 249.8 (10.7) (4.3%)
Total $1,178.7 $1,581.5 (402.8) (25.5%)
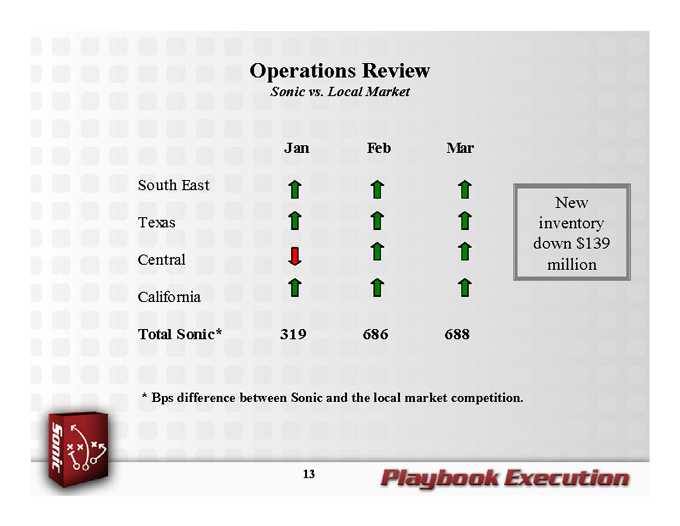
Operations Review
Sonic vs. Local Market
Jan Feb Mar
South East
Texas
Central
California
Total Sonic* 319 686 688
New inventory down $139 million
| * |
|
Bps difference between Sonic and the local market competition. |
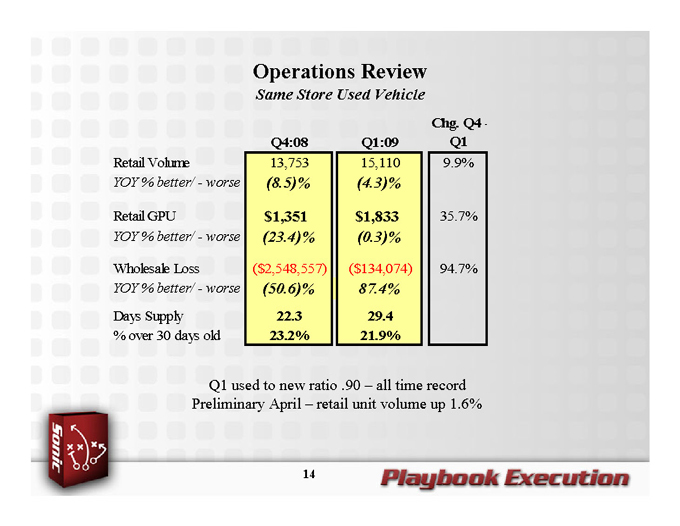
Operations Review
Same Store Used Vehicle
Chg. Q4 -
Q4:08 Q1:09 Q1
Retail Volume 13,753 15,110 9.9%
YOY % better/ - worse (8.5)% (4.3)%
Retail GPU $1,351 $1,833 35.7%
YOY % better/ - worse (23.4)% (0.3)%
Wholesale Loss ($2,548,557) ($134,074) 94.7%
YOY % better/ - worse (50.6)% 87.4%
Days Supply 22.3 29.4
% over 30 days old 23.2% 21.9%
Q1 used to new ratio .90 – all time record
Preliminary April – retail unit volume up 1.6%
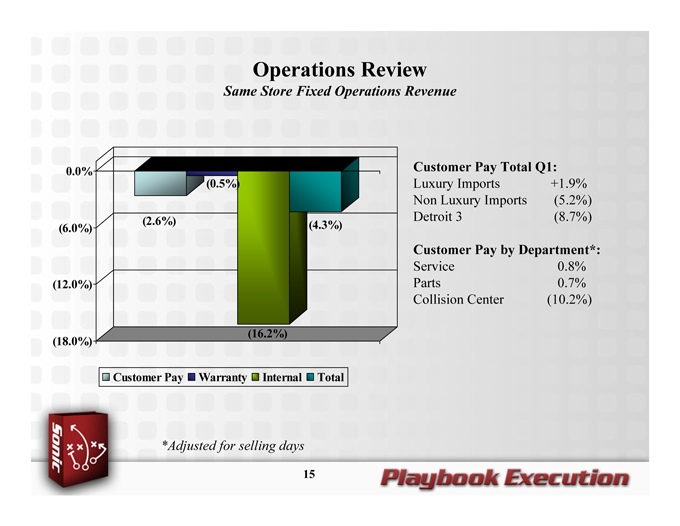
Operations Review
Same Store Fixed Operations Revenue
0.0%
(0.5%)
(6.0%) (2.6%) (4.3%)
(12.0%)
(18.0%) (16.2%)
Customer Pay Warranty Internal Total
Customer Pay Total Q1:
Luxury Imports +1.9%
Non Luxury Imports (5.2%)
Detroit 3 (8.7%)
Customer Pay by Department*:
Service 0.8%
Parts 0.7%
Collision Center (10.2%)
*Adjusted for selling days
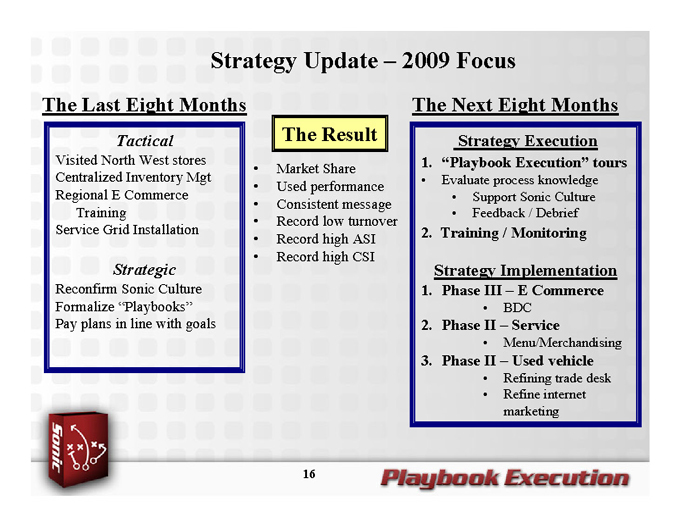
Strategy Update – 2009 Focus
The Last Eight Months
Tactical
Visited North West stores Centralized Inventory Mgt Regional E Commerce Training Service Grid Installation
Strategic
Reconfirm Sonic Culture Formalize “Playbooks” Pay plans in line with goals
The Result
Market Share Used performance Consistent message Record low turnover Record high ASI Record high CSI
The Next Eight Months
Strategy Execution
1. “Playbook Execution” tours
Evaluate process knowledge
Support Sonic Culture
Feedback / Debrief
2. Training / Monitoring
Strategy Implementation
1. Phase III – E Commerce
BDC
2. Phase II – Service
Menu/Merchandising
3. Phase II – Used vehicle
Refining trade desk
Refine internet marketing
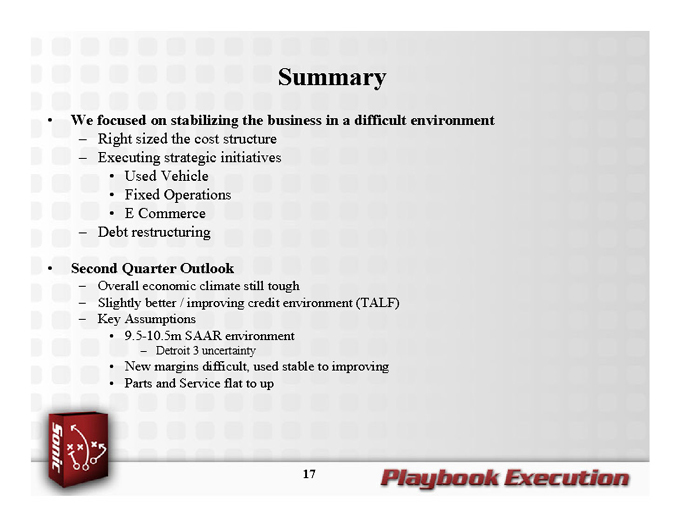
Summary
We focused on stabilizing the business in a difficult environment
Right sized the cost structure
Executing strategic initiatives
Used Vehicle
Fixed Operations
E Commerce
Debt restructuring
Second Quarter Outlook
Overall economic climate still tough
Slightly better / improving credit environment (TALF)
Key Assumptions
9.5-10.5m SAAR environment
Detroit 3 uncertainty
New margins difficult, used stable to improving
Parts and Service flat to up