 1 Exhibit 99.2 |
| 1 Exhibit 99.2 |
 •This presentation contains statements that constitute
“forward-looking statements” within the meaning of Section 27A of the Securities Act of 1933 and Section 21E of the Securities Exchange Act of 1934. •These forward-looking statements are not
historical facts, but only predictions by our company and/or
our company’s management. •These statements
generally can be identified by lead-in words such as “believe,” “expect” “anticipate,” “intend,” “plan,” “foresee” and other similar words. Similarly, statements that describe our company’s
objectives, plans or goals are also forward-looking
statements. •You are cautioned that these
forward-looking statements are not guarantees of future performance and involve risks and uncertainties,
and that actual results may differ materially from those projected in the
forward-looking statements as a result of various factors.
Among others, factors that could materially adversely affect actual
results and performance include those risk factors that are listed
in Sonic Automotive’s Form 8-K filed on May 28, 2009. Cautionary Notice Regarding Forward-Looking Statements |
 Second Quarter 2009 Earnings Review July 28, 2009 |
 4 Sonic Automotive Q2 2009 Conference Call Topics • Quarter in Review • Financial Review • Operations Review • Closing Comments |
 5 Quarter in Review Once again, posted strong operating results Gained new vehicle market share Record used retail volume Improving service customer pay Expanding fixed operations margins SG&A costs reduced Building on our solid foundation Profitable, generated cash |
 6 Financial Review (amounts in millions, except per share data) Operating Margin before impairments was 2.9%, down 10bps from last year 6/30/2009 6/30/2008 Revenue 1,392.6 $
1,796.6 $
Gross Profit 241.8 $
282.4 $
Gross Margin 17.4% 15.7% SG&A as % of Gross Profit 79.7% 77.8% Operating Margin 2.6% 3.0% - excluding impairments 2.9% Income from Continuing Operations 3.1 $
16.4 $
Diluted EPS from Continuing Operations 0.07 $
0.40 $
Diluted EPS from Discontinued Operations (0.07) $
(0.18) $
Three Months Ended
|
 7 Operating Results - Q2 vs. Q1 Q1 2009 Q2 2009 Better / (Worse) 6.8 $ 5.6 $ - 3.8 4.9 10.6 1,266.9 $ 1,392.6 $ 9.9% 230.4 241.8 5.0% 192.4 192.8 (0.2%) (amounts in millions) Adjusted Pre-tax income calculated as follows: As Reported Impairment Charges Non-cash Interest/Debt Restructure Costs Quarter-to-quarter performance: Revenues Gross Profit SG&A Expenses Operating Income 30.4 36.5 20.1% Pre-Tax Income - Adjusted 11.7 20.0 70.9% SAAR 9.5 9.6 1.1% 11.7 $ 20.0 $ Adjusted |
 8 Sequential Diluted Earnings per Share (1) Includes the impact of 12.2M shares related to the
conversion feature on our new 6% notes as if these notes were outstanding and dilutive in both quarters. Q1 2009 Q2 2009 As Reported 0.09 $ 0.07 $ Adjusted for Unusual Items 0.16 $ 0.26 $ Memo: Diluted Shares - Actual 40.3M 41.6M Diluted Shares - Adjusted 52.5M 53.8M Basic Shares 40.1M 41.0M Adjusted for share Dilution (1) 0.14 $ 0.22 $ |
 9 Debt Restructuring (amounts in millions) Face Value of Debt $85.6 Discount related to Embedded Derivatives 11.3* * Amortized over 16 months ($2-$3 million per quarter) Debt Discount |
 10 Debt Structure (amounts in millions) 6/30/2009* 3/31/2009* 12/31/2008* Revolver 80.0 $ 99.9 $ 70.8 $ 5 1/4% Notes - 105.3 105.3 6 % Notes 85.6 - - 4 1/4% Notes 160.0 160.0 160.0 8 5/8% Notes 275.0 275.0 275.0 Falcon Notes 18.8 19.3 19.7 Mortgages Payable 112.3 113.2 114.1 Other 6.5 6.6 6.6 Total Debt 738.3 $ 779.2 $ 751.6 $ $41 million reduction since 3/31/09 $13 million reduction since 12/31/08 Total Floorplan 834.3 $ 930.1 $ 1,120.5 $ $96 million reduction since 3/31/09 $286 million reduction since 12/31/08 * Excludes debt discount/premium |
 11 Debt Covenants Covenant Actual Q2 2009 Liquidity Ratio >= 1.10 1.18 Fixed Charge Coverage Ratio >= 1.15 1.36 Secured Debt to EBITDA Ratio <= 2.25 1.63 Compliant with all covenants |
 12 Capital Spending Q1 2009 Q2 2009 Projected 2009 Capital Spending Facility Improvement $14.6 $4.0 $48.7 Maintenance Cap Ex 5.8 2.2 13.8 Total $20.4 $6.2 $62.5 Memo: Mortgage Funding $0.0 $0.0 $40.2 Spending Contingent Upon Mortgage Funding (amounts in millions) |
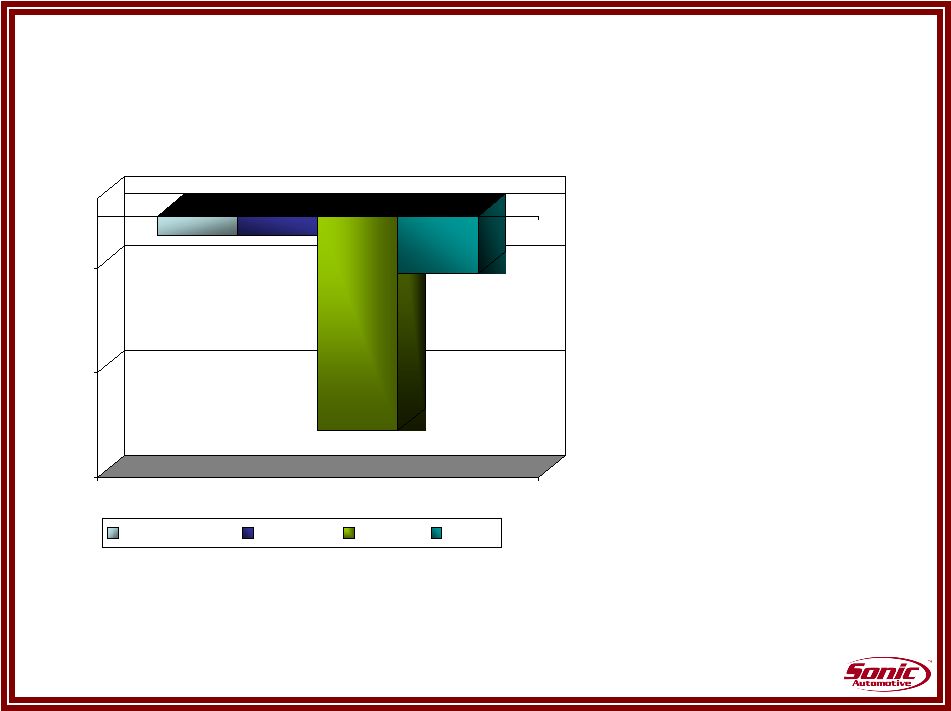
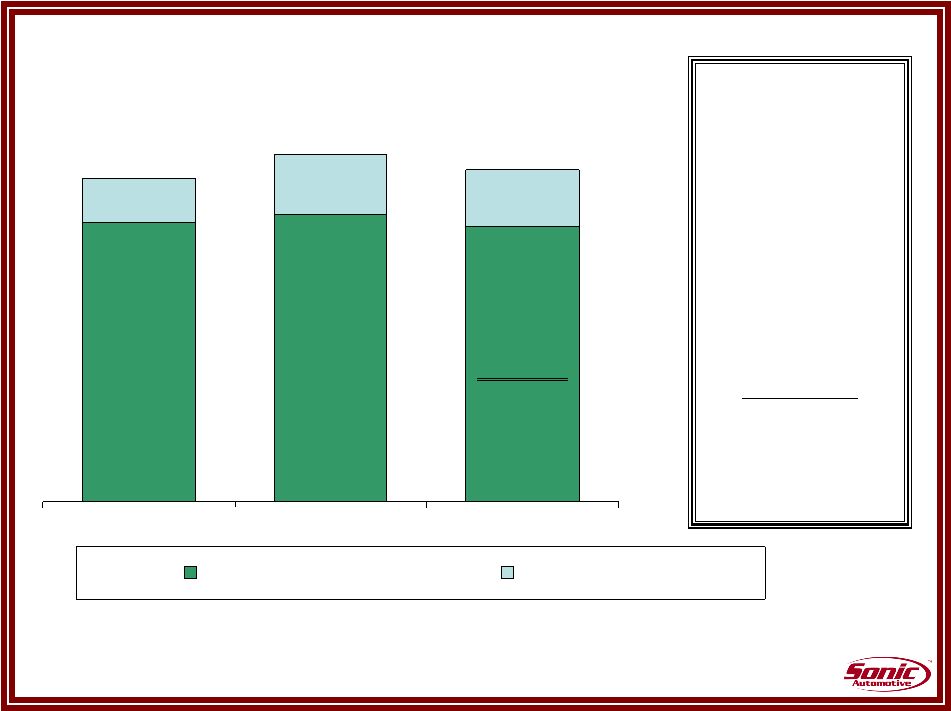 13 10.6% 14.5% 13.5% 66.2% 67.2% 69.0% Q2 2008 Q1 2009 Q2 2009 All Other Rent & Related SG&A Continuing Operations 83.5% 77.8% 79.7% •Total SG&A expenses were down 12.2% or $27 million from the prior year • Excluding rent, all other cost was down 100bps, despite drop in gross profit. Substantial reductions were made in essentially all other categories |
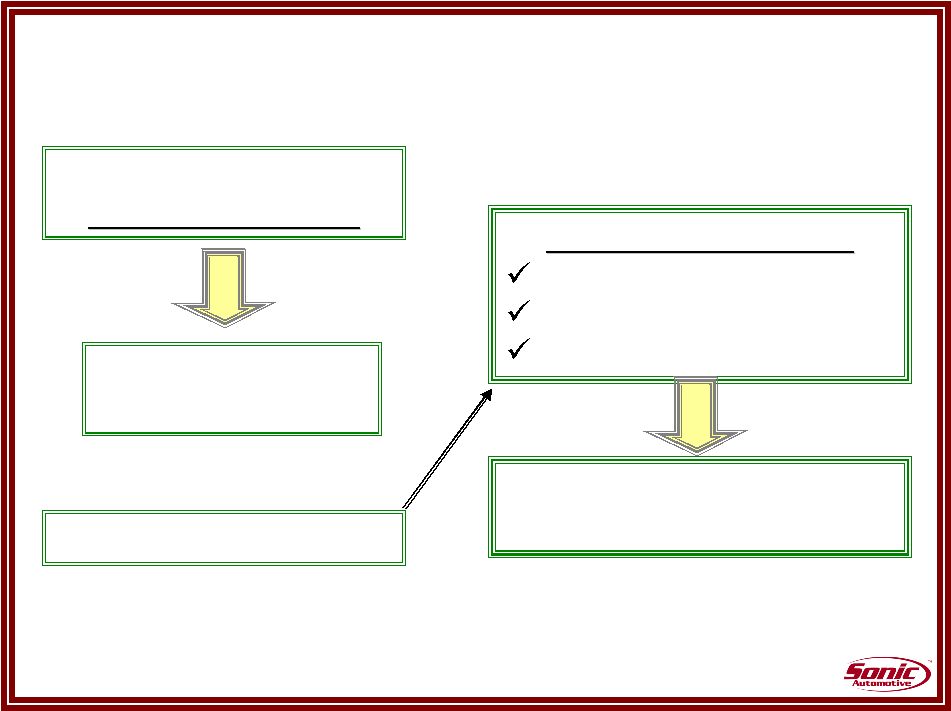 14 Operations Review Our People Results Results – – Q2 Q2 and and beyond beyond Associate engagement up Execution improved High productivity Goal: Goal: Employer of Choice Employer of Choice = Address Causes of Turnover Record Low Turnover IMPROVED PROFITABILITY |
 15 April May June South East Texas Central California Total Sonic* 57 136 52 Operations Review Sonic vs. Local Market * Bps difference between Sonic and the local market competition.
|
 16 Operations Review Used Vehicles Q2 used to new ratio 1.01 – all time record Preliminary July – retail unit volume up 20% Q1:09 Q2:09 Change Retail Volume 16,253 19,449 19.7% YOY % better/(worse) (4.0)% 12.8% Used Retail Margin 9.3% 8.0% (142) bps Used to New Ratio 0.93 1.01 777 bps Days Supply 29.4 29.7 |
 17 Operations Review Fixed Operations Revenue - Year-over-Year Customer Pay Total Q2: Luxury Imports 3.0% Non Luxury Imports (1.9%) Detroit 3 (6.6%) (1.1%) (1.1%) (12.3%) (3.3%) (15.0%) (9.0%) (3.0%) Customer Pay Warranty Internal Total |
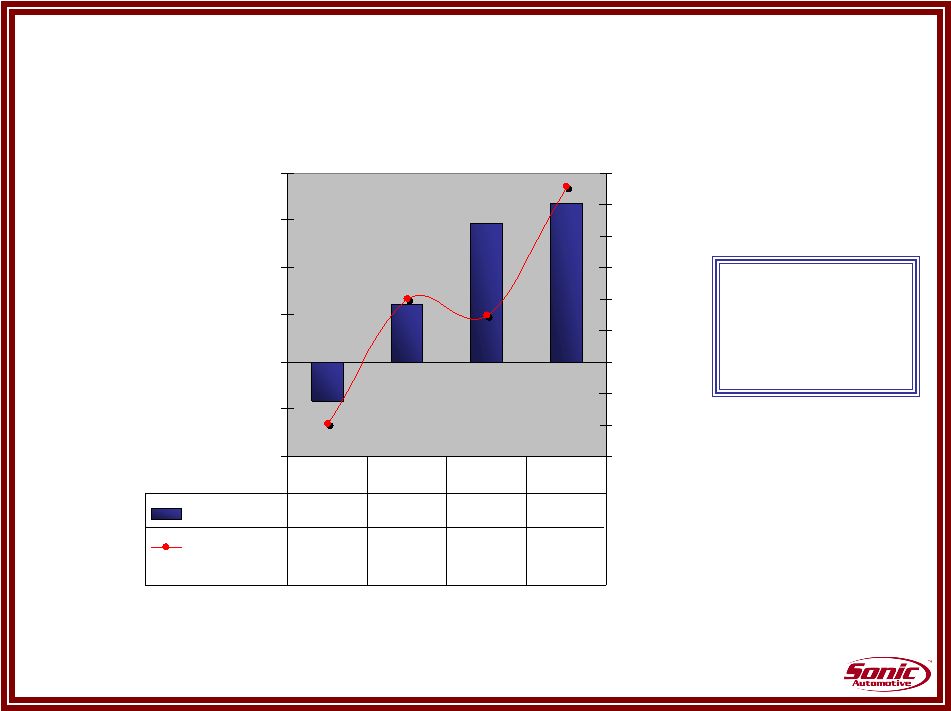 18 Operations Review Fixed Operations Trend Fixed Operations Trend -1.0% -0.5% 0.0% 0.5% 1.0% 1.5% 2.0% (120) (100) (80) (60) (40) (20) 0 20 40 60 Service CP -0.4% 0.6% 1.5% 1.7% Overall Margin (99) (20) (30) 51 Q3 08 Q4 08 Q1 09* Q2 09 *adjusted for business days Pct chg. Basis point chg. Steady year- over-year and sequential improvement CP Revenue Growth Margin Change |
 19 Summary The results speak for themselves Great performance in a tough economic climate Profitable and generating cash Business is sound Building operationally and culturally for the long term We will continue to focus on: Our people Our strategies |
 20 |