 Sonic Automotive, Inc.
1
1
Q4 Earnings Review
February 28, 2012
Q4 Earnings Review
February 28, 2012
Exhibit 99.2 |
 Sonic Automotive, Inc.
1
1
Q4 Earnings Review
February 28, 2012
Q4 Earnings Review
February 28, 2012
Exhibit 99.2 |
 Sonic Automotive, Inc.
2
2
Forward-Looking Statements
Forward-Looking Statements
This
presentation
contains
“forward-looking
statements”
within
the meaning of the Private
Securities Litigation Reform Act of 1995. These statements relate to future
events, are not historical facts and are based on our current expectations
and assumptions regarding our business, the economy and other future
conditions. These statements can generally be identified by lead-in
words
such
as
“believe”,
“expect”,
“anticipate”,
“intend”,
“plan”,
“foresee”,
“may”
,”will”
and other
similar words. Statements that describe our Company’s objectives, plans
or goals are also forward- looking statements. Examples of such
forward-looking information we may be discussing in this
presentation
include,
without
limitation,
further
implementation
of our operational strategies and
playbooks, future debt retirement, capital expenditures, operating margins and
revenues, inventory levels and new vehicle industry sales volume.
You are cautioned that these forward-looking statements are not
guarantees of future performance, involve risks and uncertainties and actual
results may differ materially from those projected in the
forward-looking statements as a result of various factors. These risks
and uncertainties include, among other things, (a) economic conditions in
the markets in which we operate, (b) the success of our operational
strategies, (c) our relationships with the automobile manufacturers and (d) new and
pre-owned vehicle sales volume. These risks and uncertainties, as well as
additional factors that could affect our forward-looking statements, are
described in our Form 10-K for the year ending December 31, 2010 and our
Form 10-Q for period ended September 30, 2011. These forward-looking
statements, risks, uncertainties and additional factors speak only as of the
date
of
this
presentation.
We
undertake
no
obligation
to
update
any such statements. |
 Sonic Automotive, Inc.
3
3
Sonic Automotive Q4 2011
Sonic Automotive Q4 2011
o
Quarter in Review
o
Financial Results
o
Operations Recap
o
Summary and Outlook
o
Quarter in Review
o
Financial Results
o
Operations Recap
o
Summary and Outlook |
 Sonic Automotive, Inc.
4
4
Overall Results
Overall Results
Strong
revenue
growth
–
up
12%
New
vehicle
revenue
up
15%
-
volume
up
12%
-
exceeds
industry growth
Pre-owned revenue up 12%
F&I revenue up 19%
Fixed Operations revenue up 2%
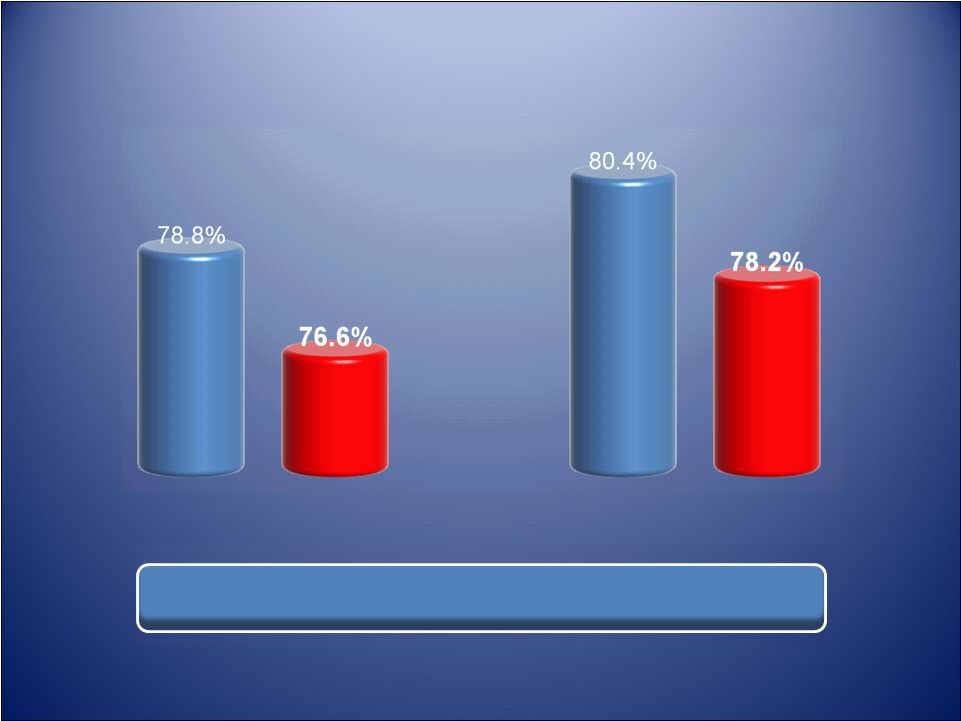
Adjusted SG&A to gross declined to 76.6% (1)
Adjusted income from continuing operations up $8M or 46%
(1) Adjusted Q4 2011 diluted EPS from continuing
operations was $0.43 per share vs $0.30 in prior year period
(1) Strong
revenue
growth
–
up
12%
New
vehicle
revenue
up
15%
-
volume
up
12%
-
exceeds
industry growth
Pre-owned revenue up 12%
F&I revenue up 19%
Fixed Operations revenue up 2%
Adjusted SG&A to gross declined to 76.6% (1)
Adjusted income from continuing operations up $8M or 46%
(1) Adjusted Q4 2011 diluted EPS from continuing
operations was $0.43 per share vs $0.30 in prior year period
(1) (1) –
See appendix for reconciliation to GAAP amounts
.
(1) –
See appendix for reconciliation to GAAP amounts
. |
 Sonic Automotive, Inc.
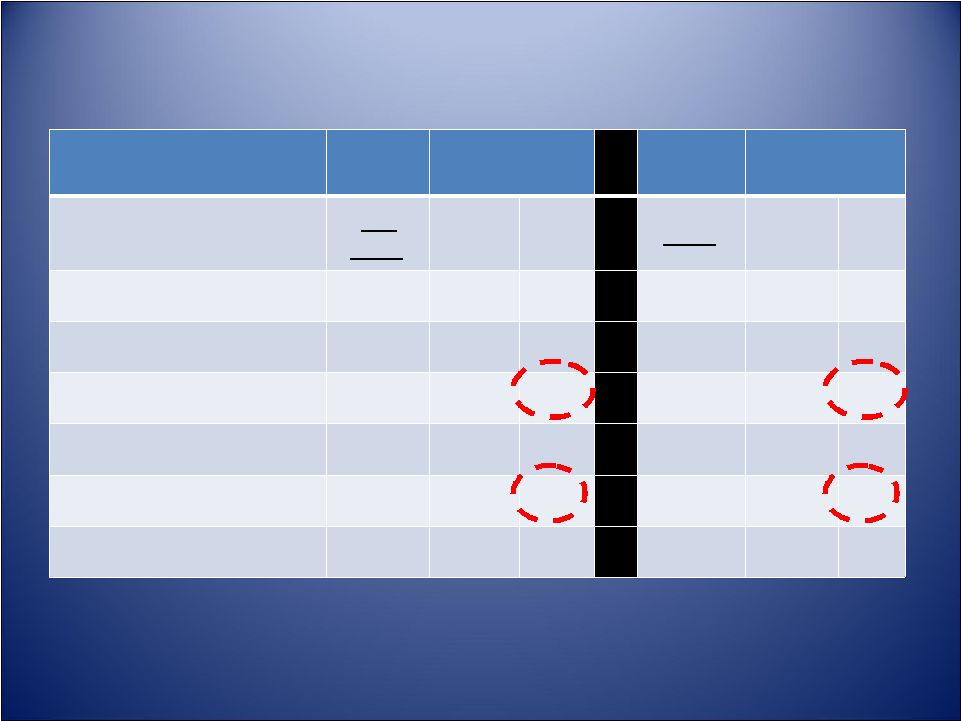
Adjusted Q4 and Full Year Results
(1)
Adjusted Q4 and Full Year Results
(1)
B/(W) than Q4
2010
B/(W) than FY
2010
(amounts in millions, except per share data)
Q4
2011
$
%
2011
$
%
Revenue
$ 2,071
$ 226
12%
$ 7,871
$ 990
14%
Gross Profit
$ 305
$ 21
7%
$ 1,209
$ 94
9%
Operating Profit (1)
$ 61
$ 10
19%
$ 223
$ 39
21%
Continuing Ops:
Profit (after tax) (1)
$ 25
$ 8
46%
$ 83
$ 26
45%
Diluted EPS (1)
$ 0.43
$ 0.13
43%
$ 1.39
$ 0.40
40%
5
5
`
(1) –
See appendix for reconciliation to GAAP amounts. |
 Sonic Automotive, Inc.
SG&A to Gross (1)
SG&A to Gross (1)
220 bps improvement in both periods
Q4 2010
Q4 2011
FY 2010
FY 2011
(1) –
See appendix for reconciliation to GAAP amounts. |
 Sonic Automotive, Inc.
Capital Spending
Capital Spending
7
7
(amounts in millions)
YTD Q4 2011
Estimated
2012
Real Estate Acquisitions
$ 91.4
$ 14.5
All Other Cap Ex
67.3
118.9
Subtotal
$ 158.7
$ 133.4
Less: Mortgage Funding
(54.4)
(33.5)
Total Cash Used –
Cap Ex
$ 104.3
$ 99.9 |
 Sonic Automotive, Inc.
8
8
Debt Covenants
Debt Covenants
Covenant
Actual Q4
2011
Memo:
March 2012
Covenant
Liquidity Ratio
>= 1.05
1.13
>= 1.10
Fixed Charge Coverage Ratio
>= 1.15
1.65
>= 1.20
Total Lease Adjusted Leverage
Ratio
<= 5.50
4.02
<= 5.50
Compliant with all Covenants |
 Sonic Automotive, Inc.
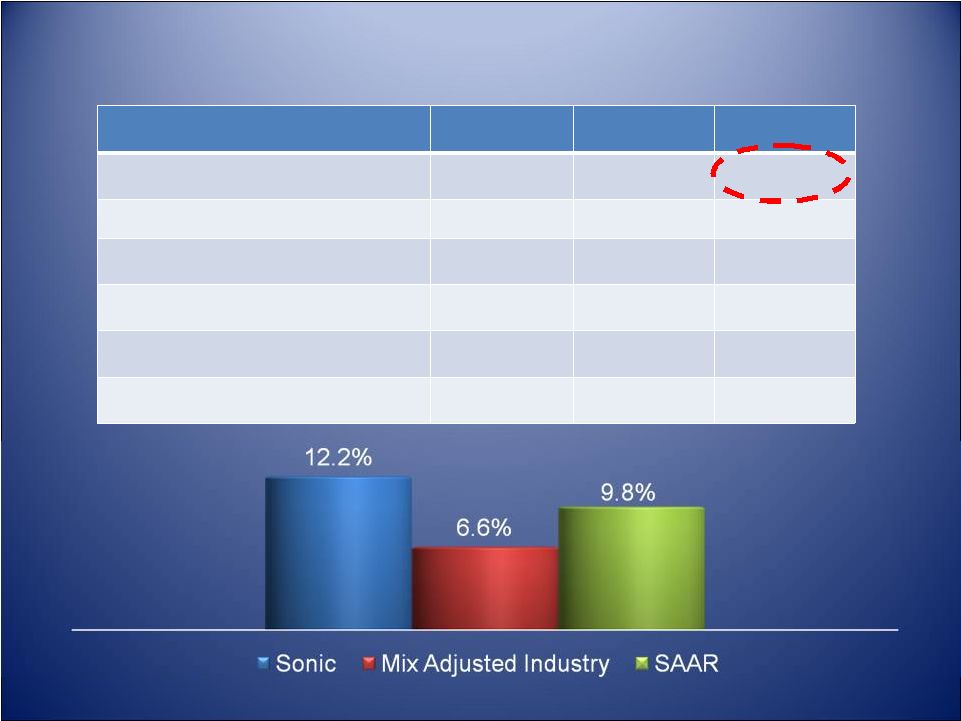
New Vehicles
New Vehicles
Q4 2011
Q4 2010
B/(W)
Retail Volume
30,928
27,011
14.5%
Total Volume (including fleet)
32,868
29,300
12.2%
Selling Price
$ 36,074
$ 35,297
2.2%
Gross Margin %
6.1%
6.3%
(20 bps)
GPU
$ 2,189
$ 2,225
($ 35)
Gross Profit
$ 72 million
$ 65 million
10.4%
9
9 |
 Sonic Automotive, Inc.
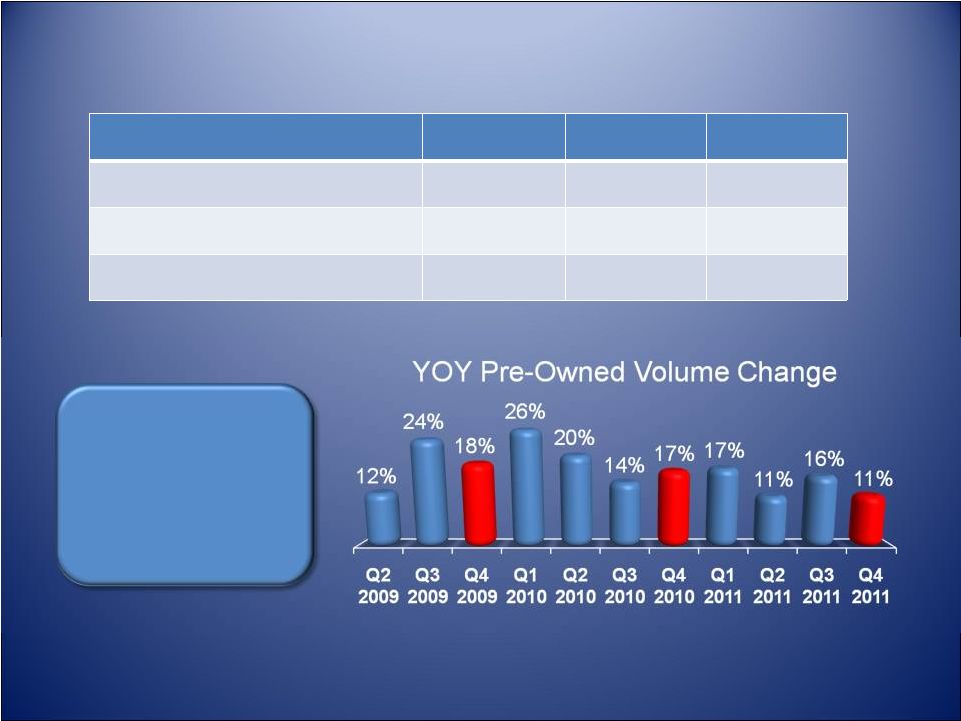
Pre-Owned Retail Vehicles
Pre-Owned Retail Vehicles
Q4 2011
Q4 2010
B/(W)
Retail Volume
23,880
21,429
11.4%
Pre-Owned Related Gross*
$
73 million
$
66 million
$
7 million
Pre-Owned to New Ratio
.77 to 1
.79 to 1
10
10
* -
Includes: pre-owned gross + pre-owned reconditioning gross + pre-owned
F&I gross 11 Consecutive
Quarters of
Double-Digit
Volume Growth |
 Sonic Automotive, Inc.
Pre-Owned Retail Vehicle Units
Pre-Owned Retail Vehicle Units
11
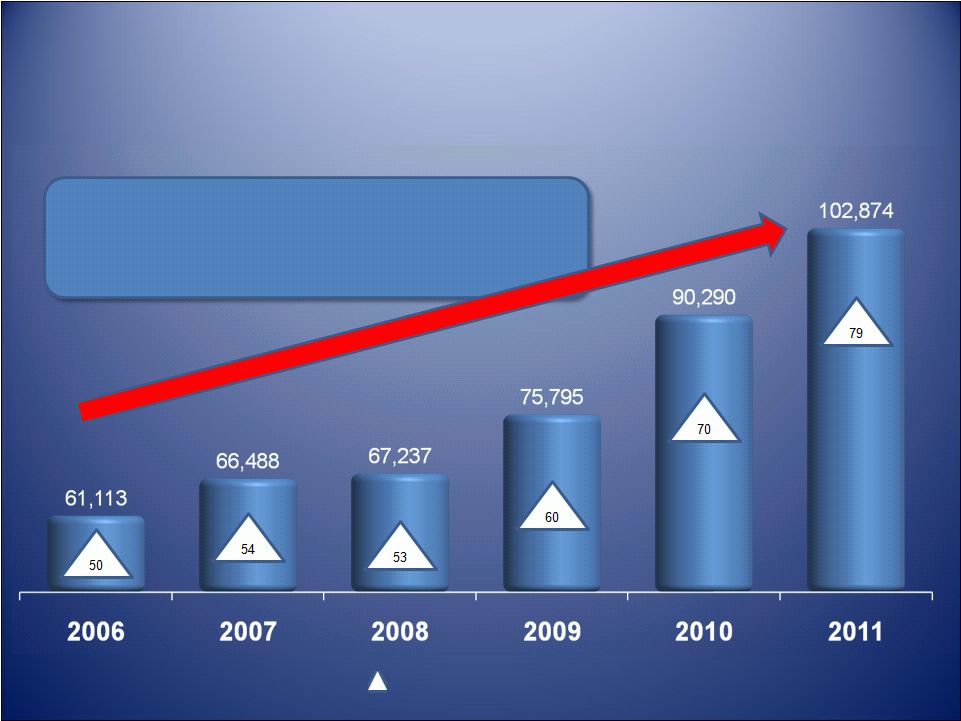
-Average Sold / Month / Store
Compounded Annual Growth Rate (CAGR):
Since
2008
–
15.2%
Since
2006
–
11.0% |
 Sonic Automotive, Inc.
Fixed Operations
Fixed Operations
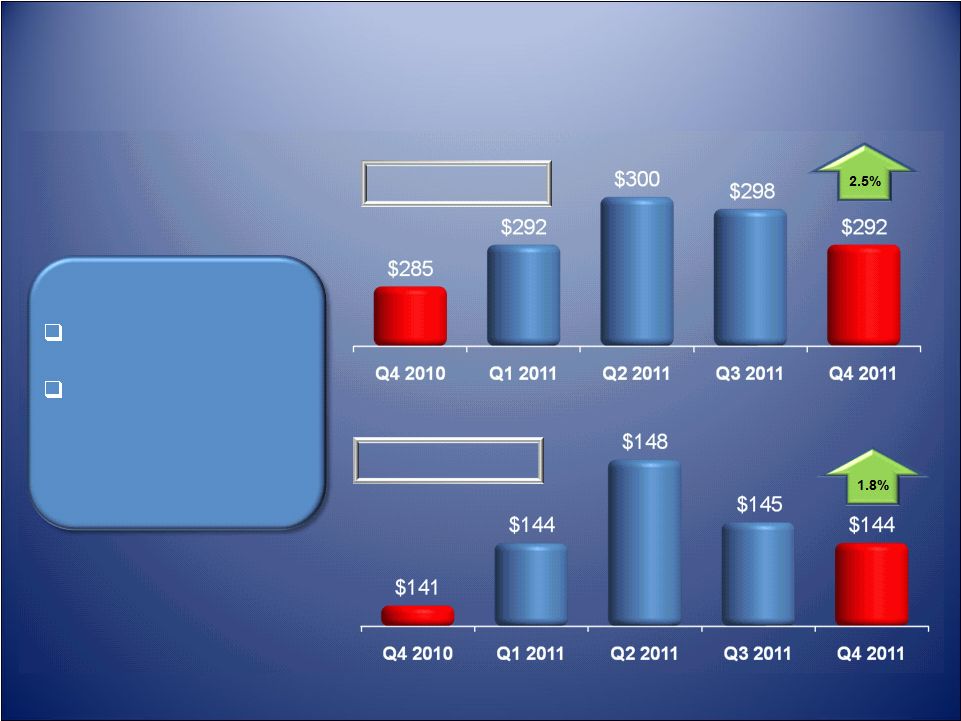
Revenue
Gross Profit
12
12
Customer Pay
gross up 4%
Overall gross profit
up 2% despite
lower
warranty
activity |
 Sonic Automotive, Inc.
Fixed Operations Revenue
Fixed Operations Revenue
13
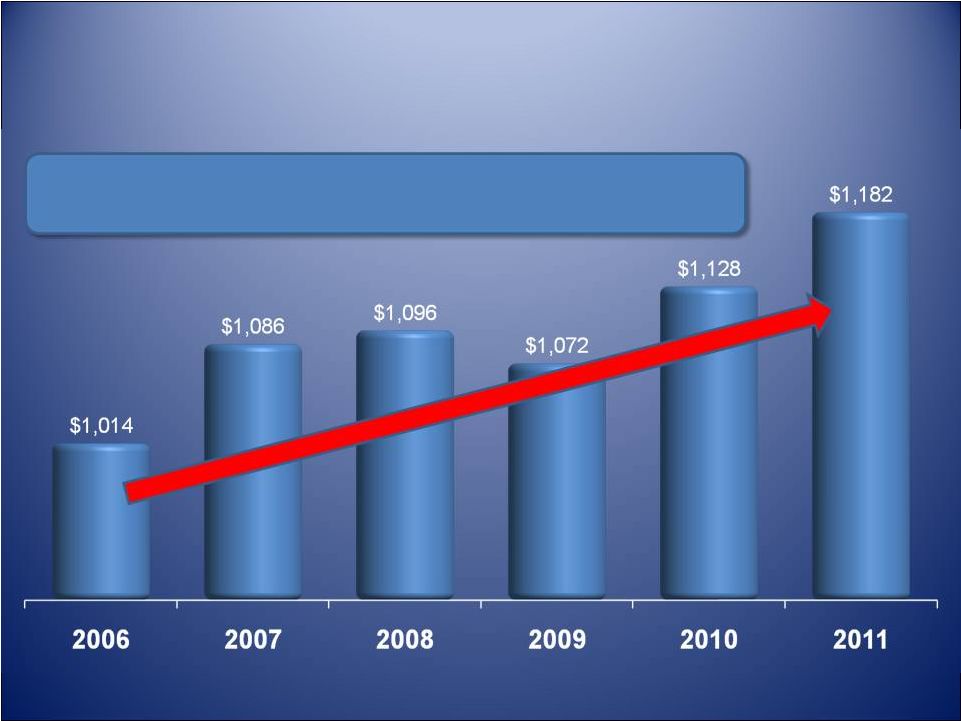
(Amounts in millions)
•
Revenue grew $34 million on average each year over the last five years
•
Revenue growth in four of the last five years |
 Sonic Automotive, Inc.
14
Summary
Summary
Automotive retail industry continues its recovery
SAAR rose steadily throughout 2011
Base business continues to grow
New vehicle market share continues to increase
Pre-Owned retail vehicle volume continues to grow at
double-digit rate
F&I and fixed operations are benefiting from higher
levels of retail activity
Investment in technology will continue
Automotive retail industry continues its recovery
SAAR rose steadily throughout 2011
Base business continues to grow
New vehicle market share continues to increase
Pre-Owned retail vehicle volume continues to grow at
double-digit rate
F&I and fixed operations are benefiting from higher
levels of retail activity
Investment in technology will continue |
 Sonic Automotive, Inc.
2012 Outlook
2012 Outlook
•
Expect New Vehicle SAAR of 13.5 Million
•
Pre-Owned Vehicle Growth in High Single Digits
•
Property Purchases to Continue
•
Expect SG&A to be Below 78%
•
Targeting 2012 Diluted EPS from Continuing
Operations of $1.55 -
$1.65
•
Expect New Vehicle SAAR of 13.5 Million
•
Pre-Owned Vehicle Growth in High Single Digits
•
Property Purchases to Continue
•
Expect SG&A to be Below 78%
•
Targeting 2012 Diluted EPS from Continuing
Operations of $1.55 -
$1.65
15
15 |
 Sonic Automotive, Inc.
16
16 |
 Sonic Automotive, Inc.
17
17
Reconciliation
of
Non-GAAP
Financial
Information
Three Months Ended December 31,
Adjusted 2011 B/(W)
2011
2010
than Adjusted 2010
($ in millions, shares in
thousands, except per share data)
As
Reported
Adjustments
As
Adjusted
As
Reported
Adjustments
As
Adjusted
$
%
Revenues
2,070.8
$
-
$
2,070.8
$
1,844.9
$
-
$
1,844.9
$
225.9
$
12.2%
Gross profit
305.3
-
305.3
284.5
-
284.5
20.8
7.3%
Gross margin
14.7%
14.7%
15.4%
15.4%
(70) bps
SG&A
(240.8)
6.8
(234.0)
(224.2)
-
(224.2)
(9.8)
4.4%
SG&A as % of gross profit
78.9%
76.6%
78.8%
78.8%
220
bps
Impairment charges
(1.0)
1.0
-
(0.1)
0.1
-
-
-
Depreciation and amortization
(10.6)
-
(10.6)
(9.3)
-
(9.3)
(1.3)
14.0%
Operating income
52.9
7.8
60.7
50.9
0.1
51.0
9.7
19.0%
Operating margin
2.6%
2.9%
2.8%
2.8%
(10) bps
Interest expense, floor plan
(4.9)
-
(4.9)
(5.9)
-
(5.9)
1.0
(16.9%)
Interest expense, other, net
(14.7)
-
(14.7)
(15.3)
-
(15.3)
0.6
(3.9%)
Interest expense, non-cash
(1.7)
-
(1.7)
(1.2)
(0.5)
(1.7)
-
-
Other income (expense), net
(0.3)
-
(0.3)
-
-
-
(0.3)
-
Income (loss) from continuing operations
20.4
5.0
(1)
25.4
65.8
(48.4)
(2)
17.4
8.0
46.0%
Income (loss) from discontinued operations
0.1
0.4
(1)
0.5
(1.4)
0.5
(2)
(0.9)
1.4
(155.6%)
Net income (loss)
20.5
$
5.4
$
25.9
$
64.4
$
(47.9)
$
16.5
$
9.4
$
57.0%
Diluted earnings (loss) per common share:
Earnings (loss) per share
from continuing operations
0.35
$
0.08
$
0.43
$
1.02
$
(0.72)
$
0.30
$
0.13
$
43.3%
Earnings (loss) per share from
discontinued operations
-
-
-
(0.02)
-
(0.02)
0.02
(100.0%)
Earnings (loss) per common share
0.35
$
0.08
$
0.43
$
1.00
$
(0.72)
$
0.28
$
0.15
$
53.6%
Weighted average shares outstanding
64,467
64,467
66,042
66,042
(1) Represents tax-effected amounts related to lease exit
adjustments, legal settlement charges, and property impairment charges.
(2) Represents tax-effected amounts related to lease exit
adjustments, property impairment charges, interest rate swaps and tax items. |
 Sonic Automotive, Inc.
18
18
Reconciliation
of
Non-GAAP
Financial
Information
Year Ended December 31,
Adjusted 2011 B/(W)
2011
2010
than Adjusted 2010
($ in millions, shares in
thousands, except per share data)
As
Reported
Adjustments
As
Adjusted
As
Reported
Adjustments
As
Adjusted
$
%
Revenues
7,871.3
$
-
$
7,871.3
$
6,880.8
$
-
$
6,880.8
$
990.5
$
14.4%
Gross profit
1,209.1
-
1,209.1
1,114.7
-
1,114.7
94.4
8.5%
Gross margin
15.4%
15.4%
16.2%
16.2%
(80) bps
SG&A
(952.4)
6.8
(945.6)
(896.7)
0.7
(896.0)
(49.6)
5.5%
SG&A as % of gross profit
78.8%
78.2%
80.4%
80.4%
220
bps
Impairment charges
(1.2)
1.2
-
(0.2)
0.2
-
-
-
Depreciation and amortization
(40.7)
-
(40.7)
(35.2)
-
(35.2)
(5.5)
15.6%
Operating income
214.8
8.0
222.8
182.6
0.9
183.5
39.3
21.4%
Operating margin
2.7%
2.8%
2.7%
2.7%
(10) bps
Interest expense, floor plan
(19.6)
-
(19.6)
(21.5)
-
(21.5)
1.9
(8.8%)
Interest expense, other, net
(60.7)
-
(60.7)
(63.3)
1.5
(61.8)
1.1
(1.8%)
Interest expense, non-cash
(7.5)
-
(7.5)
(11.8)
4.9
(6.9)
(0.6)
8.7%
Other income (expense), net
(1.0)
-
(1.0)
(7.5)
7.7
0.2
(1.2)
(600.0%)
Income (loss) from continuing operations
77.6
5.0
(1)
82.6
95.9
(39.1)
(2)
56.8
25.8
45.4%
Income (loss) from discontinued operations
(1.3)
(0.5)
(1)
(1.8)
(6.0)
0.7
(2)
(5.3)
3.5
(66.0%)
Net income (loss)
76.3
$
4.5
$
80.8
$
89.9
$
(38.4)
$
51.5
$
29.3
$
56.9%
Diluted earnings (loss) per common share:
Earnings (loss) per share
from continuing operations
1.31
$
0.08
$
1.39
$
1.58
$
(0.59)
$
0.99
$
0.40
$
40.4%
Earnings (loss) per share from
discontinued operations
(0.02)
(0.01)
(0.03)
(0.09)
0.01
(0.08)
0.05
(62.5%)
Earnings (loss) per common share
1.29
$
0.07
$
1.36
$
1.49
$
(0.58)
$
0.91
$
0.45
$
49.5%
Weighted average shares outstanding
65,464
65,464
65,794
65,794
(1) Represents tax-effected amounts related to lease exit
adjustments, legal settlement charges, and property impairment charges.
(2) Represents tax-effected amounts related to hail damage, lease
exit adjustments, property impairment charges, interest rate swaps, debt restructuring and tax items. |
 Sonic Automotive, Inc.
19
19
Reconciliation
of
Non-GAAP
Financial
Information
Three Months Ended December 31, 2011
Continuing Operations
Discontinued Operations
Total Operations
($ in millions, shares in
thousands, except per share data)
Net Income
(Loss):
Numerator
Share
Count:
Denominator
Diluted
EPS
Net Income
(Loss):
Numerator
Share
Count:
Denominator
Diluted
EPS
Net Income
(Loss):
Numerator
Share
Count:
Denominator
Diluted
EPS
Reported basic
20.4
$
52,194
0.1
$
52,194
20.5
$
52,194
Effect of dilutive securities:
Two class method
(0.3)
-
-
-
(0.3)
-
Contingently convertible debt
2.3
11,713
-
11,713
2.3
11,713
Stock compensation plans
-
560
-
560
-
560
Reported
diluted 22.4
64,467
0.35
$
0.1
64,467
-
$
22.5
64,467
0.35
$
Adjustments (tax-effected):
Lease exit adjustments
and legal settlement charges
4.4
-
0.3
-
4.7
-
Property impairment charges
0.6
-
-
-
0.6
-
Subtotal
27.4
64,467
0.43
$
0.4
64,467
-
$
27.8
64,467
0.43
$
Effect of dilutive securities:
Two class method
-
-
-
-
-
-
Adjusted diluted
27.4
$
64,467
0.43
$
0.4
$
64,467
-
$
27.8
$
64,467
0.43
$ |
 Sonic Automotive, Inc.
20
20
Reconciliation
of
Non-GAAP
Financial
Information
Three Months Ended December 31, 2010
Continuing Operations
Discontinued Operations
Total Operations
($ in millions, shares in
thousands, except per share data)
Net Income
(Loss):
Numerator
Share
Count:
Denominator
Diluted
EPS
Net Income
(Loss):
Numerator
Share
Count:
Denominator
Diluted
EPS
Net Income
(Loss):
Numerator
Share
Count:
Denominator
Diluted
EPS
Reported basic
65.8
$
52,401
(1.4)
$
52,401
64.4
$
52,401
Effect of dilutive securities:
Two class method
(0.6)
-
-
-
(0.6)
-
Contingently convertible debt
2.3
12,890
-
12,890
2.3
12,890
Stock compensation plans
-
751
-
751
-
751
Reported
diluted 67.5
66,042
1.02
$
(1.4)
66,042
(0.02)
$
66.1
66,042
1.00
$
Adjustments (tax-effected):
Property impairment charges
0.1
-
-
-
0.1
-
Interest rate swaps
(0.3)
-
-
-
(0.3)
-
Lease exit adjustments
-
-
0.6
-
0.6
-
Tax items
(48.2)
-
-
-
(48.2)
-
Subtotal
19.1
66,042
0.29
$
(0.8)
66,042
(0.01)
$
18.3
66,042
0.28
$
Effect of dilutive securities:
Two class method
0.5
-
(0.5)
-
-
-
Adjusted diluted
19.6
$
66,042
0.30
$
(1.3)
$
66,042
(0.02)
$
18.3
$
66,042
0.28
$ |
 Sonic Automotive, Inc.
21
21
Reconciliation
of
Non-GAAP
Financial
Information
Year Ended December 31, 2011
Continuing Operations
Discontinued Operations
Total Operations
($ in millions, shares in
thousands, except per share data)
Net Income
(Loss):
Numerator
Share
Count:
Denominator
Diluted
EPS
Net Income
(Loss):
Numerator
Share
Count:
Denominator
Diluted
EPS
Net Income
(Loss):
Numerator
Share
Count:
Denominator
Diluted
EPS
Reported basic
77.6
$
52,358
(1.3)
$
52,358
76.3
$
52,358
Effect of dilutive securities:
Two class method
(0.9)
-
-
-
(0.9)
-
Contingently convertible debt
9.3
12,517
-
12,517
9.3
12,517
Stock compensation plans
-
589
-
589
-
589
Reported
diluted 86.0
65,464
1.31
$
(1.3)
65,464
(0.02)
$
84.7
65,464
1.29
$
Adjustments (tax-effected):
Lease exit adjustments
and legal settlement charges
4.2
-
(0.4)
-
3.8
-
Property impairment charges
0.7
-
-
-
0.7
-
Subtotal
90.9
65,464
1.39
$
(1.7)
65,464
(0.03)
$
89.2
65,464
1.36
$
Effect of dilutive securities:
Two class method
(0.1)
-
-
-
(0.1)
-
Adjusted diluted
90.8
$
65,464
1.39
$
(1.7)
$
65,464
(0.03)
$
89.1
$
65,464
1.36
$ |
 Sonic Automotive, Inc.
22
22
Reconciliation of Non-GAAP Financial Information
Year Ended December 31, 2010
Continuing Operations
Discontinued Operations
Total Operations
($ in millions, shares in
thousands, except per share data)
Net Income
(Loss):
Numerator
Share
Count:
Denominator
Diluted
EPS
Net Income
(Loss):
Numerator
Share
Count:
Denominator
Diluted
EPS
Net Income
(Loss):
Numerator
Share
Count:
Denominator
Diluted
EPS
Reported basic
95.9
$
52,214
(6.0)
$
52,214
89.9
$
52,214
Effect of dilutive securities:
Two class method
(0.9)
-
-
-
(0.9)
-
Contingently convertible debt
9.0
12,890
0.1
12,890
9.1
12,890
Stock compensation plans
-
690
-
690
-
690
Reported
diluted 104.0
65,794
1.58
$
(5.9)
65,794
(0.09)
$
98.1
65,794
1.49
$
Adjustments (tax-effected):
Hail damage
0.4
-
-
-
0.4
-
Property impairment charges
0.2
-
-
-
0.2
-
Interest rate swaps
3.0
-
-
-
3.0
-
Debt restructuring
5.6
-
-
-
5.6
-
Lease exit adjustments
-
-
0.6
-
0.6
-
Tax items
(48.2)
-
-
-
(48.2)
-
Subtotal
65.0
65,794
0.99
$
(5.3)
65,794
(0.08)
$
59.7
65,794
0.91
$
Effect of dilutive securities:
Two class method
0.3
-
-
-
0.3
-
Adjusted diluted
65.3
$
65,794
0.99
$
(5.3)
$
65,794
(0.08)
$
60.0
$
65,794
0.91
$ |