Exhibit 99.2
| Exhibit 99.2
|
Exhibit 99.2
Q2 2013 Earnings Review July 23, 2013
Sonic Automotive, Inc. 1
|
|
Forward-Looking Statements
This presentation contains “forward-looking statements” within the meaning of the Private Securities Litigation Reform Act of 1995. These statements relate to future events, are not historical facts and are based on our current expectations and assumptions regarding our business, the economy and other future conditions. These statements can generally be identified by lead-in words such as “believe”, “expect”, “anticipate”, “intend”, “plan”, “foresee”, “may” ,“will” and other similar words. Statements that describe our Company’s objectives, plans or goals are also forward-looking statements. Examples of such forward-looking information we may be discussing in this presentation include, without limitation, further implementation of our operational strategies and playbooks, future debt retirement, capital expenditures, operating margins and revenues, inventory levels and new vehicle industry sales volume.
You are cautioned that these forward-looking statements are not guarantees of future performance, involve risks and uncertainties and actual results may differ materially from those projected in the forward-looking statements as a result of various factors. These risks and uncertainties include, among other things, (a) economic conditions in the markets in which we operate, (b) the success of our operational strategies, (c) our relationships with the automobile manufacturers and (d) new and pre-owned vehicle sales volume. These risks and uncertainties, as well as additional factors that could affect our forward-looking statements, are described in our Form 10-K for the year ending December 31, 2012.
These forward-looking statements, risks, uncertainties and additional factors speak only as of the date of this presentation. We undertake no obligation to update any such statements.
Sonic Automotive, Inc. 2
|
|
Contents
Quarter in Review
Financial Results
Operations Recap
Summary and Outlook
Sonic Automotive, Inc. 3
|
|
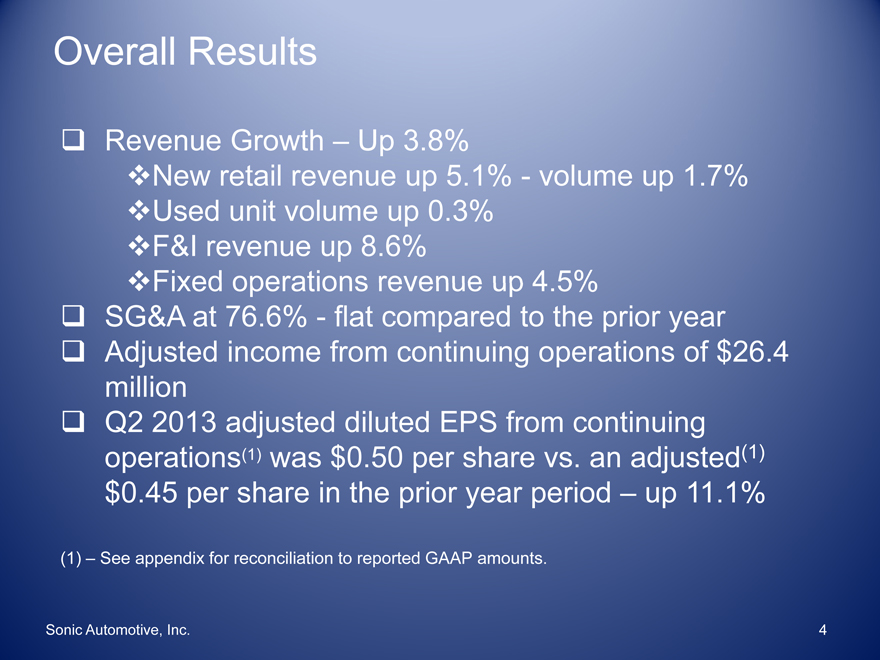
Overall Results
Revenue Growth – Up 3.8%
New retail revenue up 5.1%—volume up 1.7%
Used unit volume up 0.3%
F&I revenue up 8.6%
Fixed operations revenue up 4.5%
SG&A at 76.6%—flat compared to the prior year
Adjusted income from continuing operations of $26.4 million
Q2 2013 adjusted diluted EPS from continuing operations(1) was $0.50 per share vs. an adjusted(1) $0.45 per share in the prior year period – up 11.1%
| (1) |
|
– See appendix for reconciliation to reported GAAP amounts. |
Sonic Automotive, Inc. 4
|
|
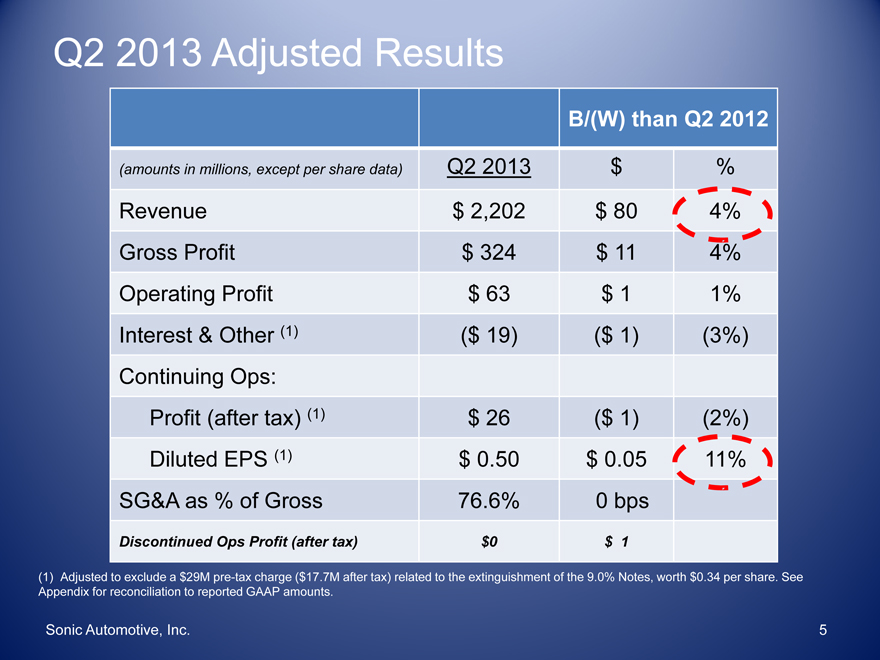
Q2 2013 Adjusted Results
B/(W) than Q2 2012
(amounts in millions, except per share data) Q2 2013 $%
Revenue $ 2,202 $ 80 4%
Gross Profit $ 324 $ 11 4%
Operating Profit $ 63 $ 1 1%
Interest & Other (1) ($ 19) ($ 1) (3%)
Continuing Ops:
Profit (after tax) (1) $ 26 ($ 1) (2%)
Diluted EPS (1) $ 0.50 $ 0.05 11%
SG&A as % of Gross 76.6% 0 bps
Discontinued Ops Profit (after tax) $0 $ 1
(1) Adjusted to exclude a $29M pre-tax charge ($17.7M after tax) related to the extinguishment of the 9.0% Notes, worth $0.34 per share. See Appendix for reconciliation to reported GAAP amounts.
Sonic Automotive, Inc. 5
|
|
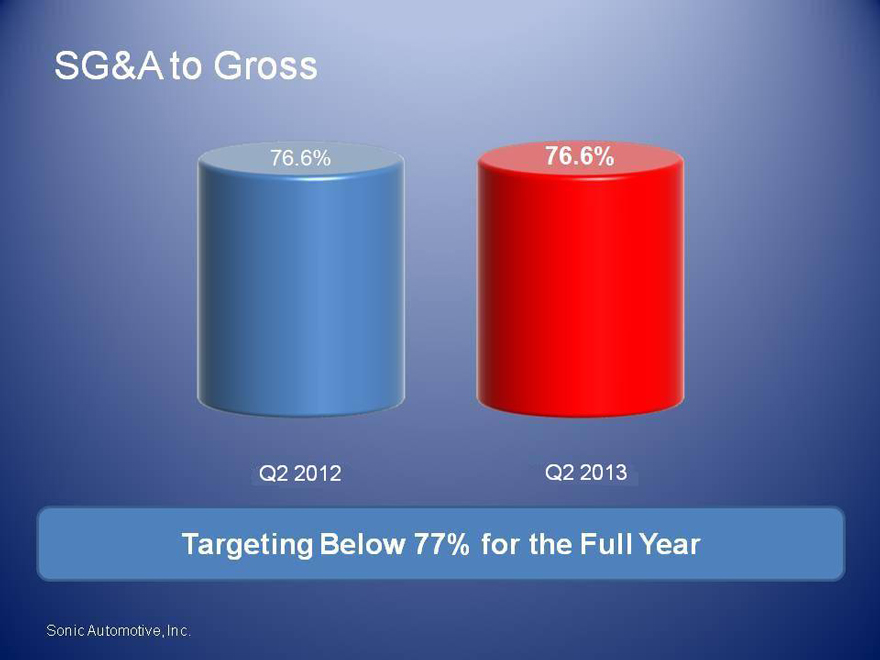
SG&A to Gross
76.6% 76.6%
Q1 2012
Q1 2013
Targeting Below 77% for the Full Year
Sonic Automotive, Inc.
|
|
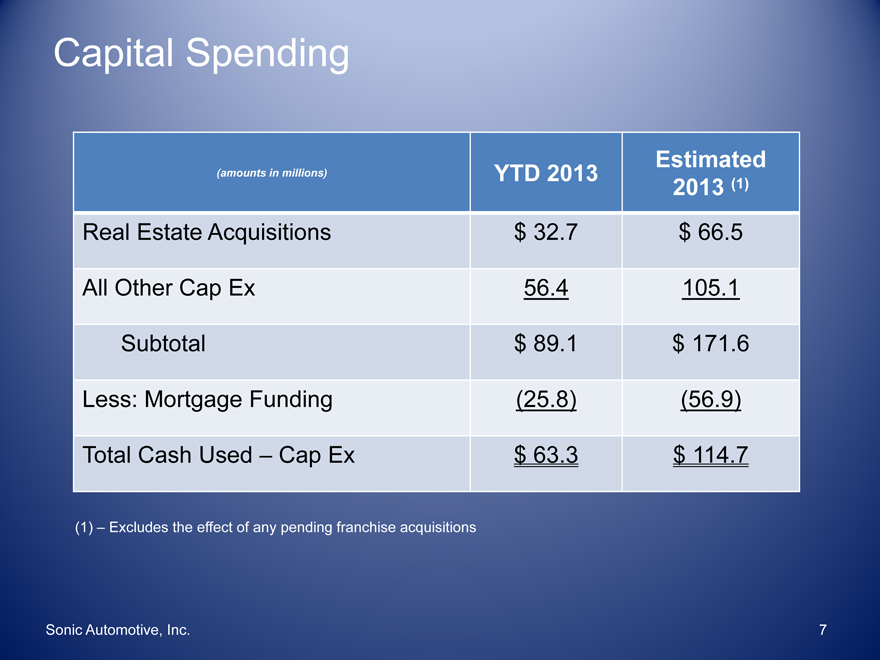
Capital Spending
Estimated
(amounts in millions) YTD 2013 2013 (1)
Real Estate Acquisitions $ 32.7 $ 66.5
All Other Cap Ex 56.4 105.1
Subtotal $ 89.1 $ 171.6
Less: Mortgage Funding (25.8) (56.9)
Total Cash Used – Cap Ex $ 63.3 $ 114.7
| (1) |
|
– Excludes the effect of any pending franchise acquisitions |
Sonic Automotive, Inc. 7
|
|
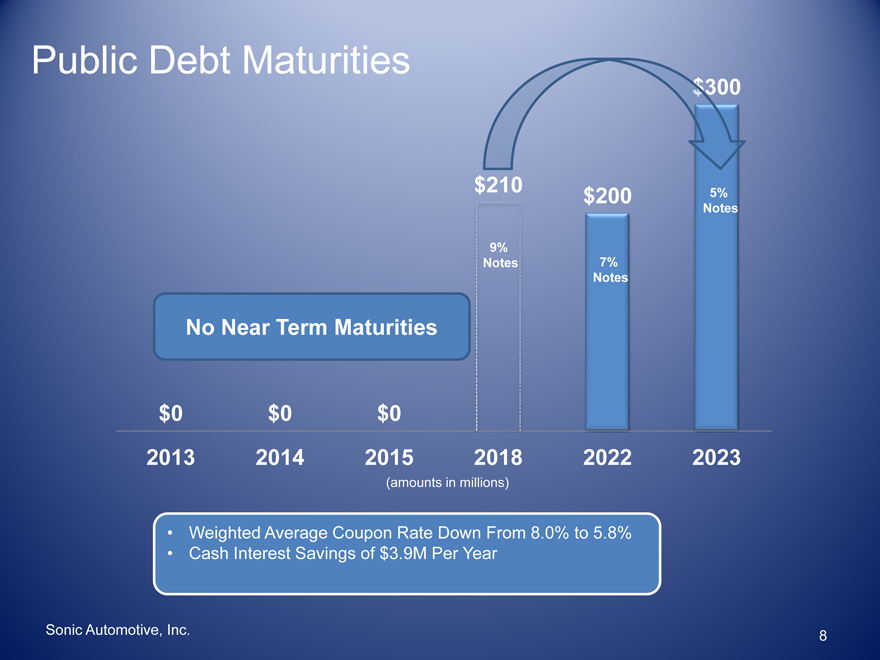
Public Debt Maturities
$300
$210 $200 5%
Notes
9%
Notes 7%
Notes
No Near Term Maturities
$0 $0 $0
2013 2014 2015 2018 2022 2023
(amounts in millions)
Weighted Average Coupon Rate Down From 8.0% to 5.8% Cash Interest Savings of $3.9M Per Year
Sonic Automotive, Inc. 8
|
|
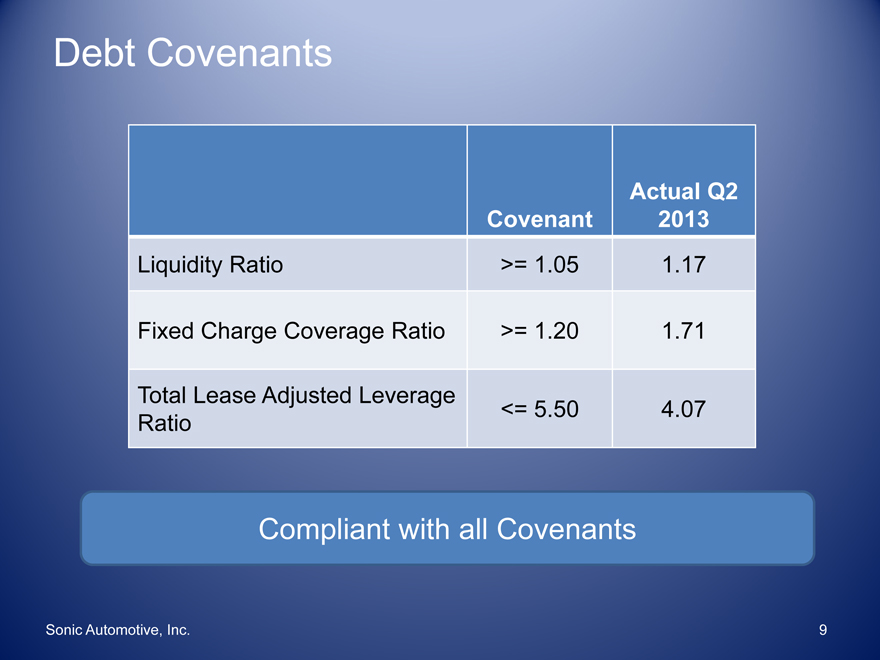
Debt Covenants
Actual Q2
Covenant 2013
Liquidity Ratio >= 1.05 1.17
Fixed Charge Coverage Ratio >= 1.20 1.71
Total Lease Adjusted Leverage <= 5.50 4.07
Ratio
Compliant with all Covenants
Sonic Automotive, Inc.
9
|
|
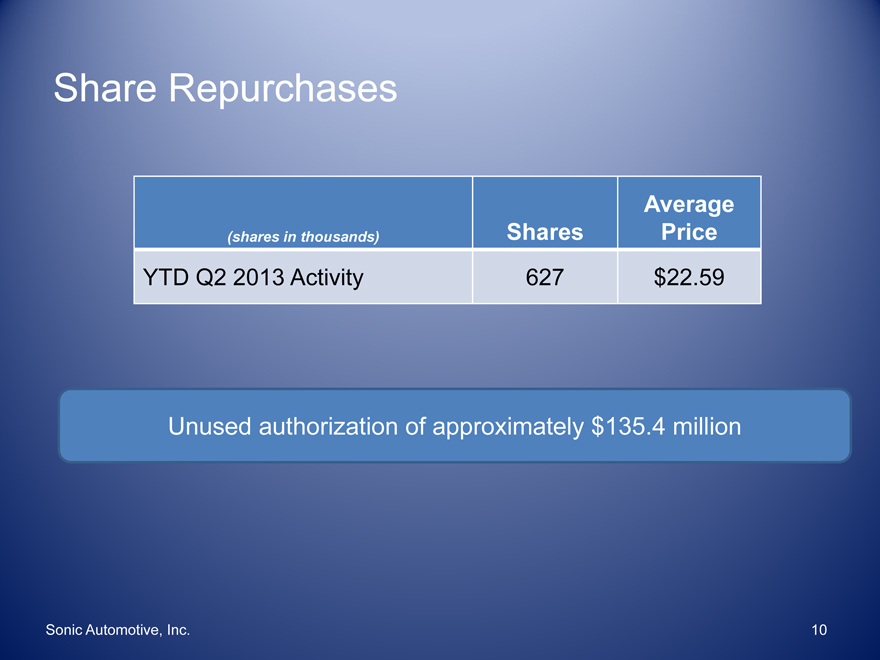
Share Repurchases
Average
(shares in thousands) Shares Price
YTD Q2 2013 Activity 627 $22.59
Unused authorization of approximately $135.4 million
Sonic Automotive, Inc.
10
|
|
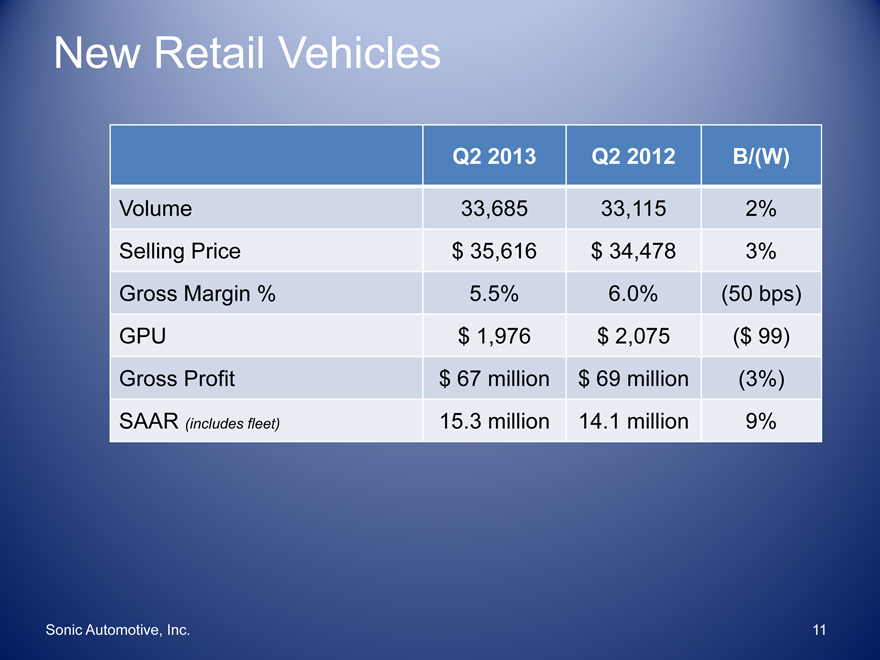
New Retail Vehicles
Q2 2013 Q2 2012 B/(W)
Volume 33,685 33,115 2%
Selling Price $ 35,616 $ 34,478 3%
Gross Margin % 5.5% 6.0% (50 bps)
GPU $ 1,976 $ 2,075 ($ 99)
SAAR (includes fleet) 15.3 million 14.1 million 9%
Sonic Automotive, Inc.
11
|
|
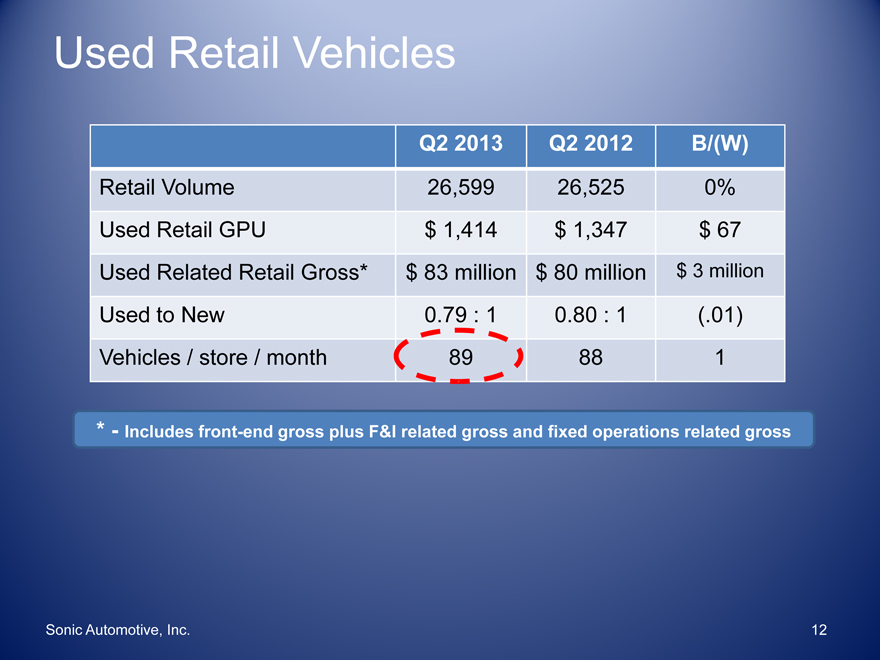
Used Retail Vehicles
Q2 2013 Q2 2012 B/(W)
Retail Volume 26,599 26,525 0%
Used Retail GPU $ 1,414 $ 1,347 $ 67
Used Related Retail Gross* $ 83 million $ 80 million $ 3 million
Used to New 0.79 : 1 0.80 : 1 (.01)
Vehicles / store / month 89 88 1
| *—Includes |
|
front-end gross plus F&I related gross and fixed operations related gross |
Sonic Automotive, Inc.
12
|
|
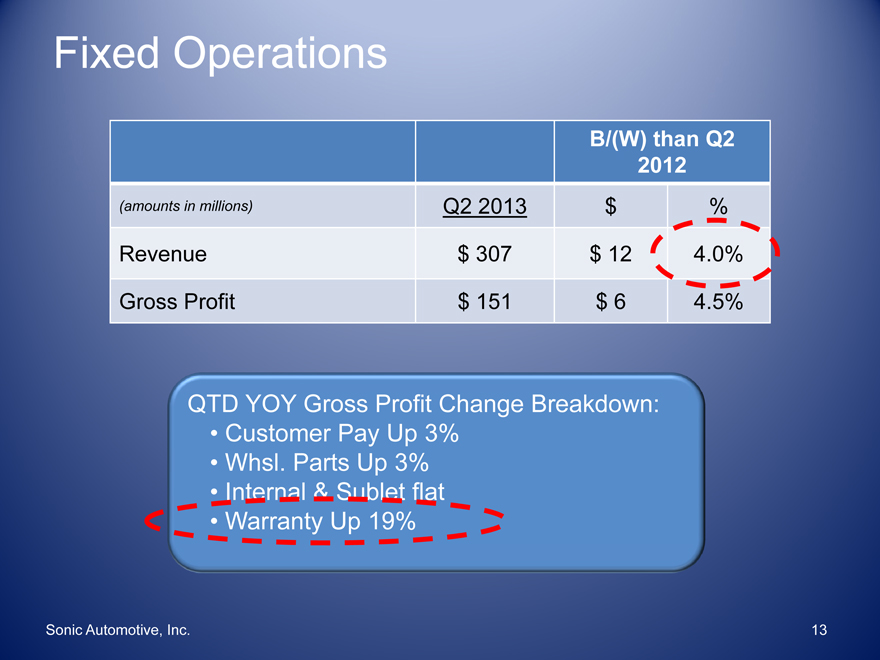
Fixed Operations
B/(W) than Q2
2012
(amounts in millions) Q2 2013 $%
Revenue $ 307 $ 12 4.0%
Gross Profit $ 151 $ 6 4.5%
QTD YOY Gross Profit Change Breakdown:
Customer Pay Up 3%
Whsl. Parts Up 3%
Internal & Sublet flat
Warranty Up 19%
Sonic Automotive, Inc.
13
|
|
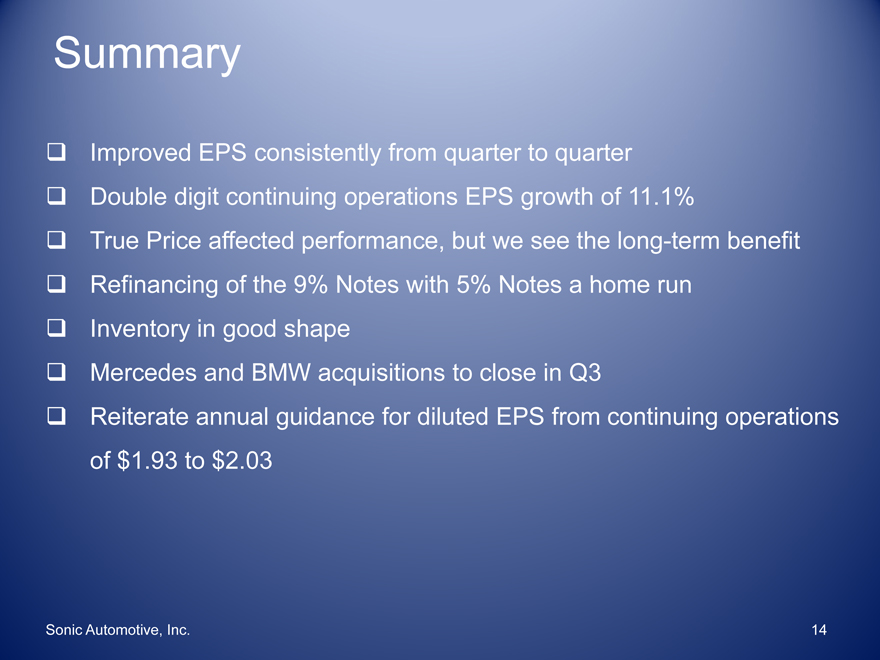
Summary
Improved EPS consistently from quarter to quarter Double digit continuing operations EPS growth of 11.1%
True Price affected performance, but we see the long-term benefit Refinancing of the 9% Notes with 5% Notes a home run Inventory in good shape Mercedes and BMW acquisitions to close in Q3 Reiterate annual guidance for diluted EPS from continuing operations of $1.93 to $2.03
Sonic Automotive, Inc.
14
|
|
Appendix
Sonic Automotive, Inc.
15
|
|
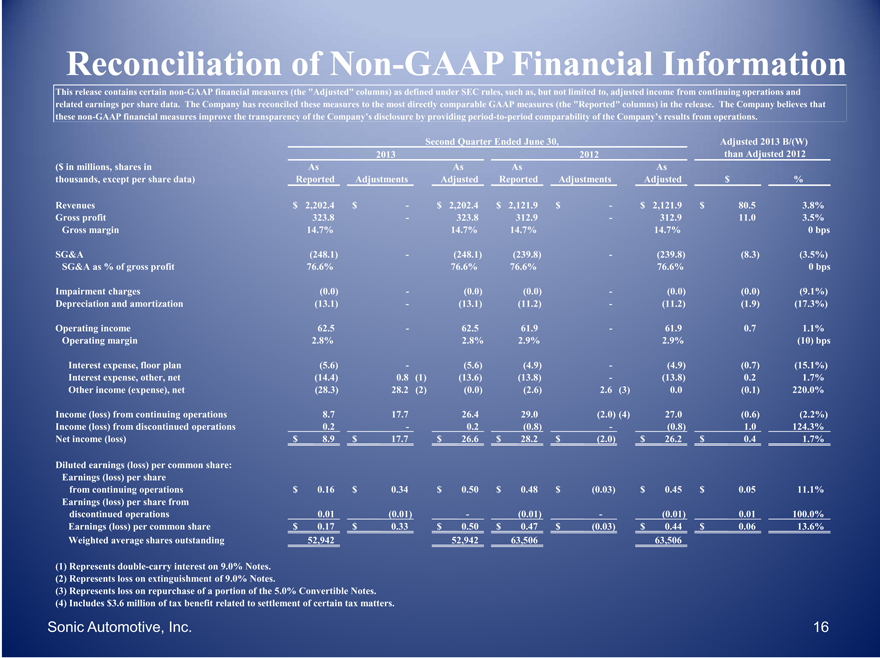
Reconciliation of Non-GAAP Financial Information
This release contains certain non-GAAP financial measures (the “Adjusted” columns) as defined under SEC rules, such as, but not limited to, adjusted income from continuing operations and
related earnings per share data. The Company has reconciled these measures to the most directly comparable GAAP measures (the “Reported” columns) in the release. The Company believes that
these non-GAAP financial measures improve the transparency of the Company’s disclosure by providing period-to-period comparability of the Company’s results from operations.
Second Quarter Ended June 30, Adjusted 2013 B/(W)
2013 2012 than Adjusted 2012
($ in millions, shares in As As As As
thousands, except per share data) Reported Adjustments Adjusted Reported Adjustments Adjusted $ %
Revenues $ 2,202.4 $ — $ 2,202.4 $ 2,121.9 $ — $ 2,121.9 $ 80.5 3.8%
Gross profit 323.8 — 323.8 312.9 — 312.9 11.0 3.5%
Gross margin 14.7% 14.7% 14.7% 14.7% 0 bps
SG&A (248.1) — (248.1) (239.8) — (239.8) (8.3) (3.5% )
SG&A as % of gross profit 76.6% 75.4% 76.6% 75.3% (10) bps
Impairment charges (0.0) — (0.0) (0.0) — (0.0) (0.0) (9.1% )
Depreciation and amortization (13.1) — (13.1) (11.2) — (11.2) (1.9) (17.3% )
Operating income 62.5 — 62.5 61.9 — 61.9 0.7 1.1%
Operating margin 2.8% 3.0% 2.9% 3.1% (10) bps
Interest expense, floor plan (5.6) — (5.6) (4.9) — (4.9) (0.7) (15.1% )
Interest expense, other, net (14.4) 0.8 (1) (13.6) (13.8) — (13.8) 0.2 1.7%
Other income (expense), net (28.3) 28.2 (2) (0.0) (2.6) 2.6 (3) 0.0 (0.1) 220.0%
Income (loss) from continuing operations 8.7 17.7 26.4 29.0 (2.0) (4) 27.0 (0.6) (2.2% )
Income (loss) from discontinued operations 0.2 — 0.2 (0.8) — (0.8) 1.0 124.3%
Net income (loss) $ 8.9 $ 17.7 $ 26.6 $ 28.2 $ (2.0) $ 26.2 $ 0.4 1.7%
Diluted earnings (loss) per common share:
Earnings (loss) per share
from continuing operations $ 0.16 $ 0.34 $ 0.50 $ 0.48 $ (0.03) $ 0.45 $ 0.05 11.1%
Earnings (loss) per share from
discontinued operations 0.01 (0.01) — (0.01) — (0.01) 0.01 100.0%
Earnings (loss) per common share $ 0.17 $ 0.33 $ 0.50 $ 0.47 $ (0.03) $ 0.44 $ 0.06 13.6%
Weighted average shares outstanding 52,942 52,942 63,506 63,506
| (1) |
|
Represents double-carry interest on 9.0% Notes . |
| (2) |
|
Represents loss on extinguishment of 9.0% Notes. |
| (3) |
|
Represents loss on repurchase of a portion of the 5.0% Convertible Notes. |
| (4) |
|
Includes $3.6 million of tax benefit related to settlement of certain tax matters. |
Sonic Automotive, Inc. 16
|
|
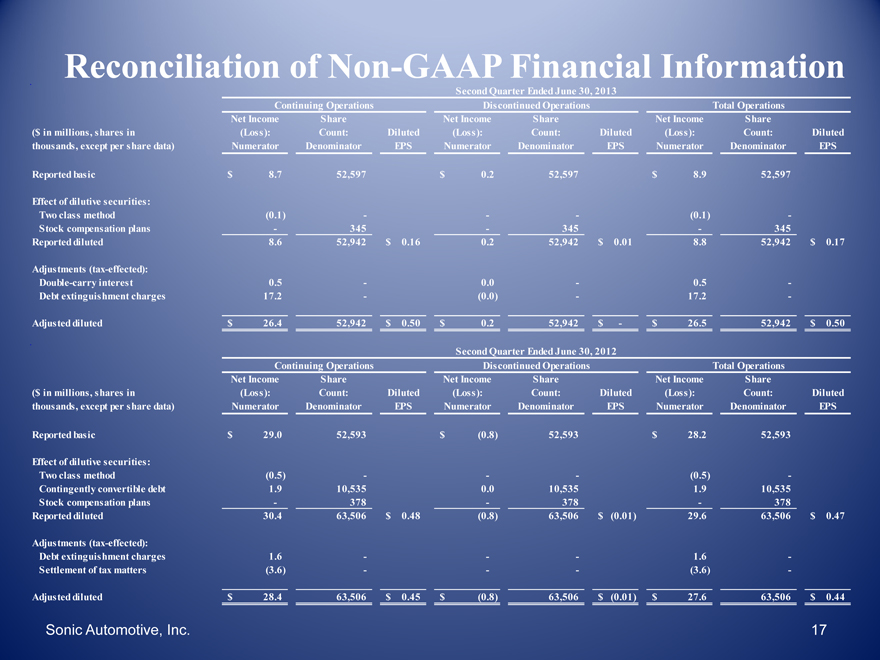
Reconciliation of Non-GAAP Financial Information
Second Quarter Ended June 30, 2013
Continuing Operations Discontinued Operations Total Operations
Net Income Share Net Income Share Net Income Share
($ in millions, shares in (Loss): Count: Diluted (Loss): Count: Diluted (Loss): Count: Diluted
thousands, except per share data) Numerator Denominator EPS Numerator Denominator EPS Numerator Denominator EPS
Reported basic $ 8.7 52,597 $ 0.2 52,597 $ 8.9 52,597
Effect of dilutive securities:
Two class method (0.1) — —— (0.1) —
Stock compensation plans — 345 — 345 — 345
Reported diluted 8.6 52,942 $ 0.16 0.2 52,942 $ 0.01 8.8 52,942 $ 0.17
Adjustments (tax-effected):
Double-carry interest 0.5 — 0.0 — 0.5 —
Debt extinguishment charges 17.2 — (0.0) — 17.2 —
Adjusted diluted $ 26.4 52,942 $ 0.50 $ 0.2 52,942 $— $ 26.5 52,942 $ 0.50
Second Quarter Ended June 30, 2012
Continuing Operations Discontinued Operations Total Operations
Net Income Share Net Income Share Net Income Share
($ in millions, shares in (Loss): Count: Diluted (Loss): Count: Diluted (Loss): Count: Diluted
thousands, except per share data) Numerator Denominator EPS Numerator Denominator EPS Numerator Denominator EPS
Reported basic $ 29.0 52,593 $ (0.8) 52,593 $ 28.2 52,593
Effect of dilutive securities:
Two class method (0.5) — —— (0.5) —
Contingently convertible debt 1.9 10,535 0.0 10,535 1.9 10,535
Stock compensation plans — 378 — 378 — 378
Reported diluted 30.4 63,506 $ 0.48 (0.8) 63,506 $ (0.01) 29.6 63,506 $ 0.47
Adjustments (tax-effected):
Debt extinguishment charges 1.6 — —— 1.6 —
Settlement of tax matters (3.6) — —— (3.6) —
Adjusted diluted $ 28.4 63,506 $ 0.45 $ (0.8) 63,506 $ (0.01) $ 27.6 63,506 $ 0.44
Sonic Automotive, Inc.
17
|
|
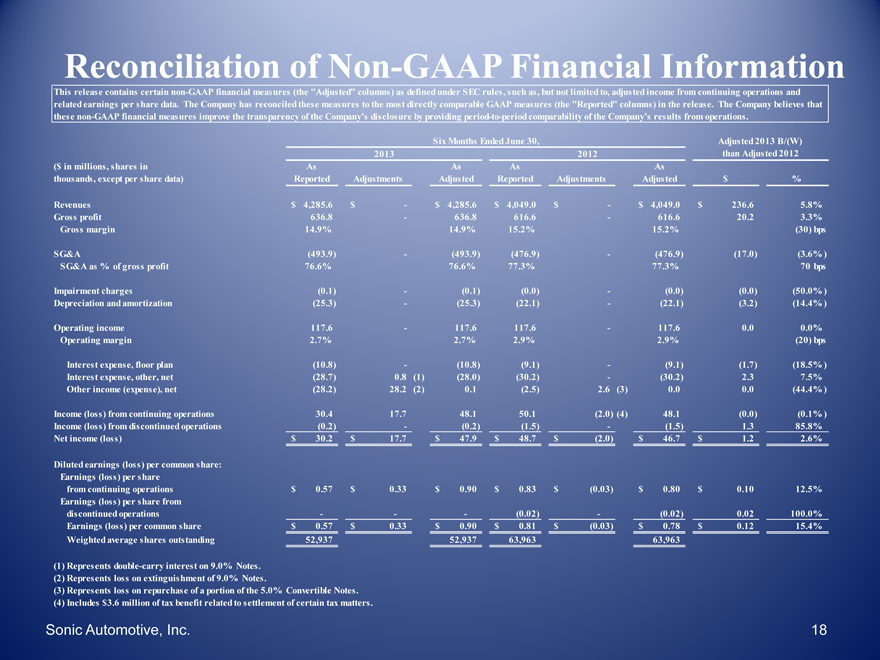
Reconciliation of Non-GAAP Financial Information
This release contains certain non-GAAP financial measures (the “Adjusted” columns) as defined under SEC rules, such as, but not limited to, adjusted income from continuing operations and
related earnings per share data. The Company has reconciled these measures to the most directly comparable GAAP measures (the “Reported” columns) in the release. The Company believes that
these non-GAAP financial measures improve the transparency of the Company’s disclosure by providing period-to-period comparability of the Company’s results from operations.
Six Months Ended June 30, Adjusted 2013 B/(W)
2013 2012 than Adjusted 2012
($ in millions, shares in As As As As
thousands, except per share data) Reported Adjustments Adjusted Reported Adjustments Adjusted $ %
Revenues $ 4,285.6 $ — $ 4,285.6 $ 4,049.0 $ — $ 4,049.0 $ 236.6 5.8%
Gross profit 636.8 — 636.8 616.6 — 616.6 20.2 3.3%
Gross margin 14.9% 14.9% 15.2% 15.2% (30) bps
SG&A (493.9) — (493.9) (476.9) — (476.9) (17.0) (3.6% )
SG&A as % of gross profit 76.6% 76.6% 77.3% 77.3% 70 bps
Impairment charges (0.1) — (0.1) (0.0) — (0.0) (0.0) (50.0% )
Depreciation and amortization (25.3) — (25.3) (22.1) — (22.1) (3.2) (14.4% )
Operating income 117.6 — 117.6 117.6 — 117.6 0.0 0.0%
Operating margin 2.7% 2.7% 2.9% 2.9% (20) bps
Interest expense, floor plan (10.8) — (10.8) (9.1) — (9.1) (1.7) (18.5% )
Interest expense, other, net (28.7) 0.8 (1) (28.0) (30.2) — (30.2) 2.3 7.5%
Other income (expense), net (28.2) 28.2 (2) 0.1 (2.5) 2.6 (3) 0.0 0.0 (44.4% )
Income (loss) from continuing operations 30.4 17.7 48.1 50.1 (2.0) (4) 48.1 (0.0) (0.1% )
Income (loss) from discontinued operations (0.2) — (0.2) (1.5) — (1.5) 1.3 85.8%
Net income (loss) $ 30.2 $ 17.7 $ 47.9 $ 48.7 $ (2.0) $ 46.7 $ 1.2 2.6%
Diluted earnings (loss) per common share:
Earnings (loss) per share
from continuing operations $ 0.57 $ 0.33 $ 0.90 $ 0.83 $ (0.03) $ 0.80 $ 0.10 12.5%
Earnings (loss) per share from
discontinued operations — — — (0.02) — (0.02) 0.02 100.0%
Earnings (loss) per common share $ 0.57 $ 0.33 $ 0.90 $ 0.81 $ (0.03) $ 0.78 $ 0.12 15.4%
Weighted average shares outstanding 52,937 52,937 63,963 63,963
-
| (2) |
|
Represents loss on extinguishment of 9.0% Notes. |
| (3) |
|
Represents loss on repurchase of a portion of the 5.0% Convertible Notes. |
| (4) |
|
Includes $3.6 million of tax benefit related to settlement of certain tax matters. |
Sonic Automotive, Inc. 18
|
|
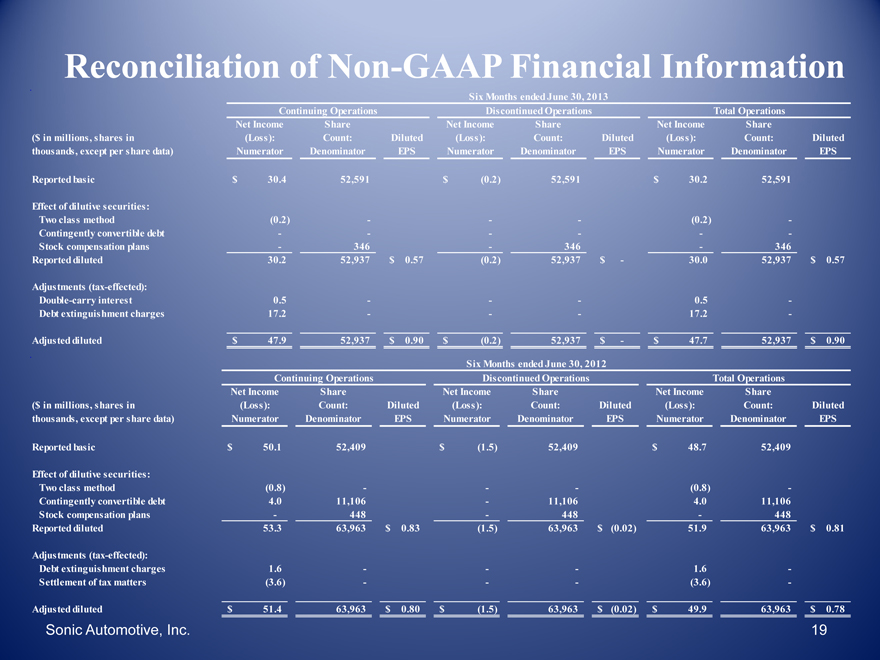
Reconciliation of Non-GAAP Financial Information
Six Months ended June 30, 2013
Continuing Operations Discontinued Operations Total Operations
Net Income Share Net Income Share Net Income Share
($ in millions, shares in (Loss): Count: Diluted (Loss): Count: Diluted (Loss): Count: Diluted
thousands, except per share data) Numerator Denominator EPS Numerator Denominator EPS Numerator Denominator EPS
Reported basic $ 30.4 52,591 $ (0.2) 52,591 $ 30.2 52,591
Effect of dilutive securities:
Two class method (0.2) — —— (0.2) —
Contingently convertible debt —— —— ——
Stock compensation plans — 346 — 346 — 346
Reported diluted 30.2 52,937 $ 0.57 (0.2) 52,937 $ — 30.0 52,937 $ 0.57
Adjustments (tax-effected):
Double-carry interest 0.5 — —— 0.5 —
Debt extinguishment charges 17.2 — —— 17.2 —
Adjusted diluted $ 47.9 52,937 $ 0.90 $ (0.2) 52,937 $ — $ 47.7 52,937 $ 0.90
Six Months ended June 30, 2012
Continuing Operations Discontinued Operations Total Operations
Net Income Share Net Income Share Net Income Share
($ in millions, shares in (Loss): Count: Diluted (Loss): Count: Diluted (Loss): Count: Diluted
thousands, except per share data) Numerator Denominator EPS Numerator Denominator EPS Numerator Denominator EPS
Reported basic $ 50.1 52,409 $ (1.5) 52,409 $ 48.7 52,409
Effect of dilutive securities:
Two class method (0.8) — —— (0.8) —
Contingently convertible debt 4.0 11,106 — 11,106 4.0 11,106
Stock compensation plans — 448 — 448 — 448
Reported diluted 53.3 63,963 $ 0.83 (1.5) 63,963 $ (0.02) 51.9 63,963 $ 0.81
Adjustments (tax-effected):
Debt extinguishment charges 1.6 — —— 1.6 —
Settlement of tax matters (3.6) — —— (3.6) —
Adjusted diluted $ 51.4 63,963 $ 0.80 $ (1.5) 63,963 $ (0.02) $ 49.9 63,963 $ 0.78
Sonic Automotive, Inc. 19
|
|
Sonic Automotive, Inc. 20