 Q2 2014
EARNINGS REVIEW July 22, 2014
Exhibit 99.2 |
| Q2 2014
EARNINGS REVIEW July 22, 2014
Exhibit 99.2 |
 2
FORWARD-LOOKING STATEMENTS
These forward-looking statements, risks, uncertainties and additional factors speak only
as of the date of this presentation. We undertake no obligation to update any
such statements. This presentation contains “forward-looking statements”
within the meaning of the Private Securities Litigation Reform Act of 1995. These
statements relate to future events, are not historical facts and are based on our
current expectations and assumptions regarding our business, the economy and other future
conditions. These statements can generally be identified by lead-in words such as
“believe”, “expect”, “anticipate”, “intend”,
“plan”, “foresee”, “may” ,”will” and other similar words. Statements that describe
our Company’s objectives, plans or goals are also forward-looking statements.
Examples of such forward- looking information we may be discussing in this
presentation include, without limitation, anticipated 2014 industry new vehicle sales
volume, the implementation of growth and operating strategies, including acquisitions
of dealerships and properties, the development of open points and stand-alone pre-owned
stores, the return of capital to shareholders , anticipated future success and impacts from
the implementation of our strategic initiatives and earnings per share expectations.
You are cautioned that these forward-looking statements are not guarantees of future
performance, involve risks and uncertainties and actual results may differ materially
from those projected in the forward-looking statements as a result of various
factors. These risks and uncertainties include, among other things, (a) economic
conditions in the markets in which we operate, (b) the success of our operational strategies, (c)
our relationships with the automobile manufacturers, (d) new and pre-owned vehicle sales
volume, and (e) earnings expectations for the year ended December 31, 2014. These risks
and uncertainties, as well as additional factors that could affect our
forward-looking statements, are described in our Form 10-K for the year ending
December 31, 2013.
|
 CONTENT
•
STRATEGIC FOCUS
•
QUARTER IN REVIEW
•
FINANCIAL RESULTS
•
OPERATIONS RECAP
•
SUMMARY AND OUTLOOK
3 |
 STRATEGIC
FOCUS 1.
Growth
•
Grow The Base Business
One Sonic-One Experience
•
Acquisitions & Open Points
•
Pre-Owned Specialty Stores
2.
Own Our Properties
3.
Return Capital to Shareholders
4 |
 STRATEGIC
FOCUS ONE SONIC-ONE EXPERIENCE
5
•
Goals
•
1 Associate, 1 Price, 1 Hour
•
Improve Transparency; Increase Trust
•
Operational Efficiencies
•
Pilot Store Underway
•
18 Month Implementation
Result -
Increase Market Share and Customer Retention |
 6
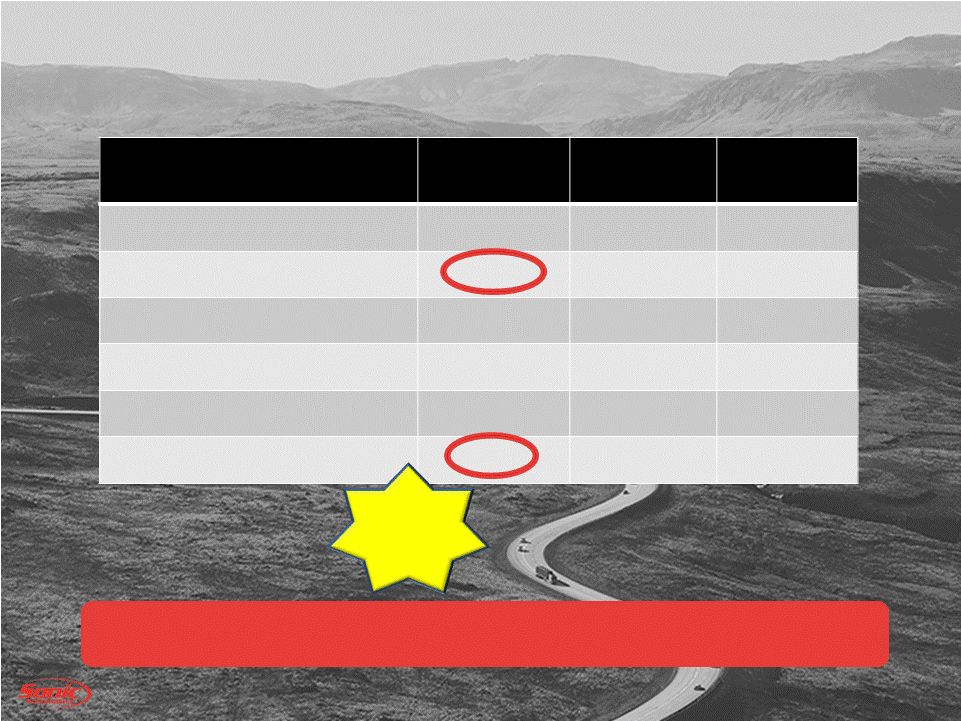
STRATEGIC FOCUS
PRE-OWNED
Break Ground
Hiring & Training
Merchandising & Advertising
Opening
Q1
Q2
Q3
Q4 |
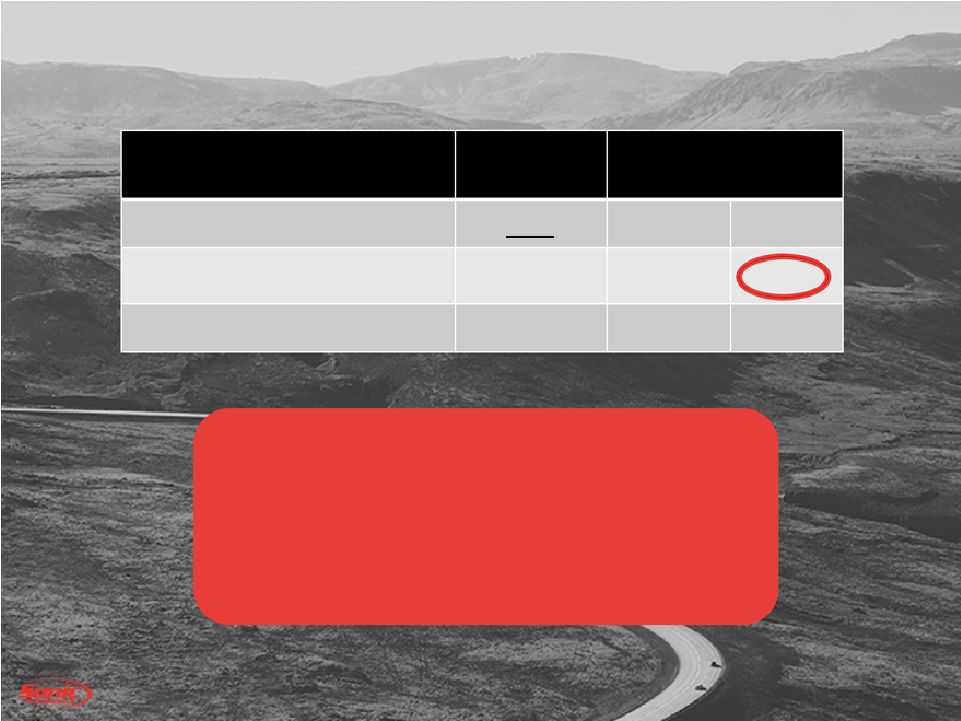
 7
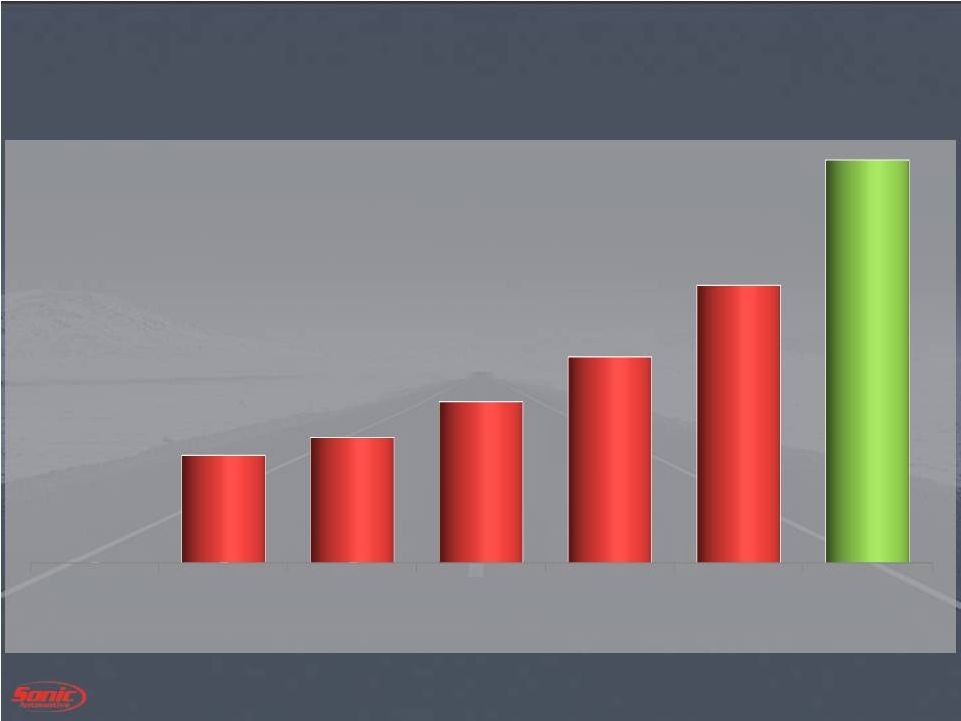
STRATEGIC FOCUS
OWN OUR PROPERTIES
2007
2008
2010
2011
2012
2013
Proj. -
2017
0%
12%
14%
18%
23%
31%
45% |
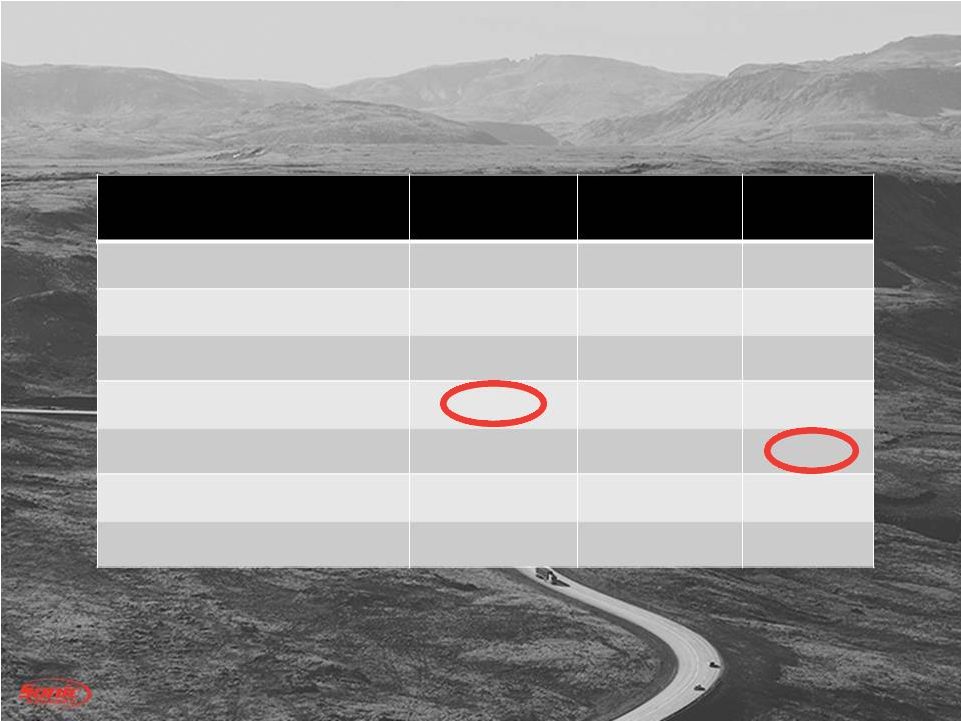
 8
STRATEGIC FOCUS
RETURN CAPITAL TO SHAREHOLDERS
•
Unused authorization of approximately $ 121.4 million
•
Quarterly dividend of $0.025 per share
Shares
(in thousands)
Average Price /
Share
$
(in millions)
2014 Activity
498
$ 22.39
$ 11.2 |
 Q2 2014
FINANCIAL REVIEW |
 Q2 2014
ADJUSTED RESULTS B/(W) than Q2 2013
(amounts in millions, except per share data)
Q2 2014
$
%
Revenue
$ 2,353
$ 151
7%
Gross Profit
$ 347
$ 23
7%
Operating Profit
(1)
$ 58
($ 5)
(8%)
Interest & Other
(1)
($ 19)
$ 1
3%
Continuing Ops:
Profit (after tax)
(1)
$ 23
($ 3)
(11%)
Diluted EPS
(1)
$ 0.44
($ 0.06)
(12%)
SG&A as % of Gross
(1)
79.2%
(260 bps)
Discontinued Ops Profit/(Loss) (after tax)
($0)
($0)
10
(1) See Appendix for reconciliation to reported GAAP amounts. |
 EPS
ADJUSTMENTS 11
(1) See Appendix for reconciliation to reported GAAP amounts.
(amounts in millions, except per share date)
Q2 2014
Q2 2013
Pre-Tax
EPS
Pre-Tax
EPS
Unadjusted EPS
$ 0.51
$ 0.16
Hail and Legal
$ 1.4
$
0.01
$ 0.0
$ 0.00
Gain on Disposal
($7.3)
($ 0.08)
$ 0.0
$ 0.00
Loss on Debt
$ 0.0
$ 0.00
$ 29.0
$ 0.34
Adjusted
EPS
(1)
$ 0.44
$ 0.50 |
 STRATEGIC INITIATIVE IMPACT ON
EPS
12
(amounts in millions, except per share date)
Q2 2014
Pre-Tax
EPS
Adjusted
(1)
$ 0.44
Pre-Owned Initiative
$ 3.2
$ 0.04
One Sonic-One Experience
$ 1.8
$ 0.02
Centralization of Business Office
$ 0.3
$ 0.00
Excluding Effect of Strategic Initiatives
$ 0.50
(1) See Appendix for reconciliation to reported GAAP amounts. |
 TOTAL
GROSS 13
$ 347 M
$ 324 M
Q2 2014
Q2 2013
$74
$68
$36
$36
$77
$69
$160
$151
New
Used
F&I
Fixed |
 SG&A
TO GROSS 14
76.6%
79.2%
(1) See Appendix for reconciliation to reported GAAP amounts.
(1)
Q2 2014 Adjusted
Q2 2013
Advertising
Comp
Rent
Other
4.0%
4.2%
47.0%
46.2%
5.4%
5.7%
22.8%
20.5% |
 STRATEGIC INITIATIVE IMPACT ON
SG&A
15
(amounts in millions, except per share date)
Q2 2014
Pre-Tax
SG&A %
Adjusted
(1)
79.2%
Pre-Owned Initiative
$ 3.2
0.90%
One Sonic One Experience
$ 1.8
0.50%
Centralization of Business Office
$ 0.3
0.10%
Excluding Effect of Strategic Initiatives
77.7%
(1) See Appendix for reconciliation to reported GAAP amounts. |
 STRATEGIC INITIATIVE SPEND
16
(in millions)
Actual YTD Q2
2014
Estimated FY
2014
Pre-Owned Initiative
$ 5.0
$ 12.0
One Sonic-One Experience
$ 3.6
$ 7.0
Centralization of Business Office
$ 0.6
$ 3.0 |
 CAPITAL
SPEND (amounts in millions)
YTD Q2 2014
ESTIMATED
2014
Real Estate Acquisitions
$ 9.7
$ 31.2
All Other Cap Ex
38.9
144.2
Subtotal
$ 48.6
$ 175.4
Less: Mortgage Funding
(40.4)
(40.4)
Total Cash Used –
Cap Ex
$ 8.2
$ 135.0
Note –
Spending excludes the effect of franchise acquisitions.
17 |
 LIQUIDITY
(amounts in millions)
Q2 2014
Q4 2013
Cash
$ 3.0
$3.0
Revolver Availability
117.3
126.0
Used floor plan availability
60.6
27.1
Floor plan deposit balance
95.0
65.0
Total
$ 275.9
$221.1
18 |
 DEBT
COVENANTS Covenant
Actual Q2
2014
Liquidity Ratio
>= 1.05
1.21
Fixed Charge Coverage Ratio
>= 1.20
1.82
Total Lease Adjusted Leverage
Ratio
<= 5.50
4.14
Compliant with all Covenants
19 |
 OPERATIONS
REVIEW |
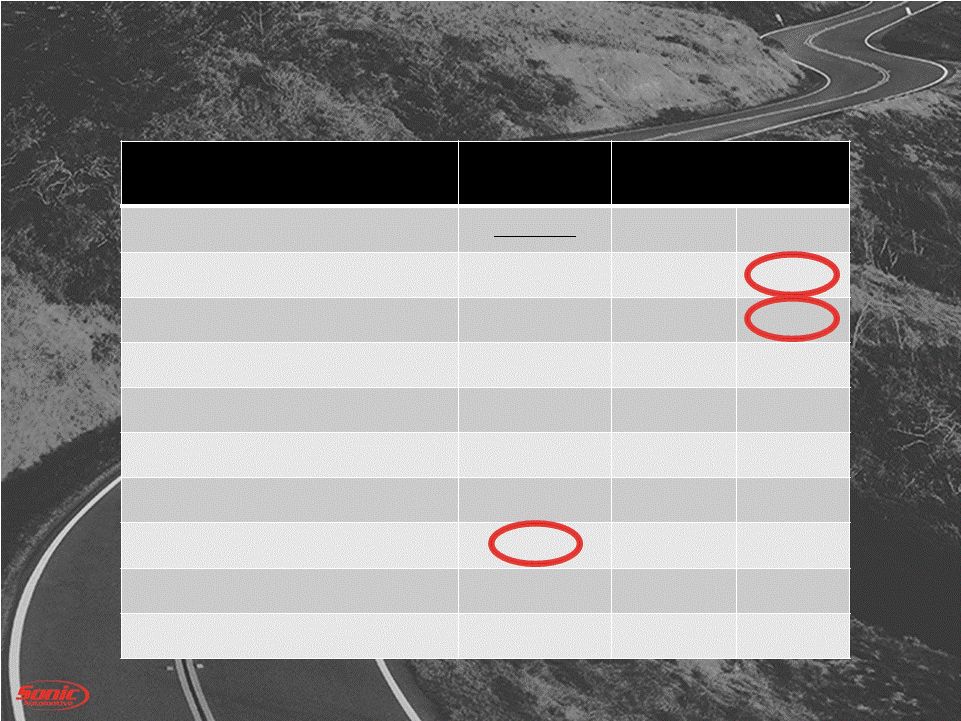
 NEW
VEHICLE RETAIL Q2 2014
Q2 2013
B/(W)
Revenue
$ 1,283 million
$ 1,200 million
7.0%
Volume
34,847
33,685
3.4%
Selling Price
$ 36,825
$ 35,616
3.4%
Gross Margin %
5.8%
5.5%
30 bps
GPU
$ 2,119
$ 1,976
$ 143
Gross Profit
$ 74 million
$ 67 million
10.9%
SAAR (includes fleet)
16.5 million
15.3 million
7.8%
21 |
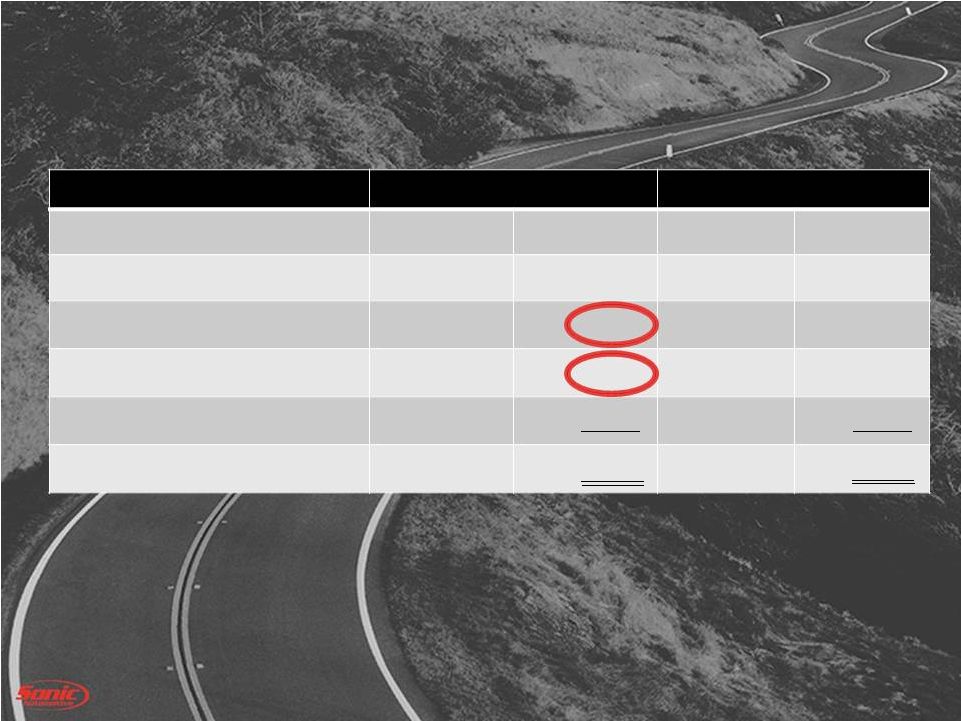
 USED
VEHICLE RETAIL Q2 2014
Q2 2013
B/(W)
Revenue
$ 604 million
$ 539 million
12.0%
Retail Volume
28,514
26,599
7.2%
Used Retail GPU
$ 1,314
$ 1,414
($ 100)
Used Related Retail Gross*
$ 106 million
$ 97 million
$ 9 million
Used to New
0.82 : 1
0.79 : 1
0.03
Vehicles / store / month
93
89
4
* -
Includes front-end gross plus F&I related gross and fixed
operations related gross
22
100
vehicles /
store /
month in
May |
 FIXED
OPS 23
Q2 2014
B/(W) than Q2 2013
(amounts in millions)
2014
$
%
Revenue
$ 329
$ 22
7.2%
Gross Profit
$ 160
$ 9
5.8%
QTD YOY Gross Profit Change Breakdown:
•
Customer Pay Up 5.9%
•
Whsl. Parts Up 8.5%
•
Internal & Sublet Up 8.1%
•
Warranty Down 2.7% |
 SUMMARY |
 Business environment continues to be favorable to
retail automotive
Posted all-time record pre-owned sales volumes
producing record Q2 pre-owned gross profits
Fixed operations continues to benefit from 0-5 year
units in operation increasing
Expect market share gains and customer retention from
One Sonic-One Experience once the entire
complement of the shopping experience is in place
On
track
to
open
our
Denver
market
pre-owned
operations in Q4
Re-affirm 2014 continued ops EPS guidance of $1.95
to $2.05 net of pre-owned specialty retail operations
EPS of ($0.14).
SUMMARY
25 |
 |
 Appendix
27 |
 NON-GAAP RECONCILIATIONS
28
This release contains certain non-GAAP financial measures (the
"Adjusted" columns) as defined under SEC rules, such as, but not limited to, adjusted income from continuing operations and related
earnings per share data. The Company has reconciled these measures
to the most directly comparable GAAP measures (the "Reported" columns) in the release. The Company believes that these non-
GAAP financial measures improve the transparency of the Company’s
disclosure by providing period-to-period comparability of the Company’s results from operations.
Second Quarter Ended June 30,
Adjusted 2014 B/(W)
2014
2013
than Adjusted 2013
($ in millions, shares in
thousands, except per share data)
Reported
Adjustments
Adjusted
Reported
Adjustments
Adjusted
$
%
Revenues
2,353.3
$
-
$
2,353.3
$
2,202.4
$
-
$
2,202.4
$
150.8
$
6.8%
Gross profit
346.9
-
346.9
323.8
-
323.8
23.1
7.1%
Gross margin
14.7%
14.7%
14.7%
14.7%
0 bps
SG&A
(268.9)
(5.9)
(1)
(274.8)
(248.1)
-
(248.1)
(26.7)
(10.8%)
SG&A as % of gross profit
77.5%
79.2%
76.6%
76.6%
(260) bps
Impairment charges
(0.0)
-
(0.0)
(0.0)
-
(0.0)
0.0
88.9%
Depreciation and amortization
(14.4)
-
(14.4)
(13.1)
-
(13.1)
(1.3)
(9.8%)
Operating income
63.6
(5.9)
57.7
62.5
-
62.5
(4.8)
(7.8%)
Operating margin
2.7%
2.5%
2.8%
2.8%
(30) bps
Interest expense, floor plan
(4.9)
-
(4.9)
(5.6)
-
(5.6)
0.7
13.1%
Interest expense, other, net
(13.9)
-
(13.9)
(14.4)
0.8
(2)
(13.6)
(0.3)
(1.9%)
Other income (expense), net
-
-
-
(28.3)
28.2
(3)
(0.0)
0.0
(100.0%)
Income (loss) from continuing operations
27.1
(3.6)
23.5
8.7
17.7
26.4
(3.0)
(11.2%)
Income (loss) from discontinued operations
(0.1)
-
(0.1)
0.2
-
0.2
(0.3)
(133.7%)
Net income (loss)
27.0
$
(3.6)
$
23.4
$
8.9
$
17.7
$
26.6
$
(3.2)
$
(12.1%)
Diluted earnings (loss) per common share:
Earnings (loss) per share
from continuing operations
0.51
$
(0.07)
$
0.44
$
0.16
$
0.34
$
0.50
$
(0.06)
$
(12.0%)
Earnings (loss) per share from
discontinued operations
-
-
-
0.01
(0.01)
-
-
-
Earnings (loss) per common share
0.51
$
(0.07)
$
0.44
$
0.17
$
0.33
$
0.50
$
(0.06)
$
(12.0%)
Weighted average shares outstanding
52,930
52,930
52,942
52,942
(1) Represents gain on sale of franchises, offset partially by hail
damage and legal settlement charges. (2) Represents
double-carry interest on 9.0% Notes. (3) Represents loss on
extinguishment of 9.0% Notes. |
 NON-GAAP RECONCILIATIONS
29
Second Quarter Ended June 30, 2014
Continuing Operations
Discontinued Operations
Total Operations
($ in millions, shares in
thousands, except per share data)
Net Income
(Loss):
Numerator
Share
Count:
Denominator
Diluted
EPS
Net Income
(Loss):
Numerator
Share
Count:
Denominator
Diluted
EPS
Net Income
(Loss):
Numerator
Share
Count:
Denominator
Diluted
EPS
Reported basic
27.1
$
52,514
(0.1)
$
52,514
27.0
$
52,514
Effect of dilutive securities:
Two class method
(0.1)
-
-
-
(0.1)
-
Stock compensation plans
-
416
-
416
-
416
Reported
diluted 27.0
52,930
0.51
$
(0.1)
52,930
-
$
26.9
52,930
0.51
$
Adjustments (tax-effected):
Hail and legal
0.8
-
-
-
0.8
-
Gain on disposal of franchises
(4.4)
-
-
-
(4.4)
-
Adjusted diluted
23.4
$
52,930
0.44
$
(0.1)
$
52,930
-
$
23.3
$
52,930
0.44
$
Second Quarter Ended June 30, 2013
Continuing Operations
Discontinued Operations
Total Operations
($ in millions, shares in
thousands, except per share data)
Net Income
(Loss):
Numerator
Share
Count:
Denominator
Diluted
EPS
Net Income
(Loss):
Numerator
Share
Count:
Denominator
Diluted
EPS
Net Income
(Loss):
Numerator
Share
Count:
Denominator
Diluted
EPS
Reported basic
8.7
$
52,597
0.2
$
52,597
8.9
$
52,597
Effect of dilutive securities:
Two class method
(0.1)
-
-
-
(0.1)
-
Stock compensation plans
-
345
-
345
-
345
Reported
diluted 8.7
52,942
0.16
$
0.2
52,942
0.01
$
8.9
52,942
0.17
$
Adjustments (tax-effected):
Debt extinguishment charges
17.7
-
-
-
17.7
-
Subtotal
26.4
52,942
0.50
$
0.2
52,942
-
$
26.6
52,942
0.50
$
Effect of dilutive securities:
Two class method
(0.1)
-
-
-
(0.1)
-
Adjusted diluted
26.2
$
52,942
0.50
$
0.2
$
52,942
-
$
26.4
$
52,942
0.50
$ |
 |