 Q3 2014
EARNINGS REVIEW October 21, 2014
Exhibit 99.2 |
| Q3 2014
EARNINGS REVIEW October 21, 2014
Exhibit 99.2 |
 2
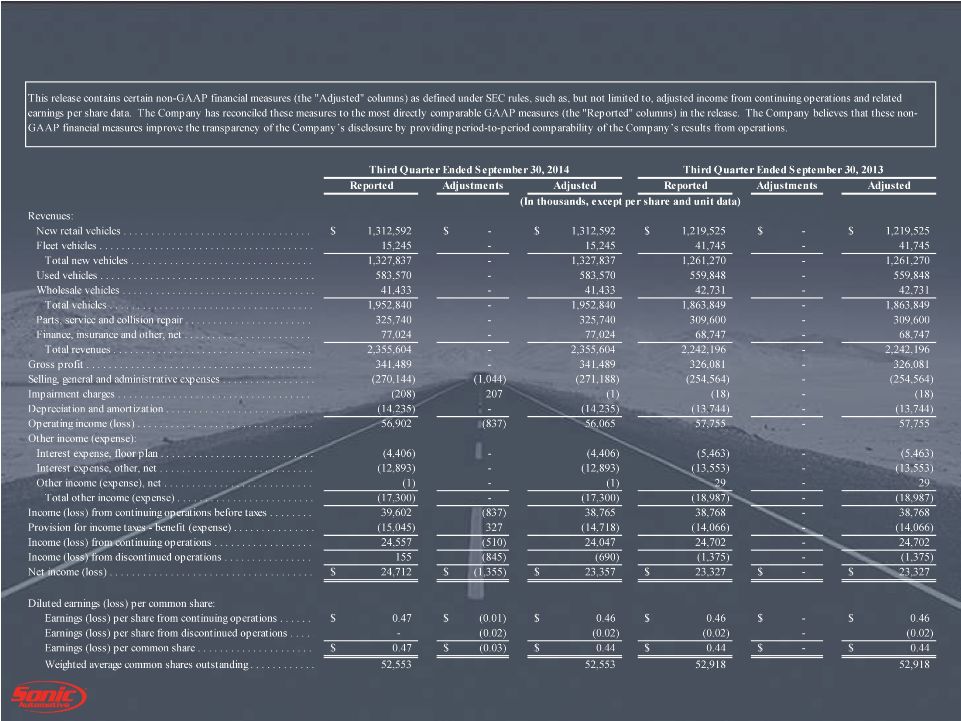
FORWARD-LOOKING STATEMENTS
This presentation contains “forward-looking statements” within the meaning of
the Private Securities Litigation Reform Act of 1995. These statements relate to
future events, are not historical facts and are based on our current expectations and
assumptions regarding our business, the economy and other future conditions.
These statements can generally be identified by lead-in words such as “believe”,
“expect”, “anticipate”, “intend”, “plan”,
“foresee”, “may” ,”will” and other similar words. Statements that
describe our Company’s objectives, plans or goals are also forward-looking
statements. Examples of such forward-looking information we may be
discussing in this presentation include, without limitation, anticipated 2014 industry
new vehicle sales volume, the implementation of growth and operating strategies,
including acquisitions of dealerships and properties, the development of open points and
stand-alone pre-owned stores, the return of capital to shareholders , anticipated
future success and impacts from the implementation of our strategic initiatives and
earnings per share expectations.
You are cautioned that these forward-looking statements are not guarantees of future
performance, involve risks and uncertainties and actual results may differ materially
from those projected in the forward-looking statements as a result of various
factors. These risks and uncertainties include, among other things, (a) economic
conditions in the markets in which we operate, (b) the success of our operational
strategies, (c) our relationships with the automobile manufacturers, (d) new and pre-owned
vehicle sales volume, and (e) earnings expectations for the year ended December 31, 2014.
These risks and uncertainties, as well as additional factors that could affect our
forward-looking statements, are described in our Form 10-K for the year ending
December 31, 2013. These forward-looking statements, risks, uncertainties and additional factors speak only
as of the date of this presentation. We undertake no obligation to update any
such statements. |
 CONTENT
•
STRATEGIC FOCUS
•
QUARTER IN REVIEW
•
FINANCIAL RESULTS
•
OPERATIONS RECAP
•
SUMMARY AND OUTLOOK
3 |
 4
STRATEGIC FOCUS
1.
Growth
•
Grow The Base Business
•
One Sonic-One Experience
•
EchoPark
®
•
Acquisitions & Open Points
2.
Own Our Properties
3.
Return Capital to Shareholders |
 STRATEGIC
FOCUS ONE SONIC-ONE EXPERIENCE
5
•
Goals
–
1 Associate, 1 Price, 1 Hour
–
Improve Transparency; Increase Trust
–
Operational Efficiencies
•
Pilot Store Underway
•
24 Month Implementation
Result -
Increase Market Share and Customer Retention |
 6
STRATEGIC FOCUS
ONE SONIC-ONE EXPERIENCE
•
Speed Up the Transaction
–
No Negotiation
•
Reduce Paperwork
–
Electronic Signature
•
One Associate One Guest
–
Technology Driven
–
Training Supported
•
Reduce Headcount Through
Attrition
–
Creates Significant Cost
Savings
•
Create Trust & Transparency
–
Increased CSI, ASI and
Market Share
•
Brand the Retail Stores
–
Increased Market Share &
Margins
•
Creates More of a Specialty
Retail Experience
–
Apple, Starbucks, etc. |
 7
STRATEGIC FOCUS
EchoPark
®
Hub Opens November 3
2 Neighborhood Stores
Open Late Nov & Dec |
 8
STRATEGIC FOCUS
ACQUISITIONS & OPEN POINTS
•
Purchased Two Franchises, Jaguar (Q1) &
Nissan (Q3) during 2014
Estimated Annual Revenues of $55 million
•
Open Points
Nissan in TN Market
Exploring Opportunities in Other Markets |
 9
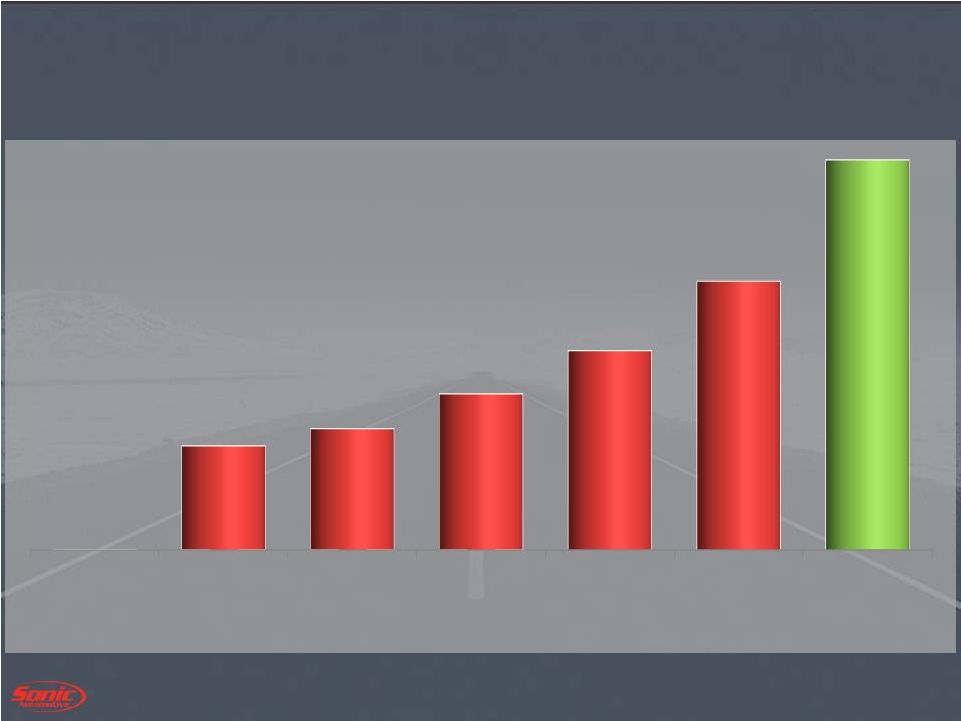
STRATEGIC FOCUS
OWN OUR PROPERTIES
2007
2008
2010
2011
2012
2013
Proj. -
2017
0%
12%
14%
18%
23%
31%
45% |
 10
STRATEGIC FOCUS
RETURN CAPITAL TO SHAREHOLDERS
•
Unused Authorization of Approximately $ 93 million
•
Quarterly Dividend of $0.025 Per Share
Shares
(in thousands)
Average Price /
Share
$
(in millions)
2014 Activity
1,668
$ 23.70
$ 39.5 |
 Q3
2014 FINANCIAL REVIEW |
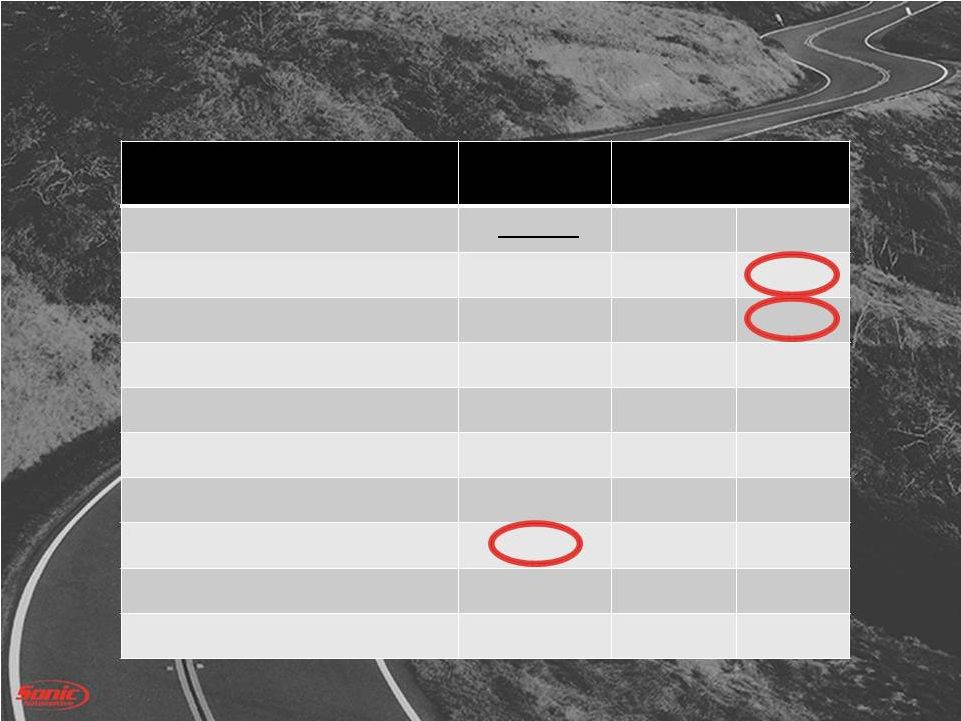 Q3 2014
ADJUSTED RESULTS 12
(1) See Appendix for reconciliation to reported GAAP amounts.
B/(W) than Q3 2013
(amounts in millions, except per share data)
Q3 2014
$
%
Revenue
$ 2,356
$ 113
5%
Gross Profit
$ 341
$ 15
5%
Operating Profit
$ 56
($ 2)
(3%)
Interest & Other
($ 17)
$ 2
9%
Continuing Ops:
Profit (after tax)
$ 24
($ 1)
(3%)
Diluted EPS
$ 0.46
$ 0.00
0%
SG&A as % of Gross
79.4%
(130 bps)
Discontinued Ops Profit/(Loss) (after tax)
($1)
$1
(1)
(1)
(1)
(1)
(1)
(1) |
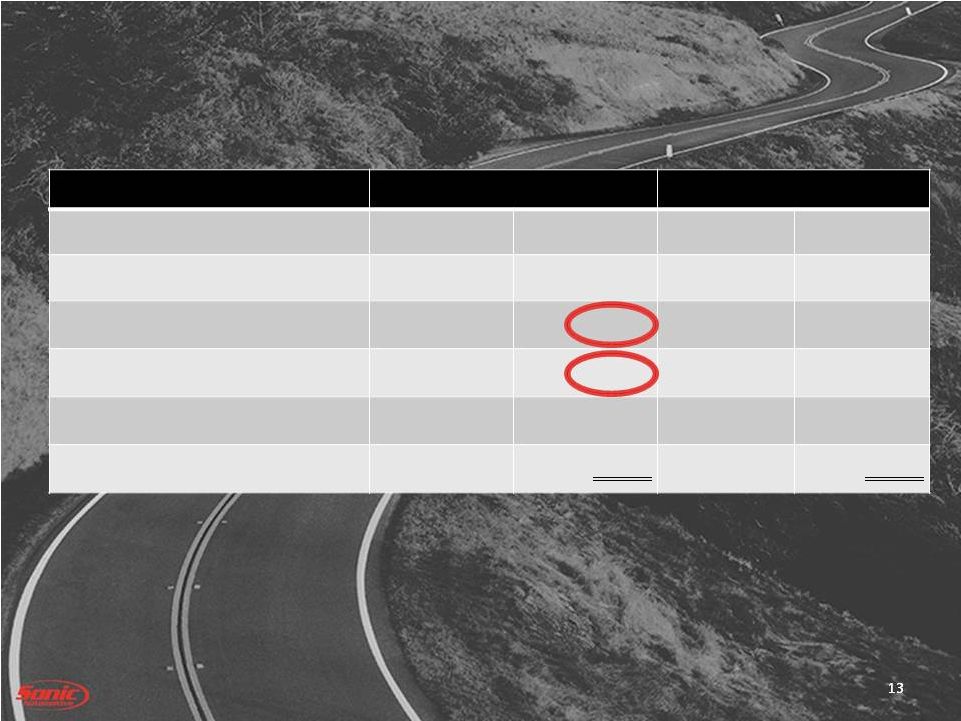 EPS
ADJUSTMENTS 13
(1) See Appendix for reconciliation to reported GAAP amounts.
(amounts in millions, except per share date)
Q3 2014
Q3 2013
Pre
Tax
EPS
Pre
Tax
EPS
Unadjusted EPS
$ 0.47
$ 0.46
Storm
Damage
$ 2.2
$
0.03
$ 0.0
$ 0.00
Gain on Disposal
($3.2)
($
0.04)
$ 0.0
$ 0.00
Impairment
$0.2
$
0.00
$ 0.0
$ 0.00
Adjusted
EPS
(1)
$ 0.46
$
0.46
-
- |
 STRATEGIC INITIATIVE IMPACT ON
EPS
14
(amounts in millions, except per share date)
Q3 2014
Pre-Tax
EPS
Adjusted
(1)
$ 0.46
EchoPark®
$ 3.6
$ 0.05
One Sonic-One Experience
$ 3.1
$ 0.04
Centralization of Business Office
$ 0.7
$ 0.01
Excluding Effect of Strategic Initiatives
$ 0.56
(1) See Appendix for reconciliation to reported GAAP amounts. |
 TOTAL
GROSS 15
$ 341 M
$ 326 M
$69
$72
$40
$36
$155
$149
$77
$69
New
Used
F&I
Fixed
Q3 2014
Q3 2013 |
 SG&A
TO GROSS 16
78.1%
79.4%
(1) See Appendix for reconciliation to reported GAAP amounts.
4.1%
4.3%
47.8%
46.5%
5.3%
5.8%
22.2%
21.5%
Advertising
Comp
Rent
Other
Q3
2014
Adjusted
(1)
Q3 2013 |
 STRATEGIC INITIATIVE IMPACT ON
SG&A
17
(amounts in millions, except per share date)
Q3 2014
Pre-Tax
SG&A %
Adjusted
(1)
79.4%
EchoPark®
$ 3.6
1.1%
One Sonic-One Experience
$ 3.1
0.9%
Centralization of Business Office
$ 0.7
0.2%
Excluding Effect of Strategic Initiatives
77.2%
(1) See Appendix for reconciliation to reported GAAP amounts. |
 STRATEGIC INITIATIVE SPEND
18
(in millions)
Actual YTD Q3
2014
Estimated FY
2014
EchoPark®
$ 8.6
$ 12.0
One Sonic-One Experience
$ 6.6
$ 10.0
Centralization of Business Office
$ 1.0
$ 3.0 |
 CAPITAL
SPEND (amounts in millions)
YTD Q3 2014
ESTIMATED
2014
Real Estate Acquisitions
$ 12.3
$ 39.6
All Other Cap Ex
77.7
143.4
Subtotal
$ 90.0
$ 183.0
Less: Mortgage Funding
(40.4)
(40.4)
Total Cash Used –
Cap Ex
$ 49.6
$ 142.6
Note –
Spending excludes the effect of franchise acquisitions.
19 |
 LIQUIDITY
20
(amounts in millions)
Q3 2014
Q4 2013
Cash
$ 1.7
$3.0
Revolver Availability
105.2
126.0
Used floor plan availability
46.6
27.1
Floor plan deposit balance
107.5
65.0
Total
$ 261.0
$221.1 |
 DEBT
COVENANTS Covenant
Actual Q3
2014
Liquidity Ratio
>= 1.05
1.22
Fixed Charge Coverage Ratio
>= 1.20
1.74
Total Lease Adjusted Leverage
Ratio
<= 5.50
4.14
21
Compliant with all Covenants |
 OPERATIONS
REVIEW |
 NEW
VEHICLE RETAIL Same Store
Q3 2014
Q3 2013
B/(W)
Revenue
$ 1,295 million
$ 1,193 million
8.5%
Volume
35,970
33,541
7.2%
Selling Price
$ 35,999
$ 35,579
1.2%
Gross Margin %
5.2%
5.8%
(60 bps)
GPU
$ 1,881
$ 2,074
($ 193)
Gross Profit
$ 68 million
$ 70 million
(2.7%)
SAAR (includes fleet)
16.7 million
15.6 million
7.1%
23 |
 USED
VEHICLE RETAIL Same Store
Q3 2014
Q3 2013
B/(W)
Revenue
$ 569 million
$ 544 million
4.6%
Retail Volume
27,000
26,953
0.2%
Used Retail GPU
$ 1,504
$ 1,413
$ 92
Used Related Retail Gross*
$ 86 million
$ 80 million
$ 6 million
Used to New
0.75 : 1
0.80 : 1
(0.05)
Vehicles / store / month
90
90
0
24
* -
Includes Front-End Gross Plus F&I Related Gross and Fixed
Operations Related Gross |
 FIXED
OPS SAME STORE
Q3 2014
B/(W) than Q3 2013
(amounts in millions)
2014
$
%
Revenue
$ 318
$ 16
5.3%
Gross Profit
$ 152
$ 6
4.4%
25
QTD YOY Gross Profit Change Breakdown:
•
Customer Pay Up 3.1%
•
Whsl. Parts Up 1.8%
•
Internal & Sublet Up 5.3%
•
Warranty Up 8.9% |
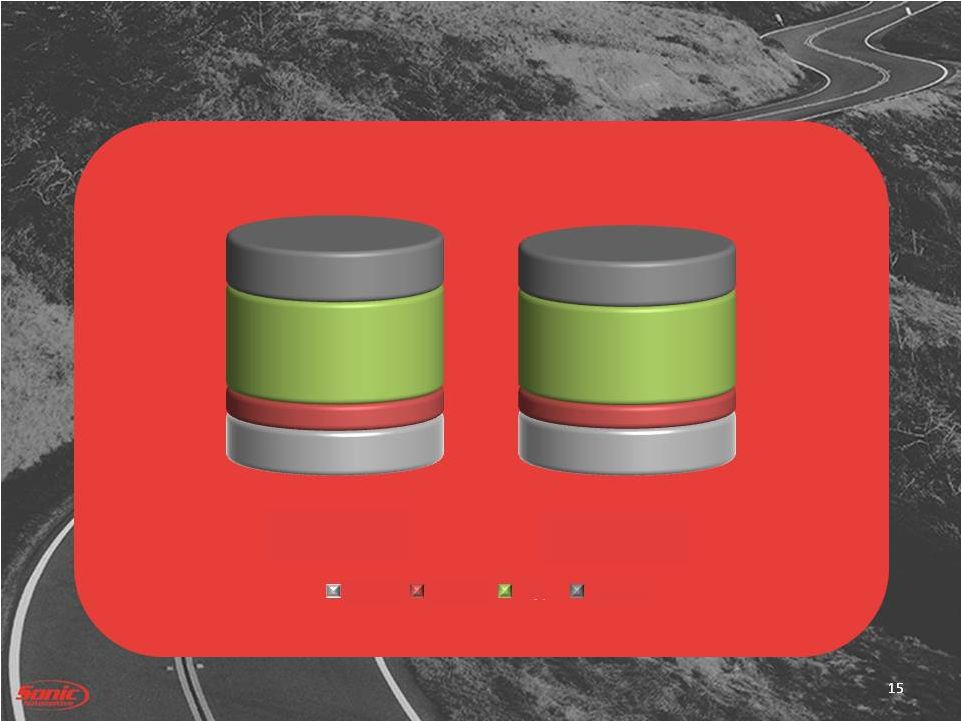
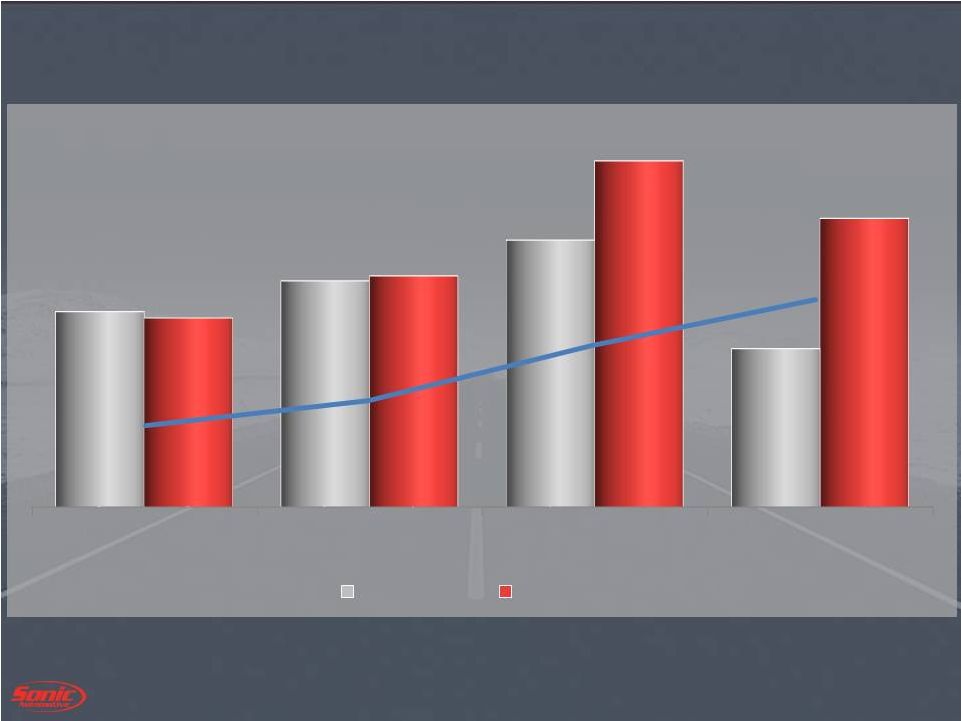 26
STRATEGIC FOCUS
ONE SONIC-ONE EXPERIENCE
Units and 2014 Market Share %
13.1%
14.6%
18.0%
20.8%
June
July
August
September
153
177
209
124
148
181
271
226
2013 Units
2014 Units |
 SUMMARY |
 Posted All-Time Record Quarterly New Retail Unit
Sales and Q3 Total Gross Profit
One Sonic-One Experience Meets Initial Expectations –
Will Begin Roll-Out to Charlotte Market
Echopark
®
Opens in Q4
Anticipate Significant Cap Exp Spending in Q4 Related
to Property Acquisitions and Construction
Share Repurchase Activity to Continue Based on
Market Conditions
SUMMARY
28 |
 |
 Appendix
30 |
 NON-GAAP RECONCILIATIONS
31 |
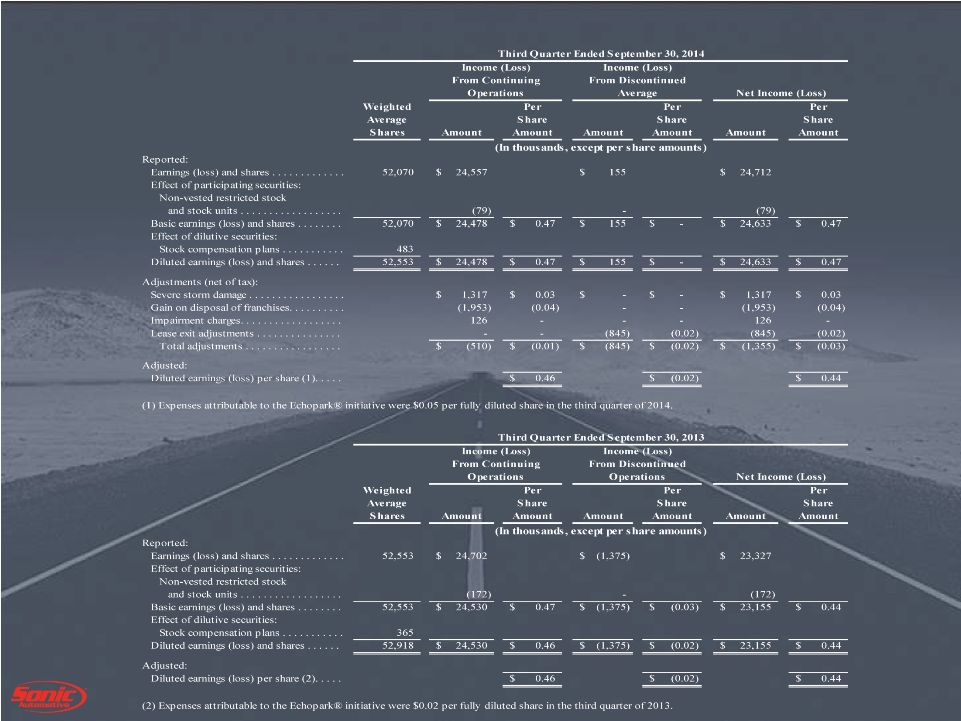 NON-GAAP RECONCILIATIONS
32 |
 |