 Q2 2015 EARNINGS REVIEW July 20, 2015 Exhibit 99.2 |
| Q2 2015 EARNINGS REVIEW July 20, 2015 Exhibit 99.2 |
 2 FORWARD-LOOKING STATEMENTS This presentation contains “forward-looking statements” within the meaning of the Private Securities
Litigation Reform Act of 1995. These statements relate to future events,
are not historical facts and are based on our current
expectations and assumptions regarding our business, the economy and other future conditions. These statements can generally be identified by lead-in words such as “believe”, “expect”,
“anticipate”, “intend”, “plan”,
“foresee”, “may” ,”will” and other similar words. Statements that describe our Company’s objectives, plans or goals are also forward-looking statements. Examples of such forward-looking
information we may be discussing in this presentation include,
without limitation, anticipated 2015 industry new vehicle sales
volume, the implementation of growth and operating strategies, including acquisitions of dealerships and properties, the development of open points and stand-alone pre-owned stores, the return of
capital to shareholders , anticipated future success and impacts from the
implementation of our strategic initiatives and earnings per
share expectations. You are cautioned that these
forward-looking statements are not guarantees of future performance, involve risks and uncertainties and actual results may differ materially from those projected in the forward-looking
statements as a result of various factors. These risks and uncertainties
include, among other things, (a) economic conditions in the
markets in which we operate, (b) the success of our operational strategies, (c) our relationships with the automobile manufacturers, (d) new and pre-owned vehicle sales volume, and (e)
earnings expectations for the year ending December 31, 2015. These risks and
uncertainties, as well as additional factors that could affect
our forward-looking statements, are described in our Form 10-K for the year ended December 31, 2014. These forward-looking statements, risks, uncertainties and additional factors speak only as of the date of this
presentation. We undertake no obligation to update any such
statements. |
 CONTENT • STRATEGIC FOCUS • FINANCIAL RESULTS • OPERATIONS REVIEW • SUMMARY AND OUTLOOK 3 |
 4 STRATEGIC FOCUS 1. Growth • One Sonic-One Experience • EchoPark ® • Acquisitions & Open Points 2. Own Our Properties 3. Return Capital to Shareholders |
 5 STRATEGIC FOCUS EchoPark ® • Denver Market with three stores open and two additional planned openings in next 12 months • Currently acquiring property in another market which may include up to 10 stores |
 6 STRATEGIC FOCUS ACQUISITIONS & OPEN POINTS • Open Points Mercedes Benz in Dallas Market Operational in 2016 Audi in Pensacola Market Operational in 2016 Nissan in TN Market Operational in late 2016 / early 2017 • Exploring Acquisition and Open Point Opportunities in Other Markets |
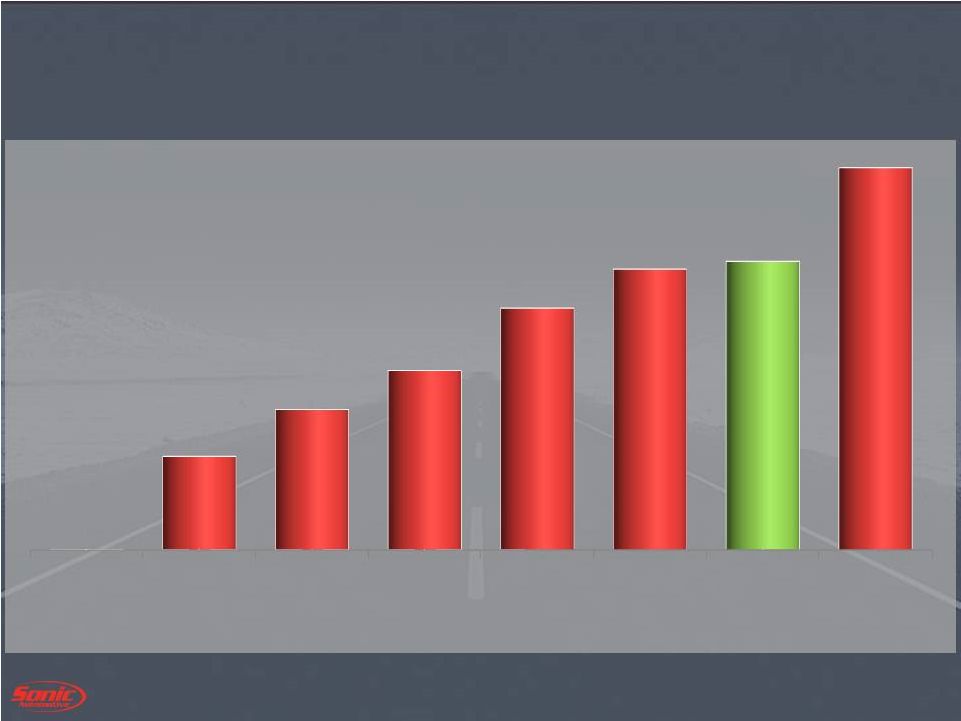 7 STRATEGIC FOCUS OWN OUR PROPERTIES 2007 2008 2011 2012 2013 2014 Q2 2015 Proj. 2017 0% 12% 18% 23% 31% 36% 37% 49% - |
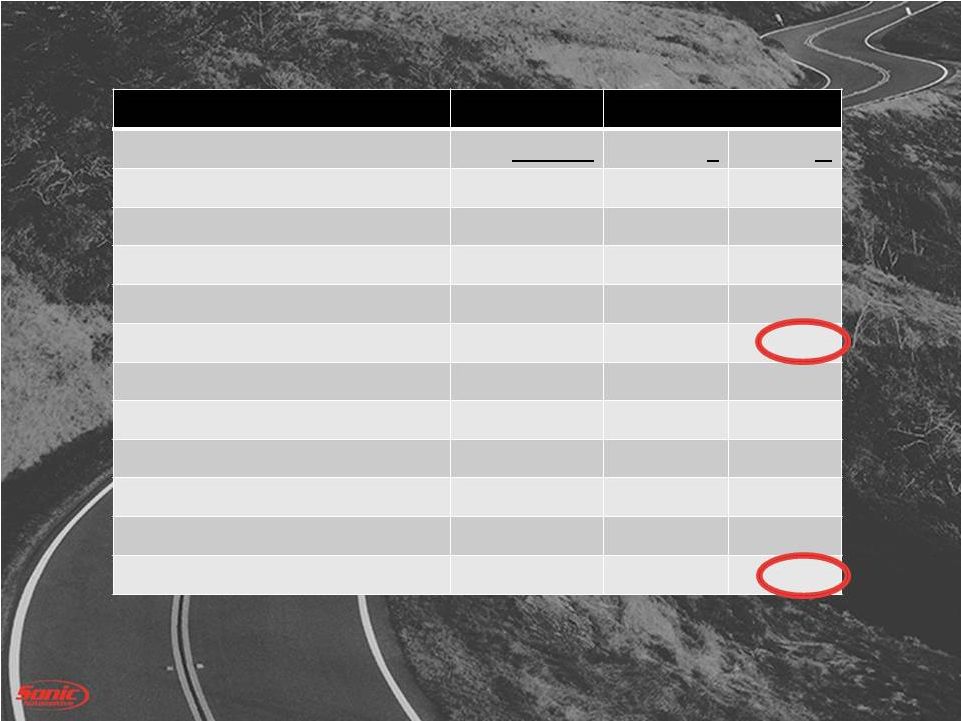
 8 STRATEGIC FOCUS RETURN CAPITAL TO SHAREHOLDERS Shares (in thousands) Average Price / Share $ (in millions) 2015 Activity 599 $ 24.66 $ 14.8 • Unused Authorization of Approximately $ 65 million • Quarterly Dividend of $0.025 Per Share |
 Q2 2015 FINANCIAL REVIEW |
 Q2 2015 FINANCIAL REVIEW FRANCHISE DEALERSHIPS |
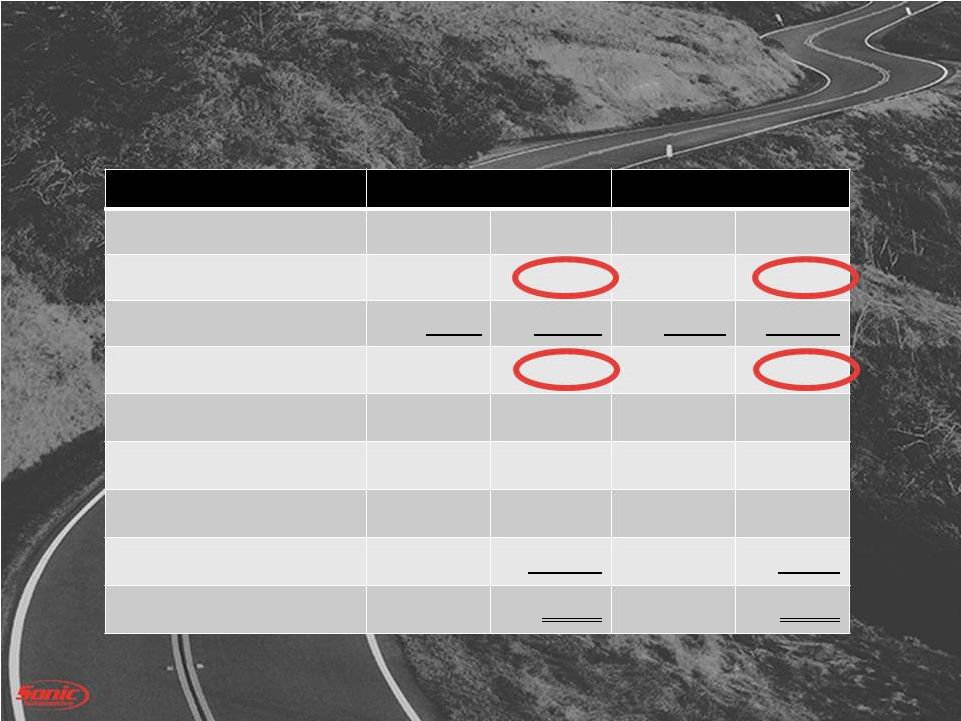
 ADJUSTED FRANCHISED OPERATIONS B/(W) than Q2 2014 (amounts in millions, except per share data) Q2 2015 $ % Revenue $ 2,403 $ 49 2.1% Gross Profit $ 353 $ 6 1.7% SG&A as % of Gross (1) 78.2% 10 bps Operating Profit (1) $ 61 ($ 0) (0.7%) Interest & Other $ 18 $ 1 3.4% Pretax (1) $ 42 $ 0 0.5% Diluted EPS (1) $ 0.51 $ 0 .03 6.3% 11 Note – Continuing operations includes results of sold stores after March 31, 2014.
(1) – Amounts are adjusted. See appendix for reconciliation of adjusted amounts to GAAP amounts |
 Q2 2015 FINANCIAL REVIEW ECHOPARK ® |
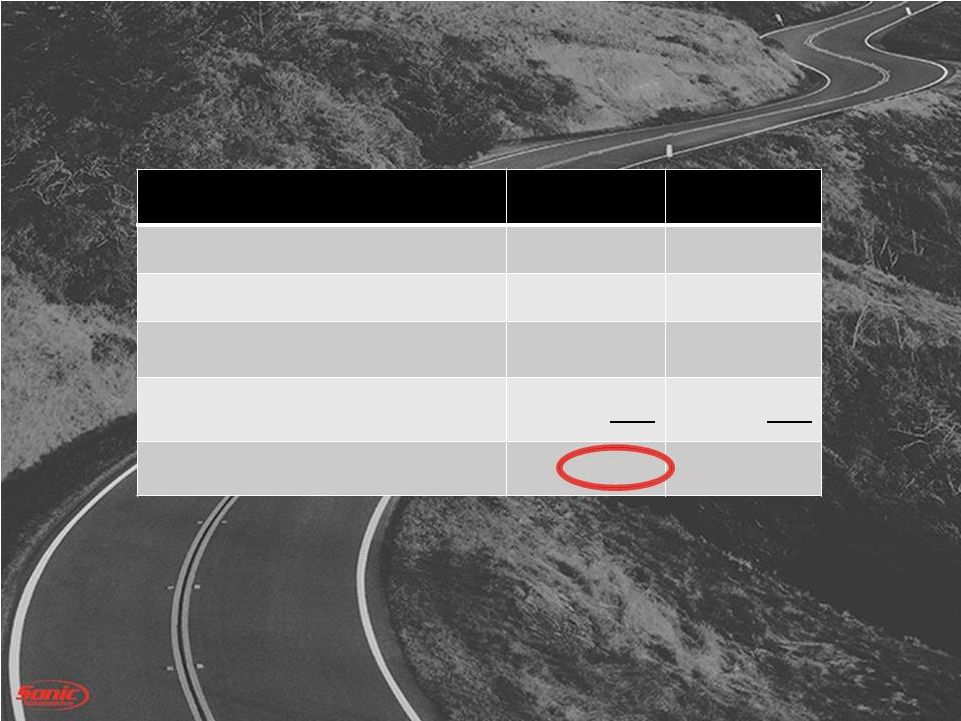
 EchoPark ® Q2 RESULTS 13 B/(W) than Q2 2014 (amounts in millions, except per share data) Q2 2015 $ Revenue $ 21.0 $21.0 Gross Profit $ 2.6 $ 2.6 Operating Profit ($ 3.8) ($ 0.5) Interest & Other ($ 0.3) ($ 0.3) Pre-tax Profit (Loss) ($ 4.1) ($ 0.9) Diluted EPS Impact ($.05) ($.01) Store Level (retail units) 881 n/a |
 Q2 2015 FINANCIAL REVIEW TOTAL ENTERPRISE |
 15 ADJUSTED Q2 2015 RESULTS B/(W) than Q2 2014 (amounts in millions, except per share data) Q2 2015 $ % Revenue $ 2,424 $ 70 3.0% Gross Profit $ 356 $ 9 2.5% Operating Profit (1) $ 57 ($ 1) (1.7%) Interest & Other $ 18 $ 0 1.7% Continuing Ops: Profit (after tax) (1) $ 23 ($ 0) (1.3%) Diluted EPS (1) $ 0.46 $ 0.02 4.5% SG&A as % of Gross (1) 79.2% 0 bps Discontinued Ops Profit/(Loss) (after tax) ($ 0.3) ($0.2) Note – Continuing operations includes results of sold stores after March 31, 2014.
(1) – Amounts are adjusted. See appendix for reconciliation of adjusted amounts to GAAP amounts |
 16 REVENUE & GROSS PROFIT Q2 2015 B/(W) than Q2 2014 (amounts in millions, except per share data) Q2 2015 $ % New Retail Revenue $ 1,286 $ 2 0.2% Used Retail Revenue $ 659 $ 55 9.1% Fixed Operations Revenue $ 346 $ 17 5.2% F&I Revenue $ 82 $ 6 7.3% Total Revenue $ 2,424 $ 70 3.0% New Retail Gross $ 65 ($ 9) (12%) Used Retail Gross $ 41 $3 8.6% Fixed Operations Gross $ 170 $ 10 6.5% F&I Gross $ 82 $ 6 7.3% Total Gross $ 356 $ 9 2.5% |
 17 ADJUSTED SG&A TO GROSS Note – Amounts are adjusted. See appendix for reconciliation of adjusted amounts to GAAP amounts
79.2% 79.2% Q2 2015 Q2 2014 4.3% 4.0% 47.2% 47.0% 7.3% 7.7% 20.4% 20.5% Advertising Comp Rent & Related Other |
 18 (amounts in millions, except per share date) Q2 2015 Q2 2014 Pre-Tax EPS Pre-Tax EPS Adjusted Franchised $42.4 $ 0.51 $ 42.2 $0.48 Adjusted EchoPark® ($4.1) ($0.05) ($ 3.2) ($ 0.04) Adjusted Total $ 38.3 $ 0.46 $39.0 $ 0.44 Adjustments: Impairment/Disposal ($9.7) ($ 0.12) $ 7.3 $ 0.08 Physical Damage ($3.4) ($0.04) ($ 1.1) ($0.01) Other ($0.5) ($ 0.00) ($ 0.3) ($ 0.0) GAAP EPS $ 0.30 $ 0.51 ADJUSTED AND GAAP EPS SUMMARY Continuing Operations |
 CAPITAL SPEND (amounts in millions) YTD Q2 2015 Estimated 2015 Real Estate & Facility Related $ 58.7 $180.1 All Other Cap Ex 24.2 33.8 Subtotal $ 82.9 $ 213.9 Less: Mortgage Funding (1) (46.0) (110.4) Total Cash Used – Cap Ex $ 36.9 $ 103.5 Note – Spending excludes the effect of franchise acquisitions. 19 |
 LIQUIDITY (amounts in millions) Q2 2015 Q4 2014 Cash $ 3.6 $ 4.2 Revolver Availability 144.2 165.6 Used floor plan availability 75.0 22.6 Floor plan deposit balance 54.0 57.5 Total $ 276.8 $ 249.9 20 |
 DEBT COVENANTS Covenant Actual Q2 2015 Liquidity Ratio >= 1.05 1.19 Fixed Charge Coverage Ratio >= 1.20 1.75 Total Lease Adjusted Leverage Ratio <= 5.50 4.24 Compliant with all Covenants 21 |
 OPERATIONS REVIEW |
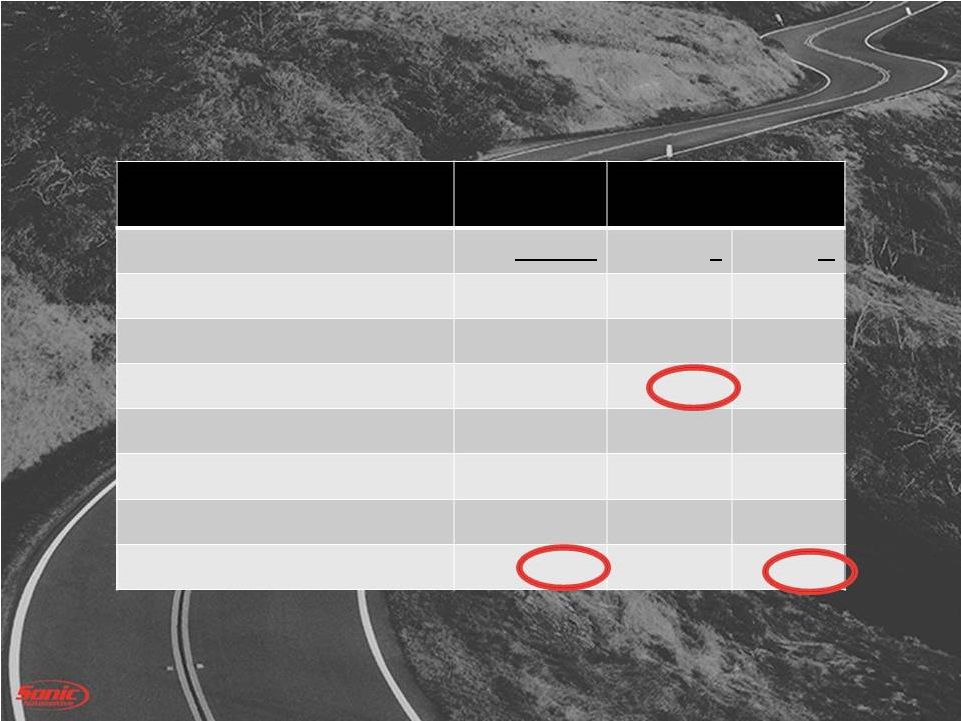
 NEW VEHICLE RETAIL SAME STORE Q2 2015 Q2 2014 B/(W) Volume 34,288 33,567 2.1% Selling Price $ 37,127 $ 36,861 0.7% Gross Margin % 5.1% 5.8% (70 bps) GPU $ 1,890 $ 2,127 ($ 238) Gross Profit $65 million $ 71 million (9.3%) SAAR (includes fleet) 17.1 million 16.5 million 3.6% 23 |
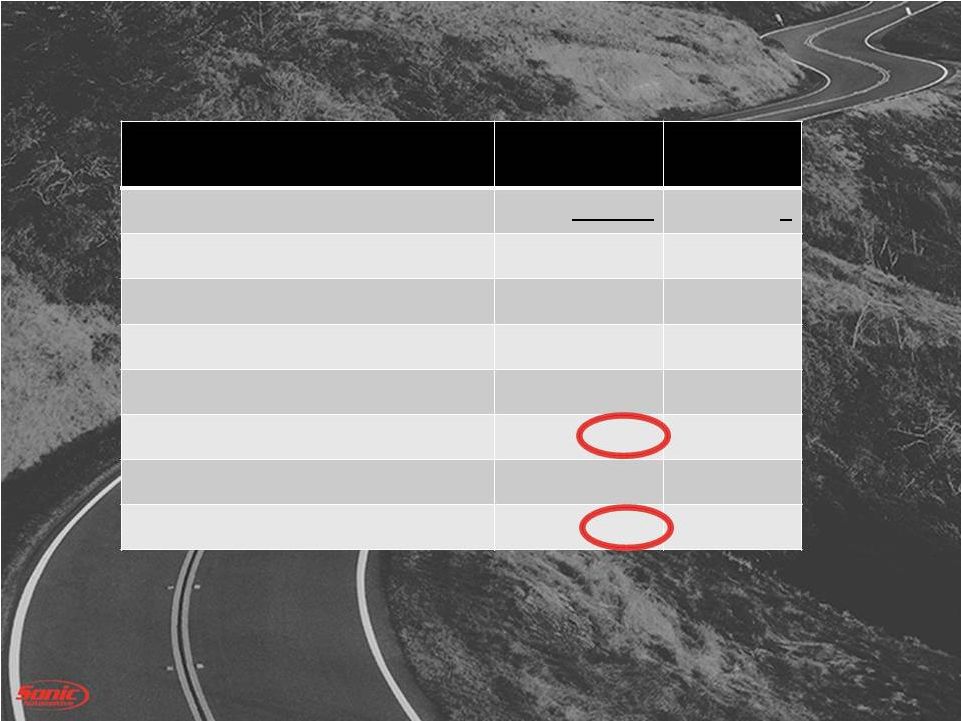
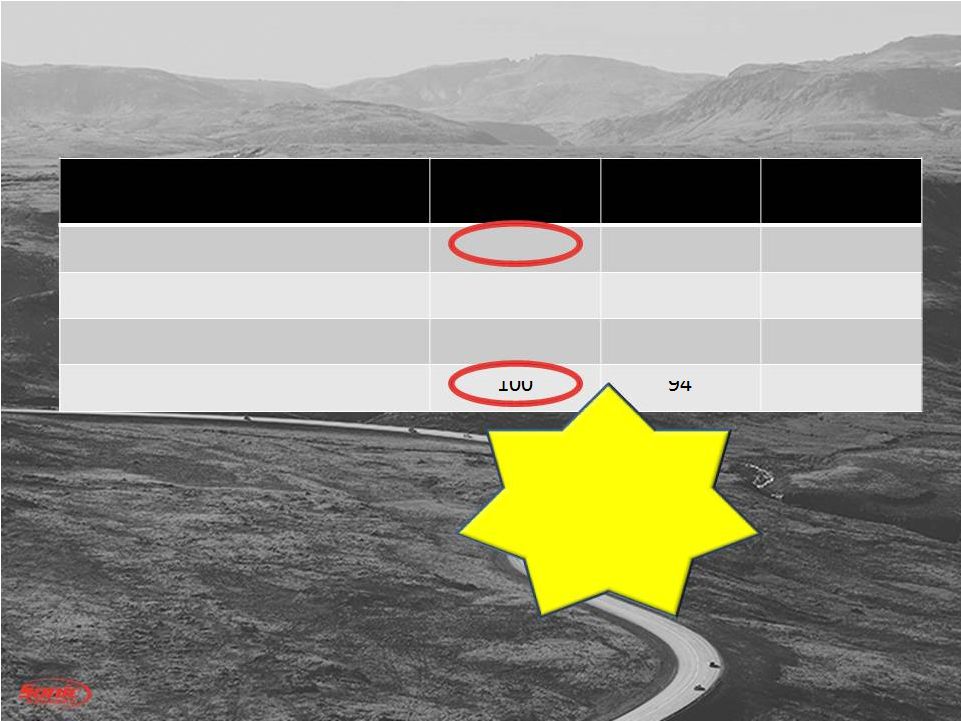 USED VEHICLE RETAIL SAME STORE 24 Q2 2015 Q2 2014 B/(W) Retail Volume 28,973 27,397 5.8% Used Retail GPU $ 1,342 $ 1,338 $ 4 Used to New 0.84:1.00 0.82:1.00 0.02 Vehicles / store / month (97 stores) 100 94 6 1 st time Averaging 100 units per store per month for an entire quarter! |
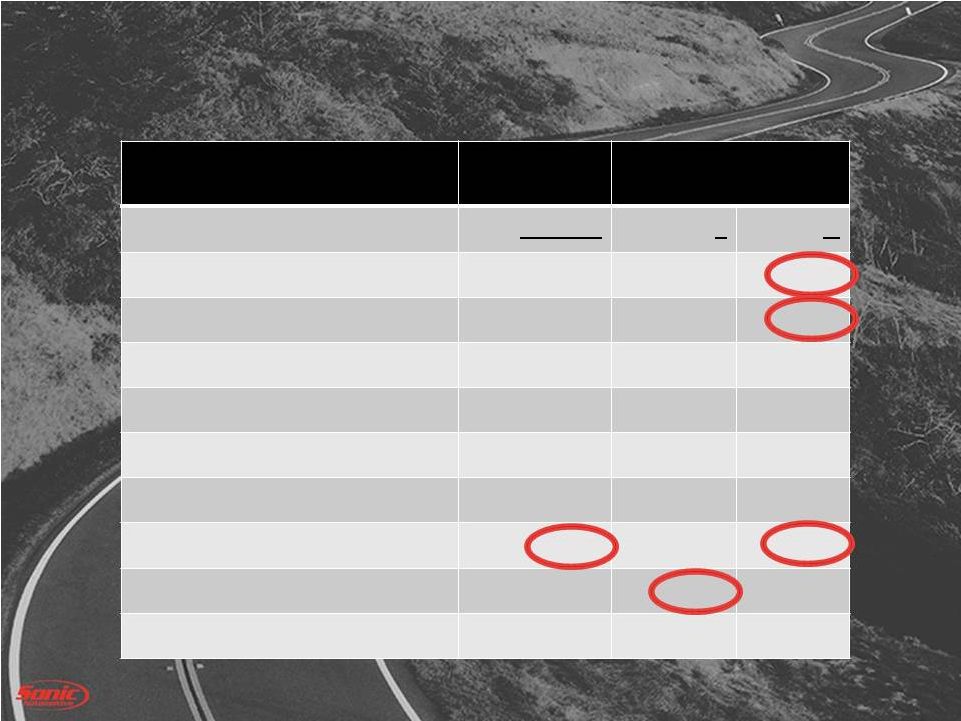
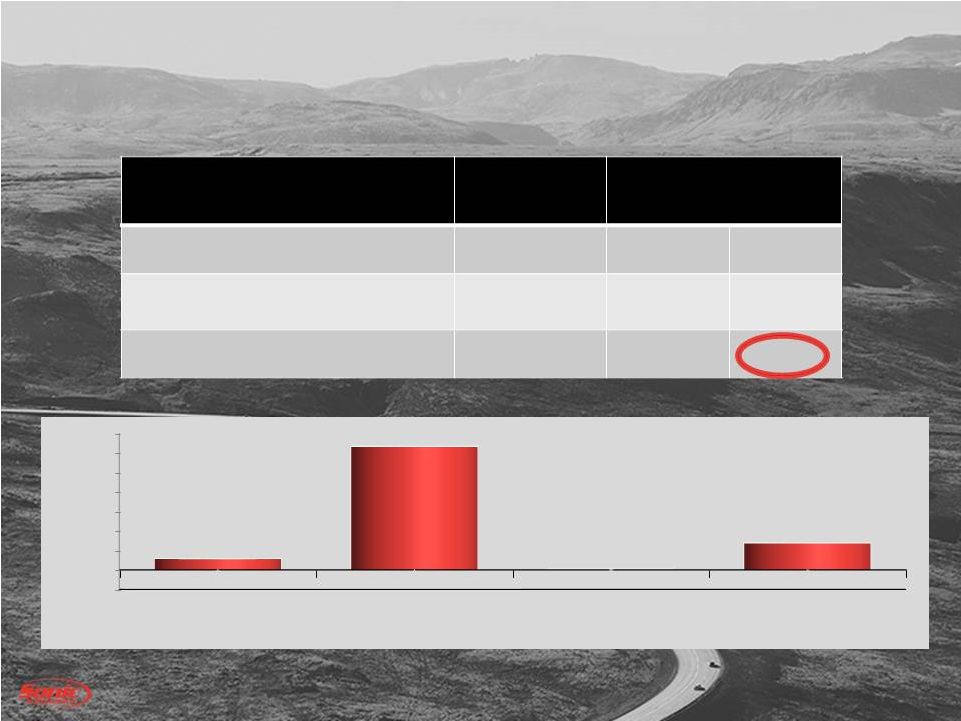 FIXED OPS SAME STORE Q2 2015 B/(W) than Q2 2014 (amounts in millions) $ % Revenue $ 341 $ 22 7.0% Gross Profit $ 168 $ 13 8.5% 25 (5.0%) 0.0% 5.0% 10.0% 15.0% 20.0% 25.0% 30.0% 35.0% Customer Pay Warranty Wholesale Parts Internal & Sublet 2.9% 31.7% 0.2% 6.9% YOY Gross % Change |
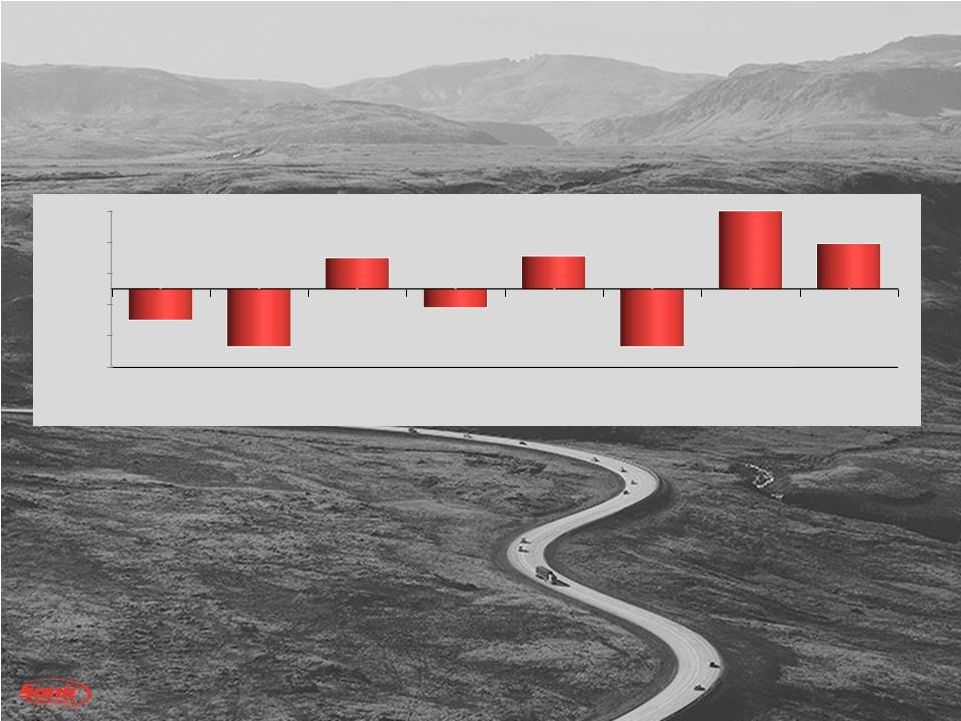 FIXED OPS SAME STORE – CUSTOMER PAY 26 + 1 Day - 1 Day (5.0%) (3.0%) (1.0%) 1.0% 3.0% 5.0% Jan Feb Mar Q1 Apr May Jun Q2 (2.0%) (3.7%) 2.0% (1.2%) 2.1% (3.7%) 10.5% 2.9% YOY Gross % Change |
 OSOE |
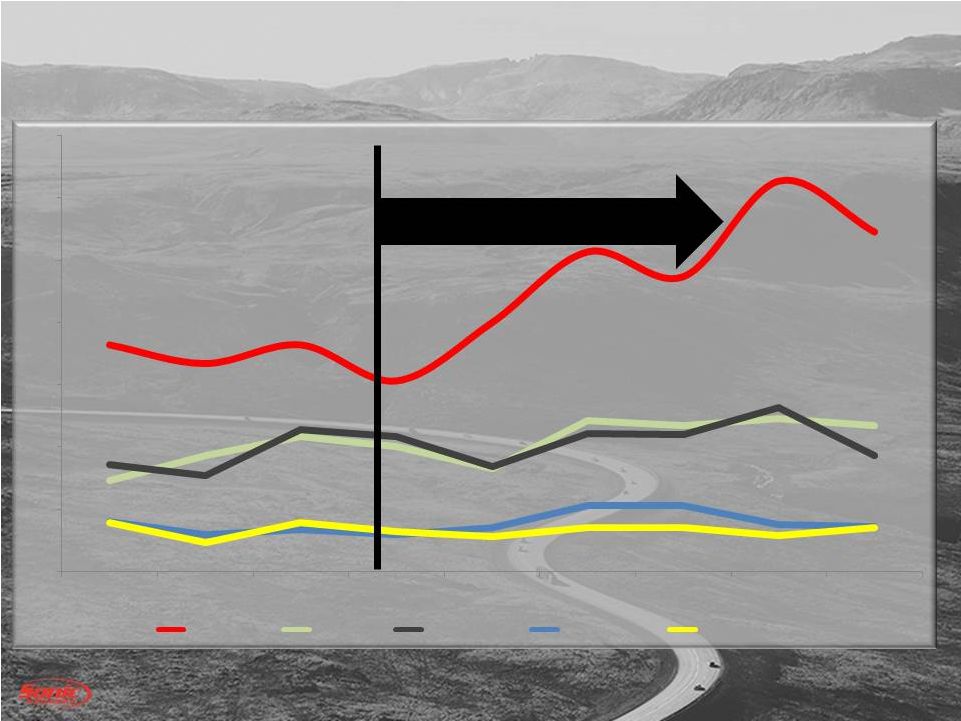 28 OSOE – Operational Metrics New Retail Units Upward Trend 182 167 182 153 200 257 237 314 273 73 93 108 100 83 121 117 123 117 86 77 114 108 84 111 110 132 93 40 30 34 30 35 53 53 38 36 39 23 39 32 28 35 35 29 35 0 50 100 150 200 250 300 350 Oct-14 Nov-14 Dec-14 Jan-15 Feb-15 Mar-15 Apr-15 May-15 Jun-15 T&C Toyota T&C Ford Fort Mill Ford Infiniti of CHL Cadillac of CHL |
 29 OSOE – Operational Metrics Pre-Owned Retail Units Upward Trend 122 108 125 117 122 142 143 160 186 96 86 75 91 90 109 95 120 120 74 61 78 78 78 90 78 107 104 37 26 48 34 36 47 52 53 65 67 60 68 63 57 58 72 66 79 0 20 40 60 80 100 120 140 160 180 200 Oct-14 Nov-14 Dec-14 Jan-15 Feb-15 Mar-15 Apr-15 May-15 Jun-15 T&C Toyota T&C Ford Fort Mill Ford Infiniti of CHL Cadillac of CHL |
 30 OSOE – NEXT STEPS 1. Continue to focus on inventory management and pricing 2. OSOE stores continue to improve across all areas of our business
3. We continue to learn and have excellent CSI and guest feedback 4. Begin rollout of technology – CRM, Desking tool and Appraisal tool effective 8/1/15 to give stores access to this incredible technology |
 EchoPark ® |
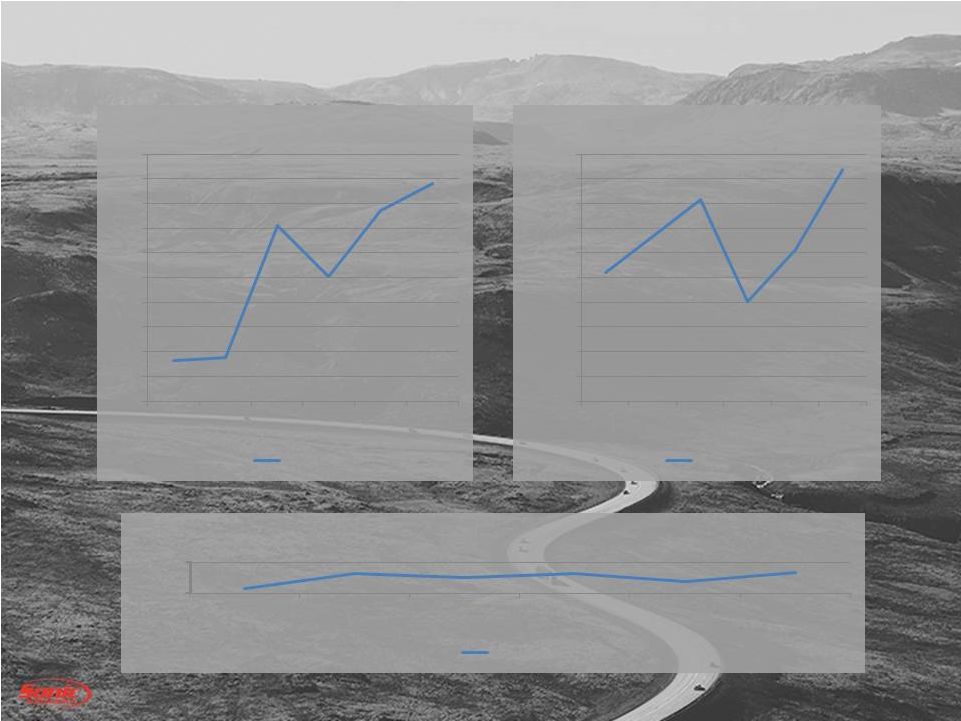 EchoPark ® - Total 32 183 185 292 251 304 326 150 170 190 210 230 250 270 290 310 330 350 Jan Feb Mar Apr May June Retail Unit Sales Actual 1,039 1,331 1,636 804 1,228 1,877 - 200 400 600 800 1,000 1,200 1,400 1,600 1,800 2,000 Jan Feb Mar Apr May June Gross Per Retail Unit Actual 829 926 901 924 877 930 800 1,000 Jan Feb Mar Apr May June F&I Per Unit Actual |
 Continue to grow sales across all revenue categories
Pre-owned milestone achieved – believe we can continue to grow volumes per store Fixed operations growth showed strength in customer pay and warranty OSOE roll out to additional markets will include portions of the technology components Growth plans in EchoPark ® expected to accelerate in the latter half of the year SUMMARY 33 |
 |
 Appendix 35 |
 NON-GAAP RECONCILIATIONS 36 Consolidated Franchised Dealerships EchoPark® Three Months Ended Three Months Ended Three Months Ended June 30, June 30, June 30, 2015 2014 2015 2014 2015 2014 (In millions) SG&A Reconciliation: As Reported . . . . . . . . . . . . . . . . . . . . . . . . . . . . . . . . . . . . .
284.7
$
268.9
$
279.1
$
265.7
$
5.6
$
3.2 $
Pre-tax Adjustments:
Gain on disposal . . . . . . . . . . . . . . . . . . . .
.. . . . . . . . . . . 1.1
7.3 1.1
7.3 -
- Storm damage and other . . . . . . . . . .
.. . . . . . . . . . . . . . .
(4.3)
(1.4) (4.3)
(1.4) -
- Total pre-tax adjustments . . . . . .
.. . . . . . . . . . . . . . .
(3.2)
5.9 (3.2)
5.9 -
- Adjusted SG&A . . . . . . . . .
.. . . . . . . . . . . . . . . . . . . . . . . . 281.5 $
274.8
$
275.9
$
271.6
$
5.6
$
3.2 $
SG&A as % of Gross
Reconciliation: As Reported . . . . . . . .
.. . . . . . . . . . . . . . . . . . . . . . . . . . . . . 80.1% 77.5% 79.1% 76.6% NM NM Pre-tax Adjustments: Gain on disposal . . . . . . . . . . . . . . . . . . . . . . . . . . . . . . .
0.3%
2.1%
0.3%
2.1%
NM
NM
Storm damage and other . . . . . . . . . . . . . . . . .
.. . . . . . . . (1.2%)
(0.4%)
(1.2%)
(0.4%)
NM
NM
Total pre-tax adjustments . . . . . . . . . . . . .
.. . . . . . . . (0.9%)
1.7%
(0.9%)
1.7%
NM
NM
Adjusted SG&A as % of Gross . . . . . . . . . . . .
.. . . . . . . . . . 79.2%
79.2%
78.2%
78.3%
NM
NM
NM = Not meaningful
This release contains certain non-GAAP financial
measures (the "Adjusted" amounts) as defined under SEC rules, such as, but not limited to, adjusted income from continuing operations and related earnings per share data. The Company has reconciled these measures to the most
directly comparable GAAP measures (the "Reported" amounts) in the release. The Company believes that these non-GAAP financial measures improve the transparency of the Company’s
disclosure by providing period-to-period comparability of the Company’s results from operations. |
 37 NON-GAAP RECONCILIATIONS Consolidated Franchised Dealerships EchoPark® Three Months Ended Three Months Ended Three Months Ended June 30, June 30, June 30, 2015 2014 2015 2014 2015 2014 (In millions) Operating Profit Reconciliation: As Reported . . . . . . . . . . . . . . . . . . . . . . . . . . . . . . . . . . . . .
43.1
$
63.6
$
46.9
$
66.8
$
(3.8)
$
(3.2)
$
Pre-tax Adjustments:
SG&A . . . . . . . . . . . . . . . . . . . . . . . .
.. . . . . . . . . . . . . . .
3.2
(5.9) 3.2
(5.9) -
- Impairment charges . . . . . . . . . . . .
.. . . . . . . . . . . . . . . . .
10.4
- 10.4
- -
- Total pre-tax adjustments . . . . . .
.. . . . . . . . . . . . . . .
13.6
(5.9) 13.6
(5.9) -
- Adjusted Operating Profit . . . . .
.. . . . . . . . . . . . . . . . . . . . .
56.7
$
57.7
$
60.5
$
60.9
$
(3.8)
$
(3.2)
$
Pre-tax Profit from Continuing Operations
Reconciliation: As Reported . . . . . . . .
.. . . . . . . . . . . . . . . . . . . . . . . . . . . . . 24.7 $
44.9
$
28.8
$
48.1
$
(4.1)
$
(3.2)
$
Pre-tax Adjustments:
SG&A . . . . . . . . . . . . . . . . . . . . . . . .
.. . . . . . . . . . . . . . .
3.2
(5.9) 3.2
(5.9) -
- Impairment charges . . . . . . . . . . . .
.. . . . . . . . . . . . . . . . .
10.4
- 10.4
- -
- Total pre-tax adjustments . . . . . .
.. . . . . . . . . . . . . . .
13.6
(5.9) 13.6
(5.9) -
- Adjusted Pre-tax Profit from
Continuing Operations . . . . .
38.3
$
39.0
$
42.4
$
42.2
$
(4.1)
$
(3.2)
$
Profit
from Continuing Operations (after-tax) Reconciliation: As Reported . . . . . . . . . . . . . . . . . . . . . . . . . . . . . . . . . . . . .
15.1
$
27.1
$
After-tax Adjustments:
SG&A . . . . . . . . . . . . . . . . . . . . . . . .
.. . . . . . . . . . . . . . .
2.0
(3.6) Impairment charges . . . . . . . . . . . .
.. . . . . . . . . . . . . . . . .
6.3
- Total after-tax adjustments . . . . .
.. . . . . . . . . . . . . . .
8.3
(3.6) Adjusted Profit from Continuing Operations
(after-tax) . . . 23.4
$
23.5
$
|
 NON-GAAP RECONCILIATIONS 38 Consolidated Franchised Dealerships EchoPark® Six Months Ended Six Months Ended Six Months Ended June 30, June 30, June 30, 2015 2014 2015 2014 2015 2014 (In millions) SG&A Reconciliation: As Reported . . . . . . . . . . . . . . . . . . . . . . . . . . . . . . . . . . . . .
555.5
$
532.9
$
544.0
$
527.9
$
11.5
$
5.0
$
Pre-tax Adjustments: Gain on disposal . . . . . . . . . . . . . . . . . . . . . . . . . . . . . . .
1.0
7.3 1.0
7.3 -
- Storm damage, severance and other . . . .
.. . . . . . . . . . . .
(5.2)
(1.4) (5.2)
(1.4) -
- Total pre-tax adjustments . . . . . .
.. . . . . . . . . . . . . . .
(4.2)
5.9 (4.2)
5.9 -
- Adjusted SG&A . . . . . . . . .
.. . . . . . . . . . . . . . . . . . . . . . . . 551.3 $
538.8
$
539.8
$
533.8
$
11.5
$
5.0
$
SG&A as % of Gross Reconciliation: As Reported . . . . . . . . . . . . . . . . . . . . . . . . . . . . . . . . . . . . .
80.5%
78.8%
79.3%
78.1%
NM
NM
Pre-tax Adjustments:
Gain on disposal . . . . . . . . . . . . . . . . . . . .
.. . . . . . . . . . . 0.1%
1.1%
0.1%
1.1%
NM
NM
Storm damage, severance and other . . . . . . . . . . .
.. . . . . (0.8%)
(0.2%)
(0.7%)
(0.2%)
NM
NM
Total pre-tax adjustments . . . . . . . . . . . . .
.. . . . . . . . (0.7%)
0.9%
(0.6%)
0.9%
NM
NM
Adjusted SG&A as % of Gross . . . . . . . . . . . .
.. . . . . . . . . . 79.8%
79.7%
78.7%
79.0%
NM
NM
NM = Not meaningful
|
 39 NON-GAAP RECONCILIATIONS Consolidated Franchised Dealerships EchoPark® Six Months Ended Six Months Ended Six Months Ended June 30, June 30, June 30, 2015 2014 2015 2014 2015 2014 (In millions) Operating Profit Reconciliation: As Reported . . . . . . . . . . . . . . . . . . . . . . . . . . . . . . . . . . . . .
84.6
$
114.2
$
94.6
$
119.2
$
(10.0)
$
(5.0)
$
Pre-tax Adjustments:
SG&A . . . . . . . . . . . . . . . . . . . . . . . .
.. . . . . . . . . . . . . . .
4.2
(5.9) 4.2
(5.9) -
- Impairment charges . . . . . . . . . . . .
.. . . . . . . . . . . . . . . . .
16.7
- 15.3
- 1.4
- Total pre-tax adjustments . . . . . .
.. . . . . . . . . . . . . . .
20.9
(5.9) 19.5
(5.9) 1.4
- Adjusted Operating Profit . . . . .
.. . . . . . . . . . . . . . . . . . . . .
105.5
$
108.3
$
114.1
$
113.3
$
(8.6)
$
(5.0)
$
Pre-tax Profit from Continuing Operations
Reconciliation: As Reported . . . . . . . .
.. . . . . . . . . . . . . . . . . . . . . . . . . . . . . 48.3 $
77.1
$
58.7
$
82.1
$
(10.4)
$
(5.0)
$
Pre-tax Adjustments:
SG&A . . . . . . . . . . . . . . . . . . . . . . . .
.. . . . . . . . . . . . . . .
4.2
(5.9) 4.2
(5.9) -
- Impairment charges . . . . . . . . . . . .
.. . . . . . . . . . . . . . . . .
16.7
- 15.3
- 1.4
- Total pre-tax adjustments . . . . . .
.. . . . . . . . . . . . . . .
20.9
(5.9) 19.5
(5.9) 1.4
- Adjusted Pre-tax Profit from
Continuing Operations . . . . .
69.2
$
71.2
$
78.2
$
76.2
$
(9.0)
$
(5.0)
$
Profit
from Continuing Operations (after-tax) Reconciliation: As Reported . . . . . . . . . . . . . . . . . . . . . . . . . . . . . . . . . . . . .
29.5
$
47.0
$
After-tax Adjustments:
SG&A . . . . . . . . . . . . . . . . . . . . . . . .
.. . . . . . . . . . . . . . .
2.6
(3.6) Impairment charges . . . . . . . . . . . .
.. . . . . . . . . . . . . . . . .
10.2
- Total after-tax adjustments . . . . .
.. . . . . . . . . . . . . . .
12.7
(3.6) Adjusted Profit from Continuing Operations
(after-tax) . . . 42.2
$
43.4
$
|
 40 NON-GAAP RECONCILIATIONS Three Months Ended June 30, 2015 Income (Loss) Income (Loss) From Continuing From Discontinued Operations Average Net Income (Loss) Weighted Per Per Per Average Share Share Share Shares Amount Amount Amount Amount Amount Amount (In thousands, except per share amounts) Reported: Earnings (loss) and shares . . . . . . . . . . . . . . . . . .
50,784
15,092
$
(311)
$
14,781
$
Effect of participating securities:
Non-vested restricted stock
and stock units . . . . . . . . . . . . . . . . . . . .
.. . . (7)
-
(7)
Basic
earnings (loss) and shares . . . . . . . . . . . . . 50,784 15,085 $ 0.30 $ (311) $ (0.01) $ 14,774 $ 0.29 $ Effect of dilutive securities: Stock compensation plans . . . . . . . . . . . . . . . .
309
Diluted earnings (loss)
and shares . . . . . . . . . . . .
51,093
15,085
$
0.30
$
(311)
$
(0.01)
$
14,774
$
0.29
$
Adjustments (net of tax):
Gain on disposal. . . . . . . . . . . . . . . . . . . .
.. . . . . (645)
$
(0.01)
$
-
$
-
$
(645)
$
(0.01)
$
Impairment charges. . . . . . . . . . . . . . . . . . .
.. . . . 6,386
0.12
-
-
6,386
0.12
Storm damage and other. . . . . . . . . .
.. . . . . . . . . . 2,555
0.05
-
-
2,555
0.05
Total adjustments . . . . . . . . . . . .
.. . . . . . . . . . 8,296
$
0.16
$
-
$
-
$
8,296
$
0.16
$
Adjusted:
Earnings (loss) and
Diluted earnings (loss) per share (1) . . . . . . . .
23,388
$
0.46
$
(311)
$
(0.01)
$
23,077
$
0.45
$
(1) Expenses attributable to
EchoPark® operations were $0.05 per fully diluted share in the three months ended June 30, 2015. |
 41 NON-GAAP RECONCILIATIONS Three Months Ended June 30, 2014 Income (Loss) Income (Loss) From Continuing From Discontinued Operations Operations Net Income (Loss) Weighted Per Per Per Average Share Share Share Shares Amount Amount Amount Amount Amount Amount (In thousands, except per share amounts) Reported: Earnings (loss) and shares . . . . . . . . . . . . . . . . . .
52,514
27,061
$
(68)
$
26,993
$
Effect of participating securities:
Non-vested restricted stock
and stock units . . . . . . . . . . . . . . . . . . . .
.. . . (87)
-
(87)
Basic earnings (loss)
and shares . . . . . . . . . . . . .
52,514
26,974
$
0.51
$
(68)
$
-
$
26,906
$
0.51
$
Effect of dilutive
securities: Stock compensation plans . . .
.. . . . . . . . . . . . . 416
Diluted earnings (loss)
and shares. . . . . . . . . . . .
52,930
26,974
$
0.51
$
(68)
$
-
$
26,906
$
0.51
$
Adjustments (net of tax):
Gain on disposal. . . . . . . . . . . . . . . . . . . .
.. . . . . (4,446)
$
(0.08)
$
-
$
-
$
(4,446)
$
(0.08)
$
Storm damage and other. . . . . . . . . . . . . . . . .
.. . . 840
0.01
-
-
840
0.01
Total adjustments . . . . . . . . . . . .
.. . . . . . . . . . (3,606)
$
(0.07)
$
-
$
-
$
(3,606)
$
(0.07)
$
Adjusted:
Earnings (loss) and
Diluted earnings (loss) per share (2) . . . . . . . .
23,455
$
0.44
$
(68)
$
-
$
23,387
$
0.44
$
(2) Expenses attributable to
EchoPark® operations were $0.04 per fully diluted share in the three months ended June 30, 2014. |
 42 NON-GAAP RECONCILIATIONS Six Months Ended June 30, 2015 Income (Loss) Income (Loss) From Continuing From Discontinued Operations Operations Net Income (Loss) Weighted Per Per Per Average Share Share Share Shares Amount Amount Amount Amount Amount Amount (In thousands, except per share amounts) Reported: Earnings (loss) and shares . . . . . . . . . . . . . . . . . .
50,819
29,481
$
(732)
$
28,749
$
Effect of participating securities:
Non-vested restricted stock
and stock units . . . . . . . . . . . . . . . . . . . .
.. . . (14)
-
(14)
Basic earnings (loss)
and shares . . . . . . . . . . . . .
50,819
29,467
$
0.58
$
(732)
$
(0.01)
$
28,735
$
0.57
$
Effect of dilutive
securities: Stock compensation plans . . .
.. . . . . . . . . . . . . 428
Diluted earnings (loss)
and shares. . . . . . . . . . . .
51,247
29,467
$
0.57
$
(732)
$
(0.01)
$
28,735
$
0.56
$
Adjustments (net of tax):
Gain on disposal. . . . . . . . . . . . . . . . . . . .
.. . . . . (583)
$
(0.01)
$
-
$
-
$
(583)
$
(0.01)
$
Impairment charges. . . . . . . . . . . . . . . . . . .
.. . . . 10,166
0.20
-
-
10,166
0.20
Storm damage and other. . . . . . . . . .
.. . . . . . . . . . 3,132
0.06
-
-
3,132
0.06
Total adjustments . . . . . . . . . . . .
.. . . . . . . . . . 12,715
$
0.25
$
-
$
-
$
12,715
$
0.25
$
Adjusted:
Earnings (loss) and
Diluted earnings (loss) per share (3) . . . . . . . .
42,196
$
0.82
$
(732)
$
(0.01)
$
41,464
$
0.81
$
(3) Expenses attributable to
EchoPark® operations were $0.11 per fully diluted share in the six months ended June 30, 2015. |
 43 NON-GAAP RECONCILIATIONS Six Months Ended June 30, 2014 Income (Loss) Income (Loss) From Continuing From Discontinued Operations Operations Net Income (Loss) Weighted Per Per Per Average Share Share Share Shares Amount Amount Amount Amount Amount Amount (In thousands, except per share amounts) Reported: Earnings (loss) and shares . . . . . . . . . . . . . . . . . .
52,466
47,045
$
(666)
$
46,379
$
Effect of participating securities:
Non-vested restricted stock
and stock units . . . . . . . . . . . . . . . . . . . .
.. . . (151)
-
(151)
Basic earnings (loss) and shares .
.. . . . . . . . . . . .
52,466
46,894
$
0.89
$
(666)
$
(0.01)
$
46,228
$
0.88
$
Effect of dilutive
securities: Stock compensation plans . . .
.. . . . . . . . . . . . . 472
Diluted earnings (loss)
and shares . . . . . . . . . . . .
52,938
46,894
$
0.89
$
(666)
$
(0.02)
$
46,228
$
0.87
$
Adjustments (net of tax):
Gain on disposal. . . . . . . . . . . . . . . . . . . .
.. . . . . (4,446)
$
(0.08)
$
-
$
-
$
(4,446)
$
(0.08)
$
Storm damage and other. . . . . . . . . . . . . . . . .
.. . . 840
0.01
-
-
840
0.01
Effect of two-class method &
rounding . . . . . . . -
-
-
0.01
-
0.01
Total adjustments . . . . . . . . . . . .
.. . . . . . . . . . (3,606)
$
(0.07)
$
-
$
0.01
$
(3,606)
$
(0.06)
$
Adjusted:
Earnings (loss) and
Diluted earnings (loss) per share (4) . . . . . . . .
43,439
$
0.82
$
(666)
$
(0.01)
$
42,773
$
0.81
$
(4) Expenses attributable to
EchoPark® operations were $0.06 per fully diluted share in the six months ended June 30, 2014. |
 |