
Q4 and Full Year 2015 Earnings Review February 23, 2016 Exhibit 99.2
FORWARD-LOOKING STATEMENTS This presentation contains “forward-looking statements” within the meaning of the Private Securities Litigation Reform Act of 1995. These statements relate to future events, are not historical facts and are based on our current expectations and assumptions regarding our business, the economy and other future conditions. These statements can generally be identified by lead-in words such as “believe”, “expect”, “anticipate”, “intend”, “plan”, “foresee”, “may” ,”will” and other similar words. Statements that describe our Company’s objectives, plans or goals are also forward-looking statements. Examples of such forward-looking information we may be discussing in this presentation include, without limitation, anticipated 2016 industry new vehicle sales volume, the implementation of growth and operating strategies, including acquisitions of dealerships and properties, the development of open points and stand-alone pre-owned stores, the return of capital to shareholders , anticipated future success and impacts from the implementation of our strategic initiatives and earnings per share expectations. You are cautioned that these forward-looking statements are not guarantees of future performance, involve risks and uncertainties and actual results may differ materially from those projected in the forward-looking statements as a result of various factors. These risks and uncertainties include, among other things, (a) economic conditions in the markets in which we operate, (b) the success of our operational strategies, (c) our relationships with the automobile manufacturers, (d) new and pre-owned vehicle sales volume, and (e) earnings expectations for the year ending December 31, 2016. These risks and uncertainties, as well as additional factors that could affect our forward-looking statements, are described in our Form 10-K for the year ended December 31, 2014. These forward-looking statements, risks, uncertainties and additional factors speak only as of the date of this presentation. We undertake no obligation to update any such statements.
CONTENT STRATEGIC FOCUS FINANCIAL REVIEW OPERATIONS REVIEW SUMMARY & OUTLOOK
STRATEGIC FOCUS Growth EchoPark® One Sonic-One Experience Acquisitions & Open Points Own Our Properties Return Capital to Shareholders Share Repurchases Dividends
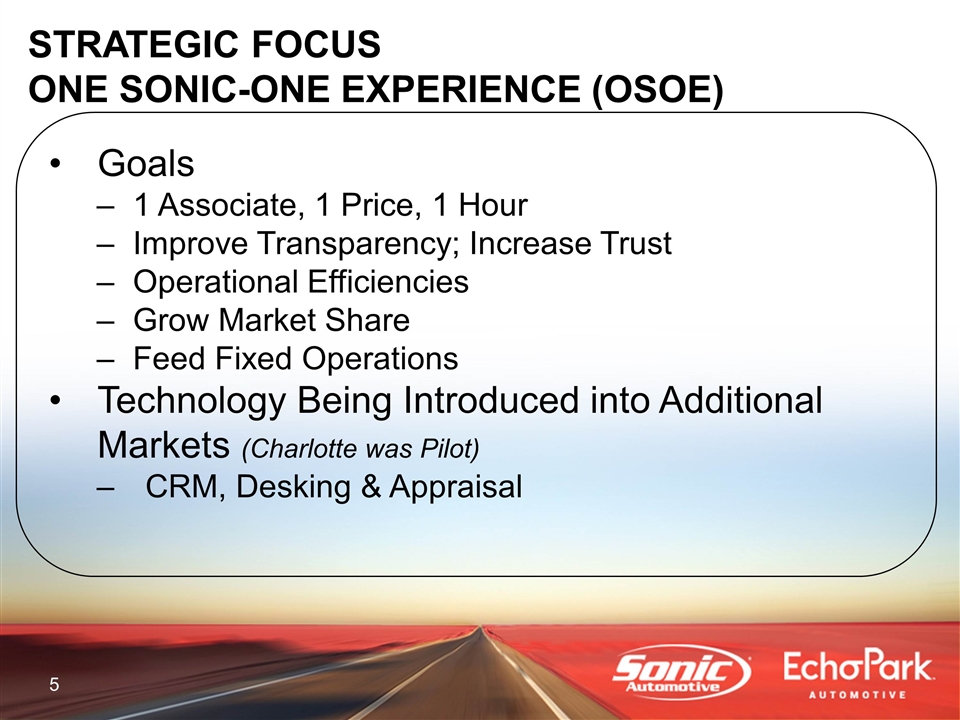
STRATEGIC FOCUS ONE SONIC-ONE EXPERIENCE (OSOE) Goals 1 Associate, 1 Price, 1 Hour Improve Transparency; Increase Trust Operational Efficiencies Grow Market Share Feed Fixed Operations Technology Being Introduced into Additional Markets (Charlotte was Pilot) CRM, Desking & Appraisal

STRATEGIC FOCUS EchoPark® Three Locations Open In Denver Thornton Hub Centennial Highlands Ranch Locations to Open in Denver Market in First Half of 2016 Dakota Ridge Stapleton Two Additional Denver Market Locations by End of 2016 Purchasing Property in Two Other Markets
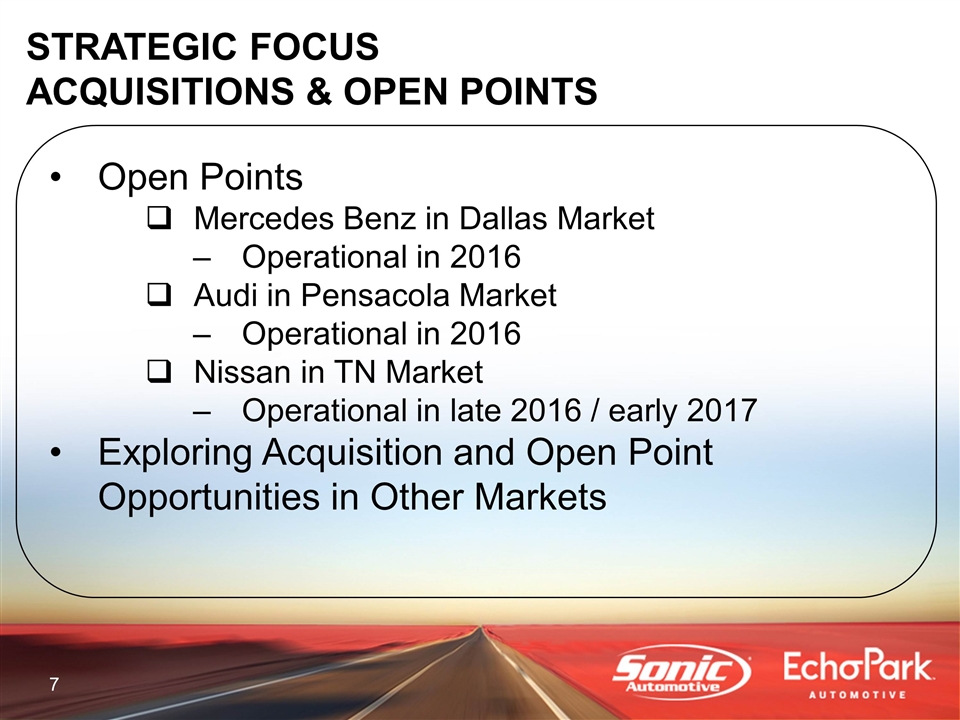
STRATEGIC FOCUS ACQUISITIONS & OPEN POINTS Open Points Mercedes Benz in Dallas Market Operational in 2016 Audi in Pensacola Market Operational in 2016 Nissan in TN Market Operational in late 2016 / early 2017 Exploring Acquisition and Open Point Opportunities in Other Markets
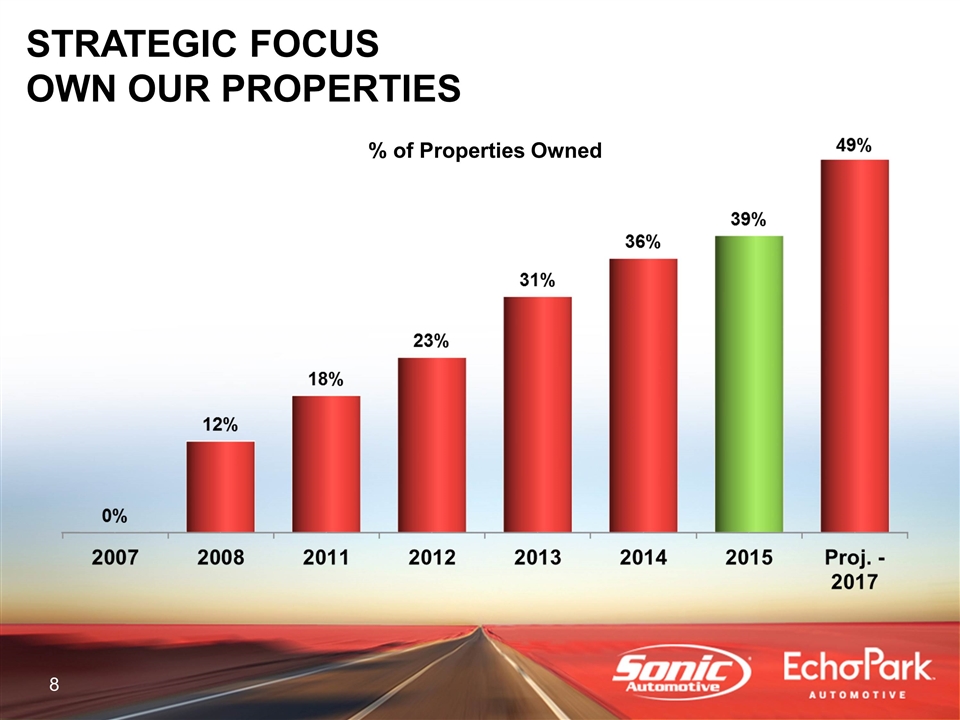
STRATEGIC FOCUS OWN OUR PROPERTIES % of Properties Owned
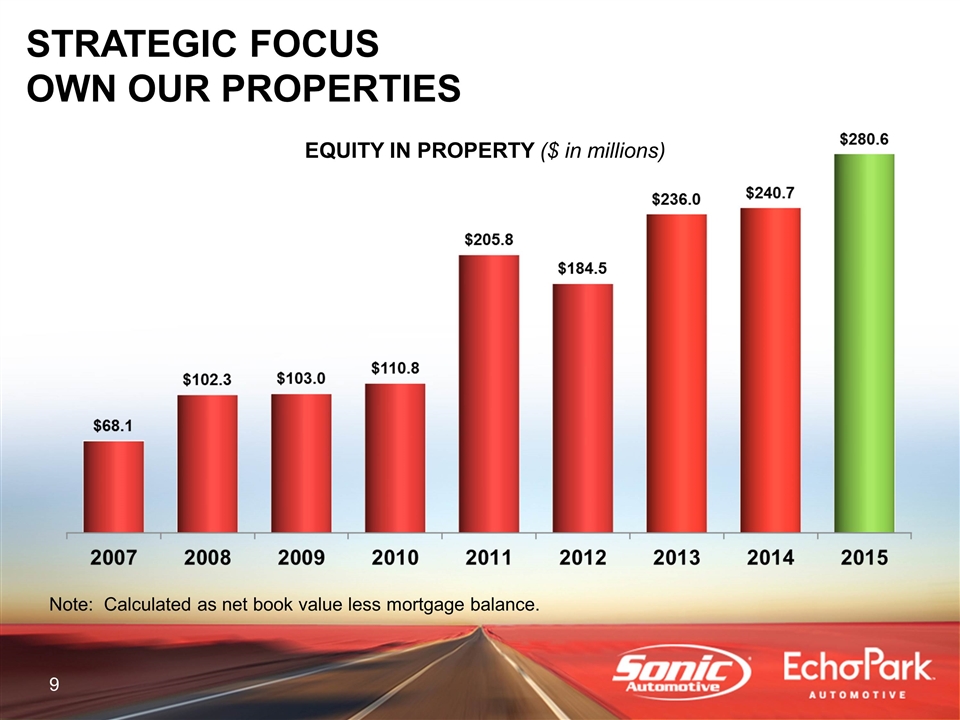
EQUITY IN PROPERTY ($ in millions) Note: Calculated as net book value less mortgage balance. STRATEGIC FOCUS OWN OUR PROPERTIES
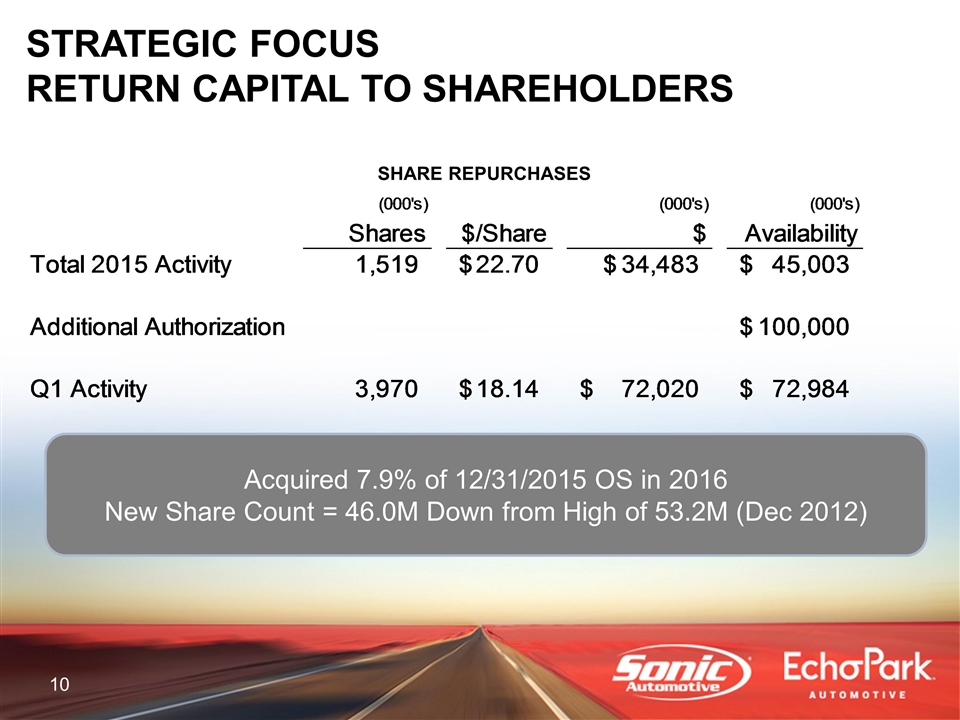
SHARE REPURCHASES Acquired 7.9% of 12/31/2015 OS in 2016 New Share Count = 46.0M Down from High of 53.2M (Dec 2012) STRATEGIC FOCUS RETURN CAPITAL TO SHAREHOLDERS (000's) (000's) (000's) Shares $/Share $ Availability Total 2015 Activity 1,519 $22.7 $34,483 $45,003.298999999999 Additional Authorization $,100,000 Q1 Activity 3,970 18.14 $18.140965491183881 $72,019.633000000002 $72,983.665999999997
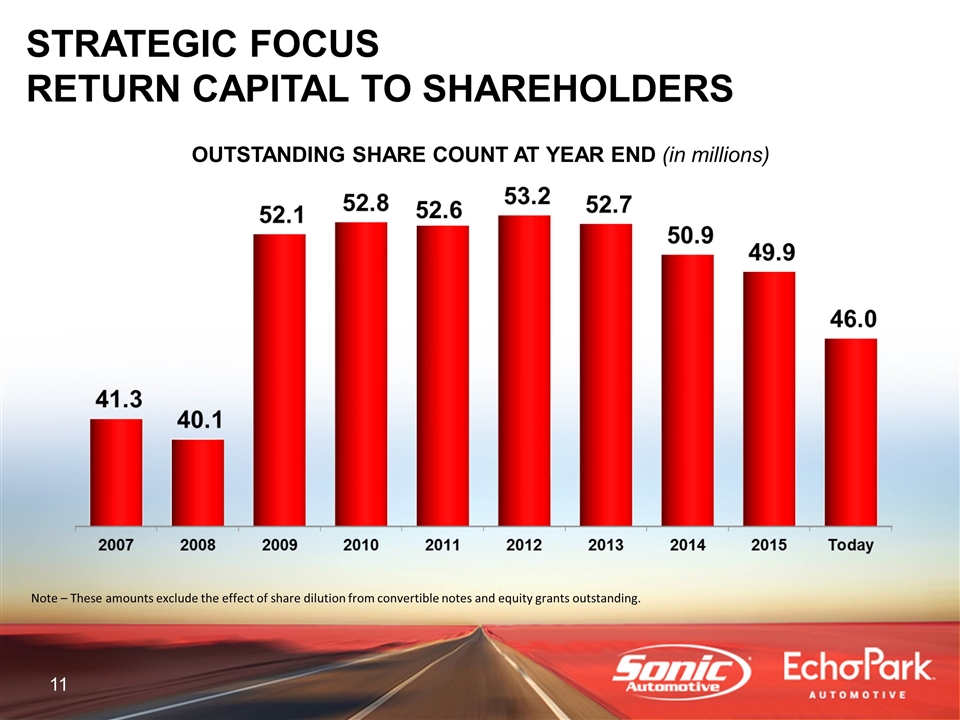
OUTSTANDING SHARE COUNT AT YEAR END (in millions) Note – These amounts exclude the effect of share dilution from convertible notes and equity grants outstanding. STRATEGIC FOCUS RETURN CAPITAL TO SHAREHOLDERS
Q4 2015 FINANCIAL REVIEW
Q4 2015 FINANCIAL REVIEW FRANCHISED SEGMENT
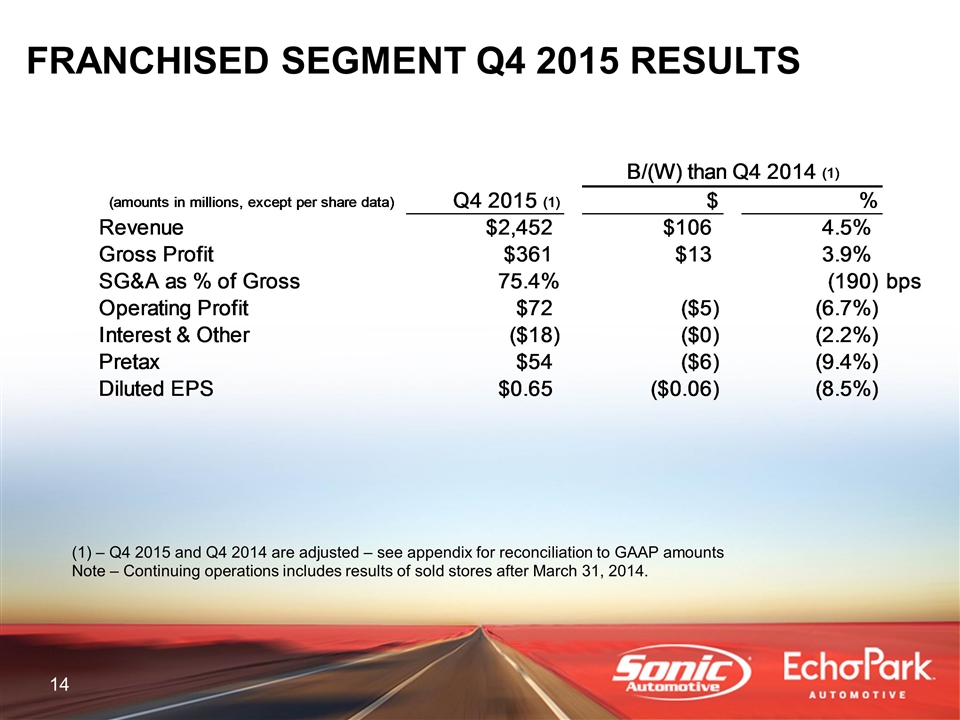
FRANCHISED SEGMENT Q4 2015 RESULTS – Q4 2015 and Q4 2014 are adjusted – see appendix for reconciliation to GAAP amounts Note – Continuing operations includes results of sold stores after March 31, 2014. B/(W) than Q4 2014 (1) (amounts in millions, except per share data) Q4 2015 (1) $ % Revenue $2,452.2849057600197 $105.89419441003957 4.513067405944% Gross Profit $361.406302550031 $13.432342290021014 3.860157317514% SG&A as % of Gross 0.75376008280148254 -,190 bps Operating Profit $71.9378042849183 $-5.2003589355783042 -6.74161623568% Interest & Other $-17.790865309999997 $-0.38893763999999648 -2.235026184315% Pretax $54.146938974919998 $-5.5892965755764017 -9.35662671755% Diluted EPS $0.65 $-0.06 -8.5% Diluted EPS Keyed $0.65 $-0.06 -8.5%
Q4 2015 FINANCIAL REVIEW ECHOPARK® SEGMENT
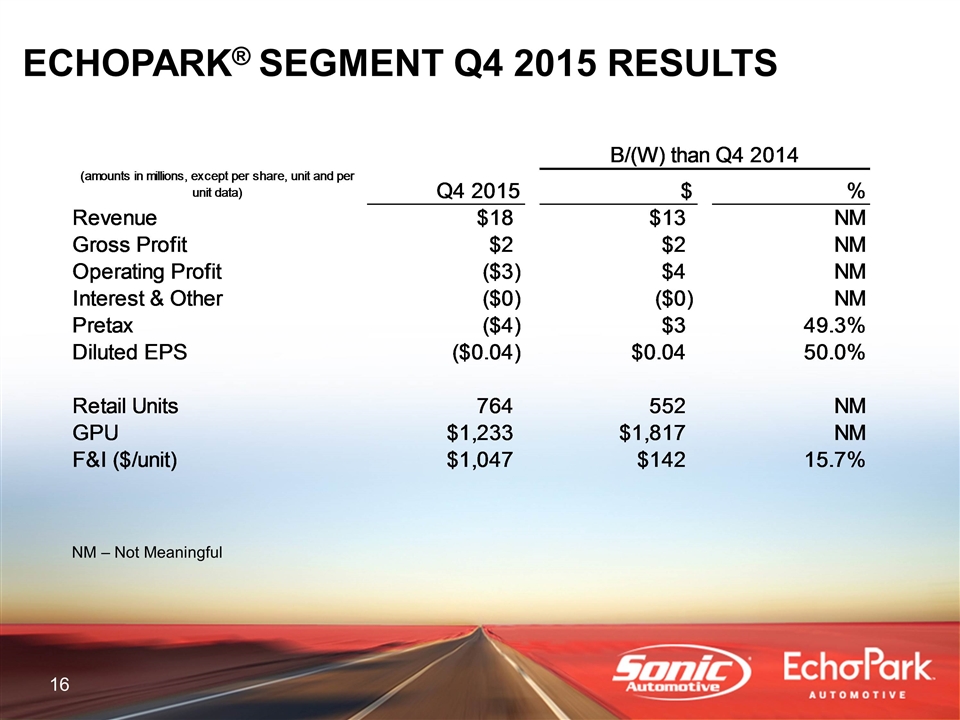
NM – Not Meaningful ECHOPARK® SEGMENT Q4 2015 RESULTS B/(W) than Q4 2014 (amounts in millions, except per share, unit and per unit data) Q4 2015 $ % Revenue $18.350445560000001 $12.912768509999999 NM Gross Profit $2.4416698399999999 $1.9513660800000001 NM Operating Profit $-3.2612278999999904 $3.7459220800000099 NM Interest & Other $-0.32399038000000002 $-0.25761238000000003 NM Pretax $-3.5852182799999901 $3.4883097000000105 0.49314991187749713 Diluted EPS $-0.04 $0.04 0.5 Retail Units 764 552 NM GPU $1,233.391099476465 $1,817.374911834439 NM F&I ($/unit) $1,046.6443586387436 $141.90723599723424 0.15684913600418626 Diluted EPS Keyed $-0.04 $0.04 0.5
Q4 2015 FINANCIAL REVIEW TOTAL ENTERPRISE
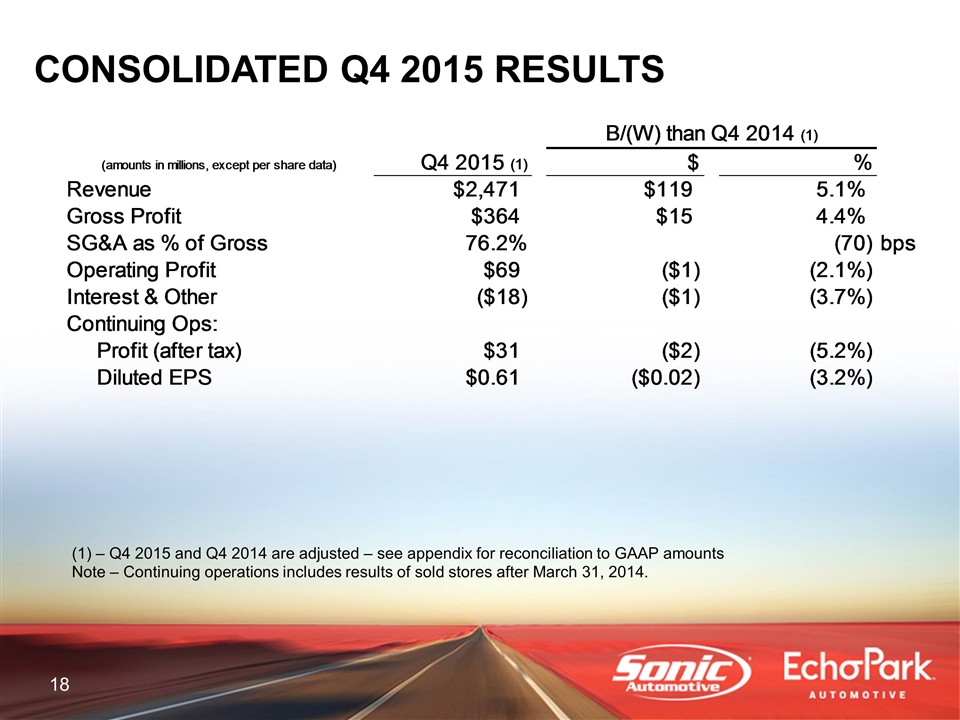
CONSOLIDATED Q4 2015 RESULTS – Q4 2015 and Q4 2014 are adjusted – see appendix for reconciliation to GAAP amounts Note – Continuing operations includes results of sold stores after March 31, 2014. B/(W) than Q4 2014 (1) (amounts in millions, except per share data) Q4 2015 (1) $ % Revenue $2,470.6353513200202 $118.80696292004036 5.516850424137% Gross Profit $363.84797239003098 $15.383708370018983 4.414716215817% SG&A as % of Gross 0.76220077015519572 -70 bps Operating Profit $68.676576384922598 $-1.4544368555716209 -2.738854158346% Interest & Other $-18.114855689999999 $-0.64655001999999873 -3.701274938819% Continuing Ops: Profit (after tax) $30.856128284900798 $-1.6884585555934026 -5.188139471147% Diluted EPS $0.61 $-0.02 -3.2% Diluted EPS Keyed $0.61 $-0.02 -3.2%
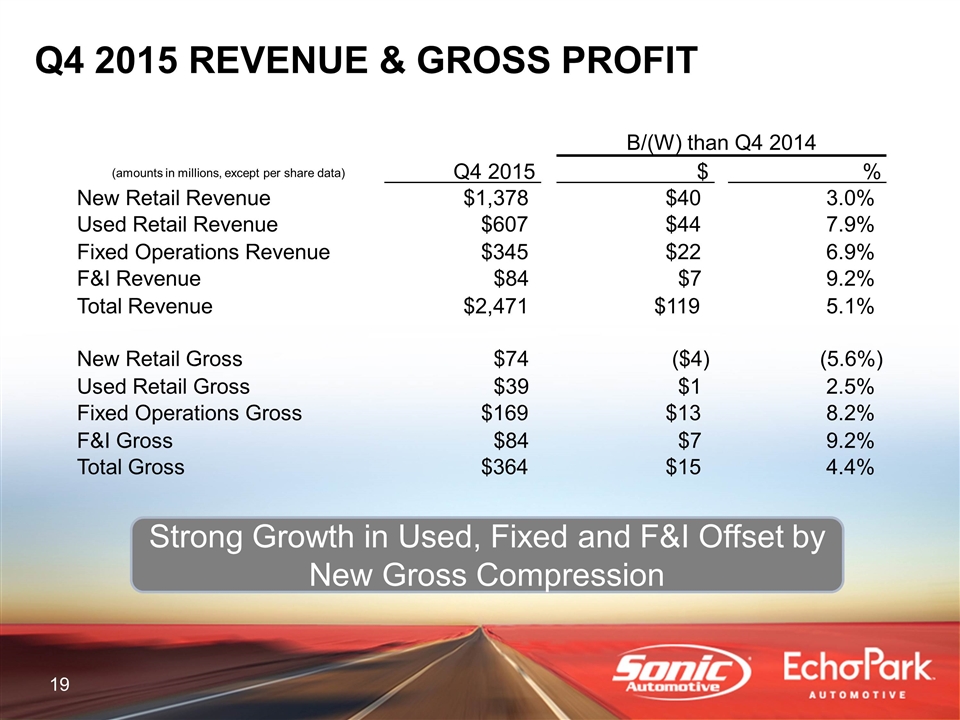
Q4 2015 REVENUE & GROSS PROFIT Strong Growth in Used, Fixed and F&I Offset by New Gross Compression B/(W) than Q4 2014 (amounts in millions, except per share data) Q4 2015 $ % New Retail Revenue $1,378 $40 3.0% Used Retail Revenue $607 $44 7.9% Fixed Operations Revenue $345 $22 6.9% F&I Revenue $84 $7 9.2% Total Revenue $2,471 $119 5.1% New Retail Gross $74 ($4) (5.6%) Used Retail Gross $39 $1 2.5% Fixed Operations Gross $169 $13 8.2% F&I Gross $84 $7 9.2% Total Gross $364 $15 4.4%
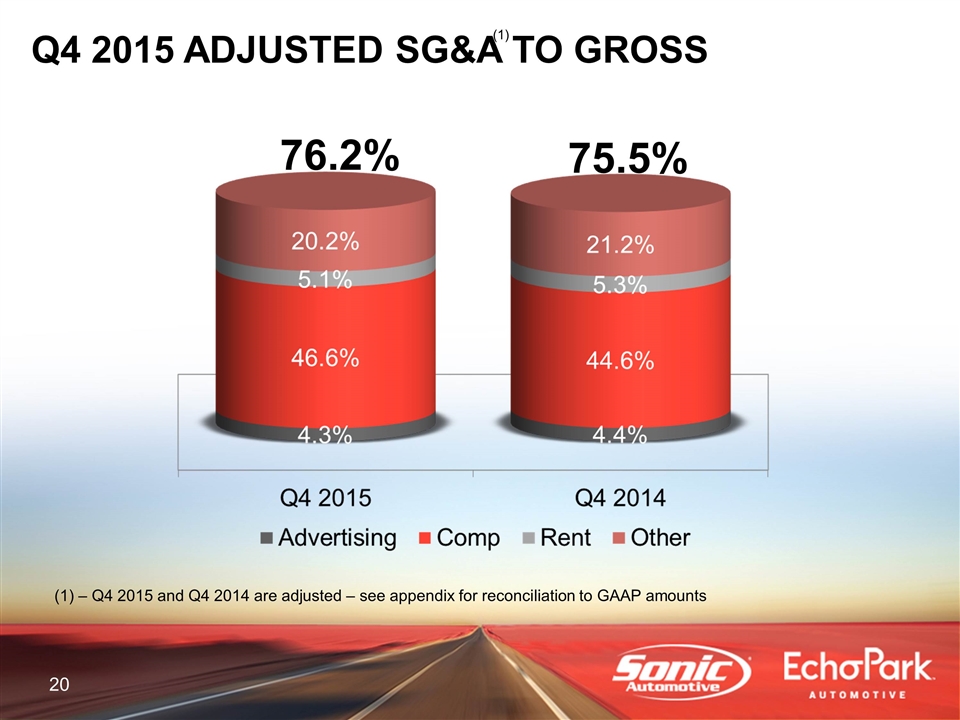
Q4 2015 ADJUSTED SG&A TO GROSS 76.2% 75.5% – Q4 2015 and Q4 2014 are adjusted – see appendix for reconciliation to GAAP amounts
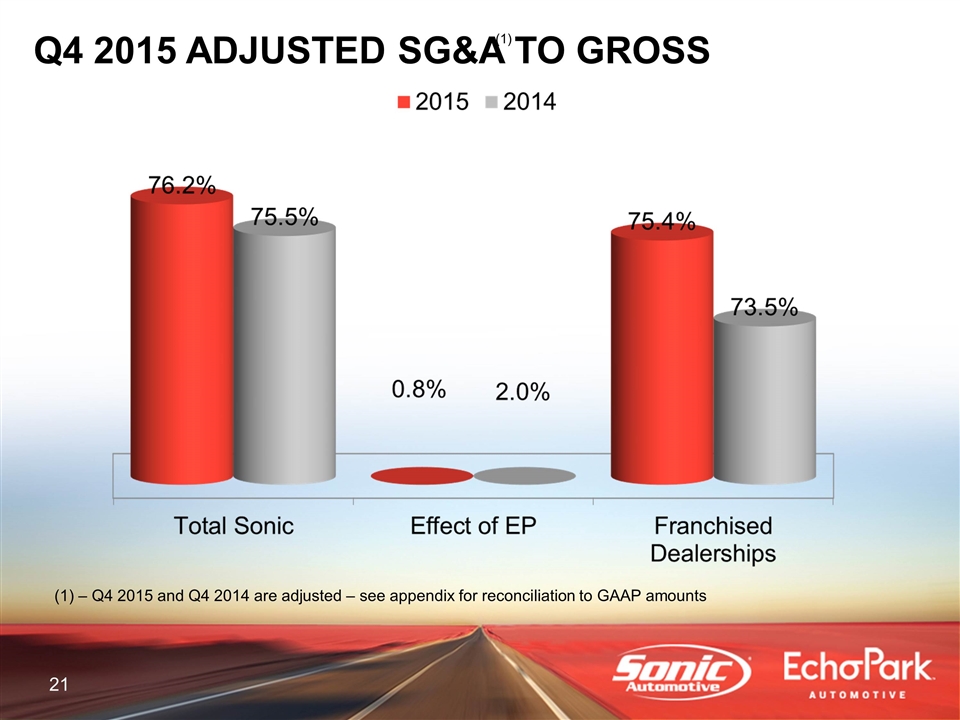
Q4 2015 ADJUSTED SG&A TO GROSS – Q4 2015 and Q4 2014 are adjusted – see appendix for reconciliation to GAAP amounts
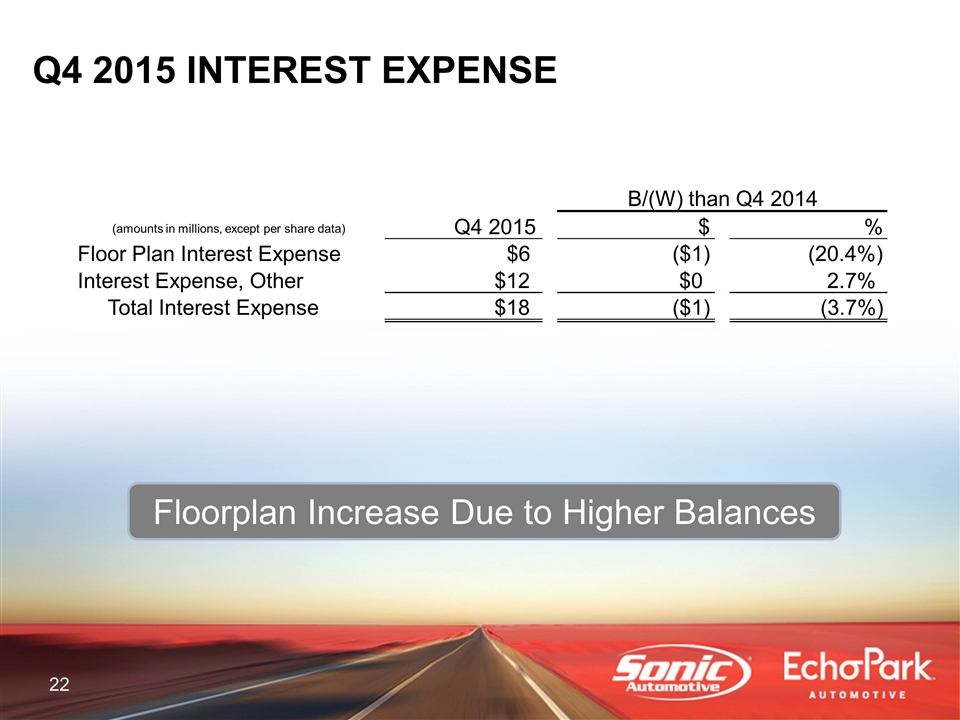
Q4 2015 INTEREST EXPENSE Floorplan Increase Due to Higher Balances B/(W) than Q4 2014 (amounts in millions, except per share data) Q4 2015 $ % Floor Plan Interest Expense $6 ($1) (20.4%) Interest Expense, Other $12 $0 2.7% Total Interest Expense $18 ($1) (3.7%)

FULL YEAR 2015 FINANCIAL REVIEW
FULL YEAR 2015 FINANCIAL REVIEW FRANCHISED SEGMENT
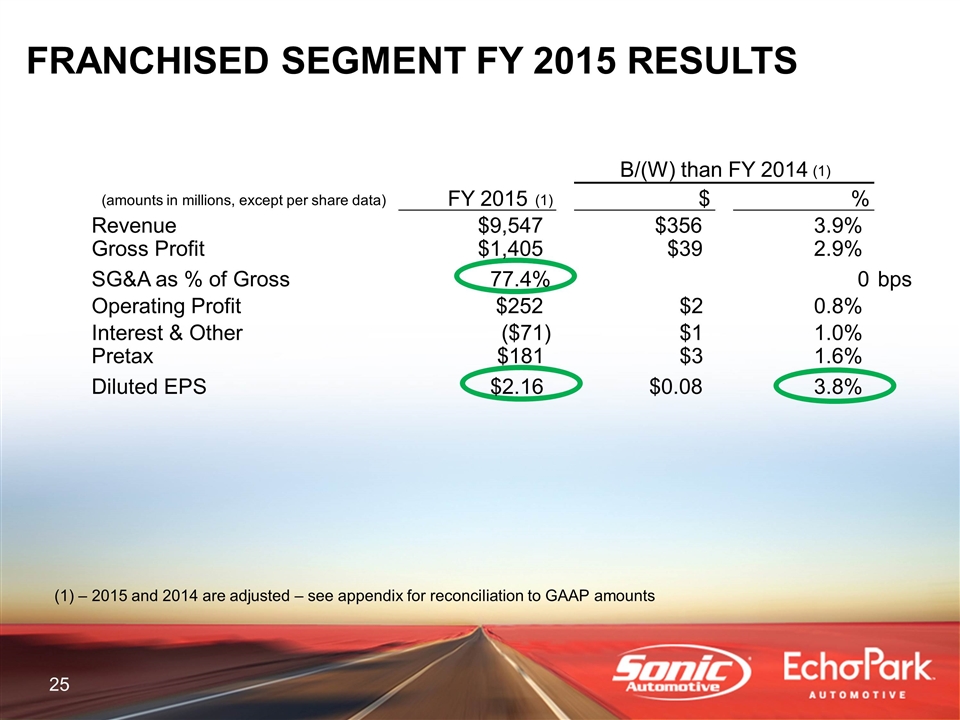
FRANCHISED SEGMENT FY 2015 RESULTS – 2015 and 2014 are adjusted – see appendix for reconciliation to GAAP amounts B/(W) than FY 2014 (1) (amounts in millions, except per share data) FY 2015 (1) $ % Revenue $9,547 $356 3.9% Gross Profit $1,405 $39 2.9% SG&A as % of Gross 77.4% 0 bps Operating Profit $252 $2 0.8% Interest & Other ($71) $1 1.0% Pretax $181 $3 1.6% Diluted EPS $2.16 $0.08 3.8%

FULL YEAR 2015 FINANCIAL REVIEW ECHOPARK® SEGMENT
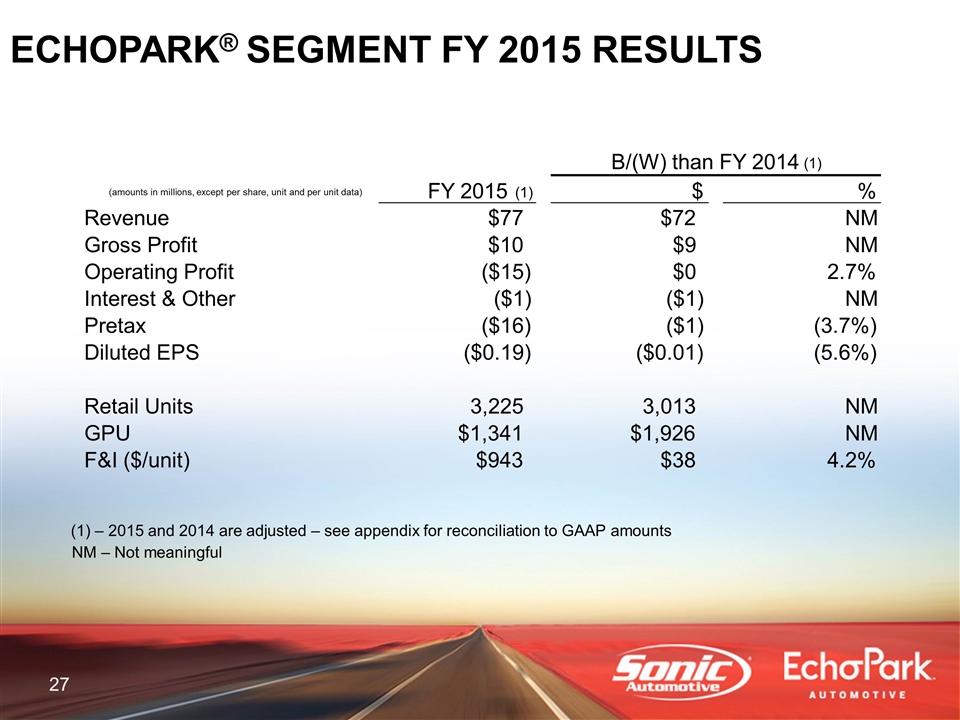
NM – Not meaningful ECHOPARK® SEGMENT FY 2015 RESULTS – 2015 and 2014 are adjusted – see appendix for reconciliation to GAAP amounts B/(W) than FY 2014 (1) (amounts in millions, except per share, unit and per unit data) FY 2015 (1) $ % Revenue $77 $72 NM Gross Profit $10 $9 NM Operating Profit ($15) $0 2.7% Interest & Other ($1) ($1) NM Pretax ($16) ($1) (3.7%) Diluted EPS ($0.19) ($0.01) (5.6%) Retail Units 3,225 3,013 NM GPU $1,341 $1,926 NM F&I ($/unit) $943 $38 4.2%
FULL YEAR 2015 FINANCIAL REVIEW TOTAL ENTERPRISE
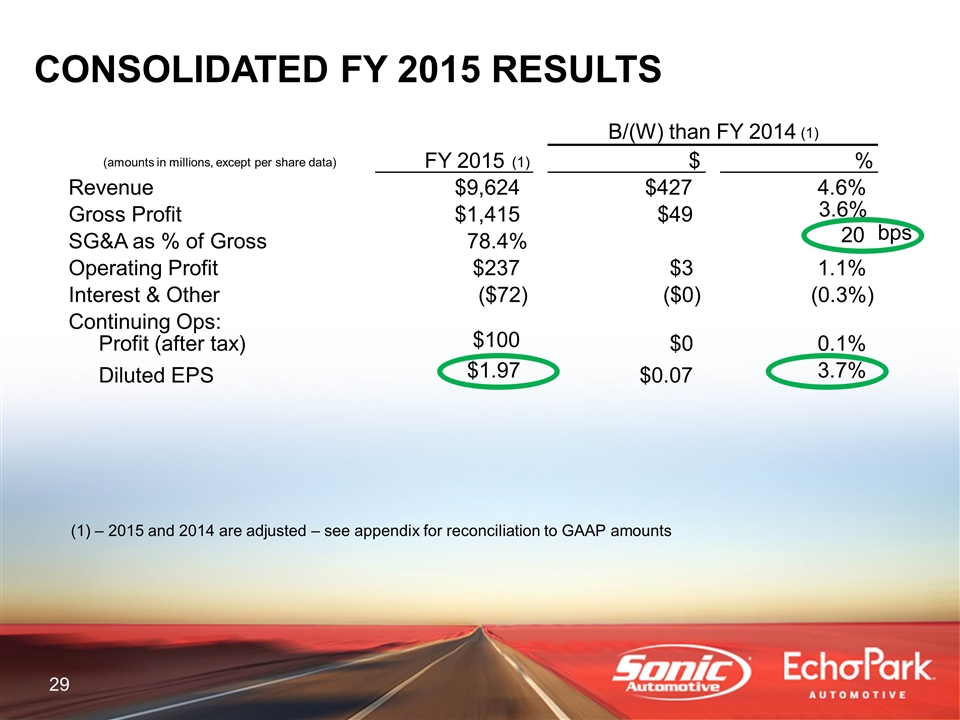
CONSOLIDATED FY 2015 RESULTS – 2015 and 2014 are adjusted – see appendix for reconciliation to GAAP amounts B/(W) than FY 2014 (1) (amounts in millions, except per share data) FY 2015 (1) $ % Revenue $9,624 $427 4.6% Gross Profit $1,415 $49 3.6% SG&A as % of Gross 78.4% 20 bps Operating Profit $237 $3 1.1% Interest & Other ($72) ($0) (0.3%) Continuing Ops: Profit (after tax) $100 $0 0.1% Diluted EPS $1.97 $0.07 3.7%
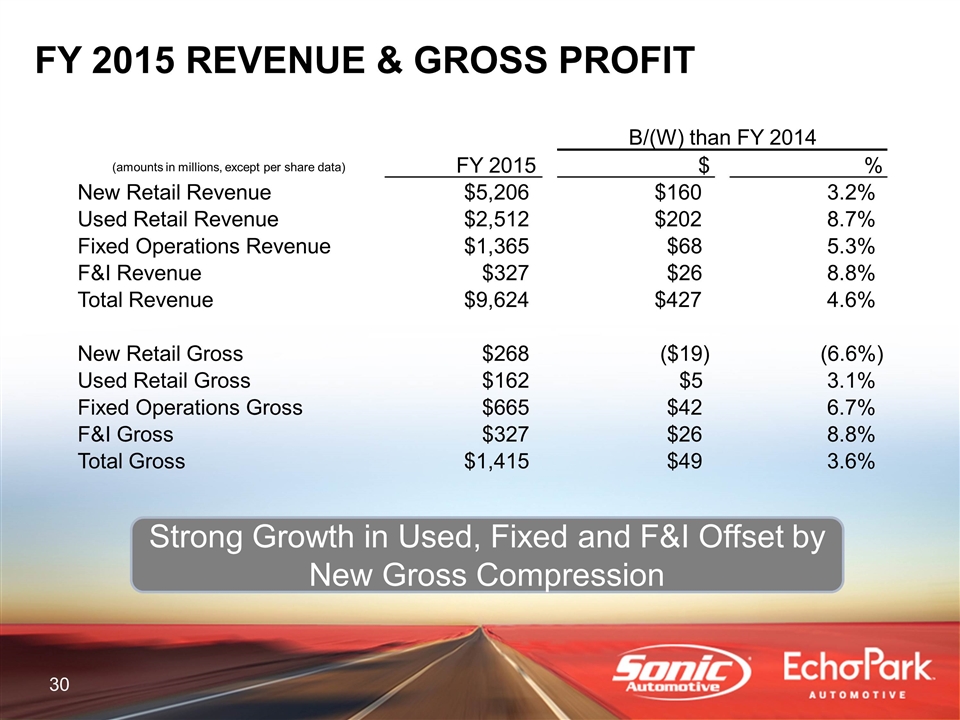
FY 2015 REVENUE & GROSS PROFIT Strong Growth in Used, Fixed and F&I Offset by New Gross Compression B/(W) than FY 2014 (amounts in millions, except per share data) FY 2015 $ % New Retail Revenue $5,206 $160 3.2% Used Retail Revenue $2,512 $202 8.7% Fixed Operations Revenue $1,365 $68 5.3% F&I Revenue $327 $26 8.8% Total Revenue $9,624 $427 4.6% New Retail Gross $268 ($19) (6.6%) Used Retail Gross $162 $5 3.1% Fixed Operations Gross $665 $42 6.7% F&I Gross $327 $26 8.8% Total Gross $1,415 $49 3.6%
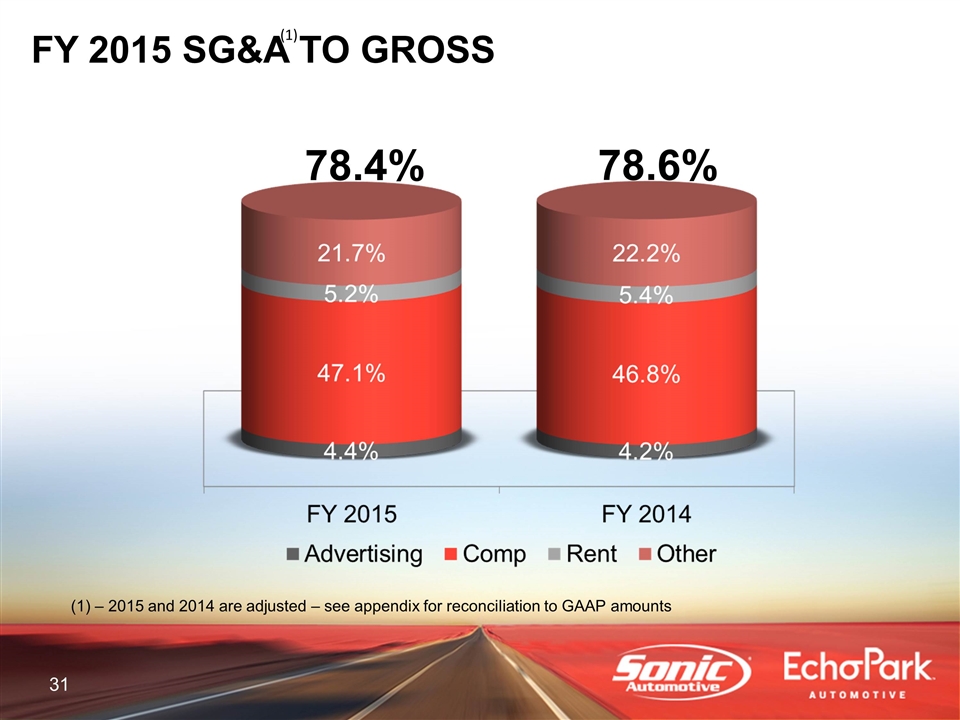
FY 2015 SG&A TO GROSS 78.4% 78.6% – 2015 and 2014 are adjusted – see appendix for reconciliation to GAAP amounts
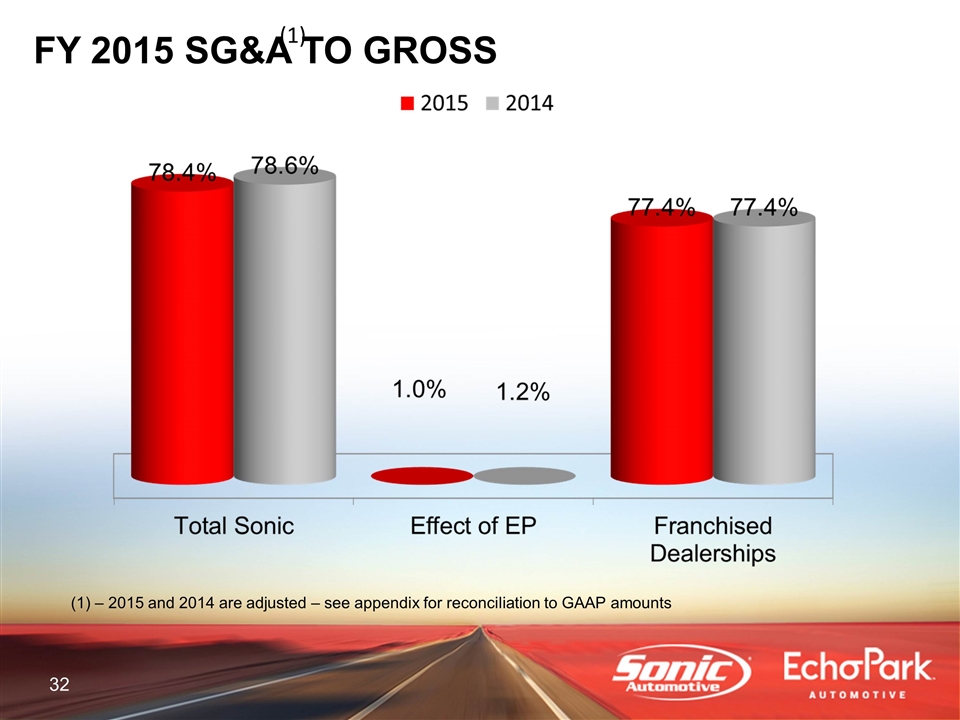
FY 2015 SG&A TO GROSS – 2015 and 2014 are adjusted – see appendix for reconciliation to GAAP amounts
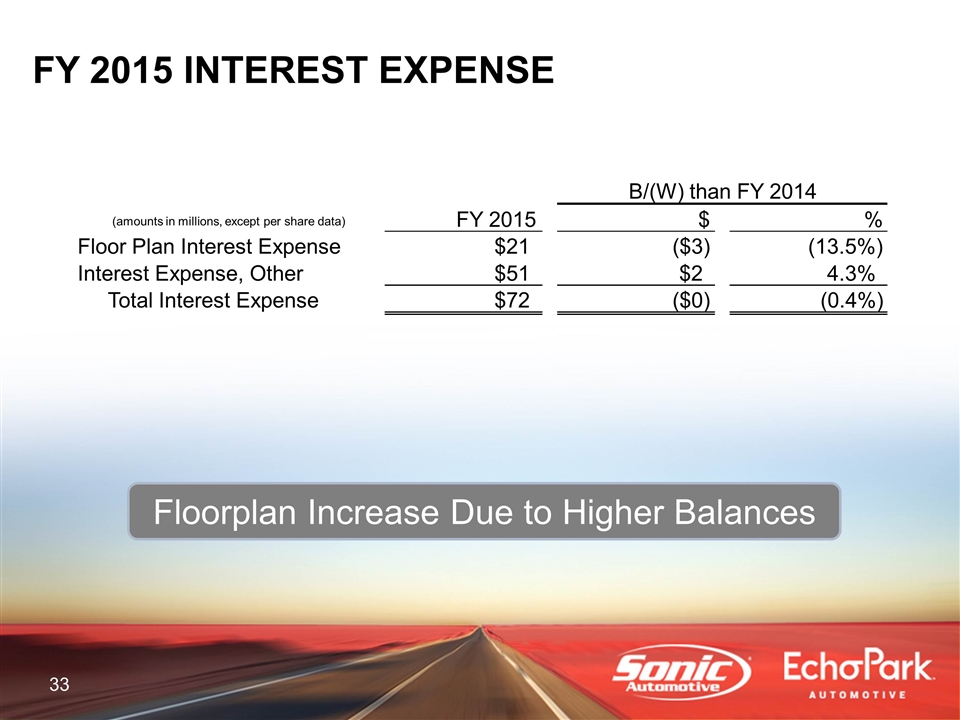
FY 2015 INTEREST EXPENSE Floorplan Increase Due to Higher Balances B/(W) than FY 2014 (amounts in millions, except per share data) FY 2015 $ % Floor Plan Interest Expense $21 ($3) (13.5%) Interest Expense, Other $51 $2 4.3% Total Interest Expense $72 ($0) (0.4%)
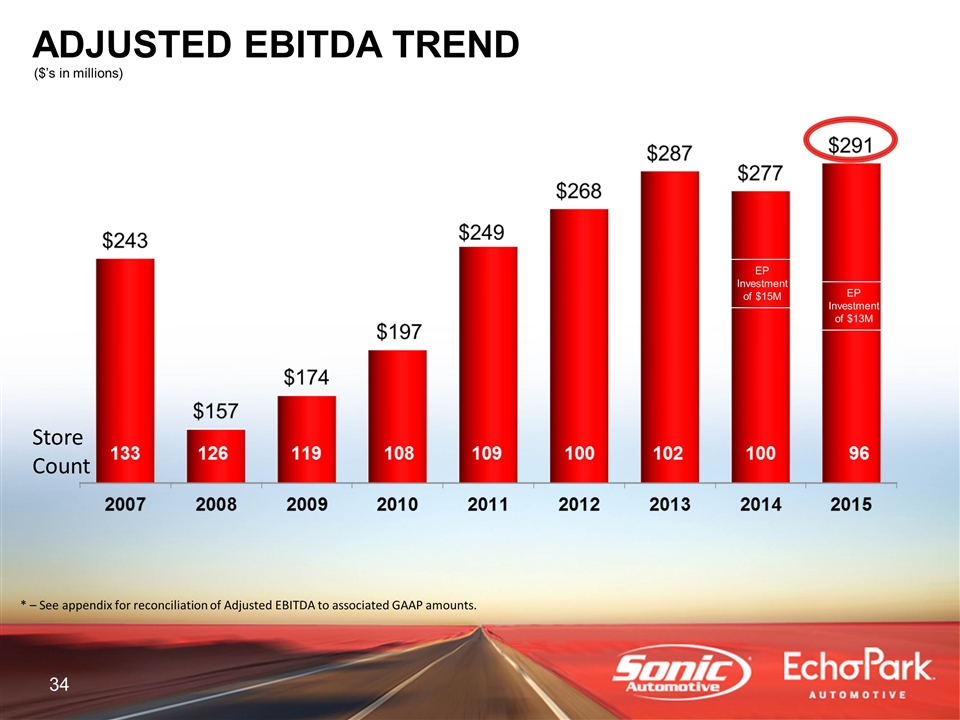
($’s in millions) * – See appendix for reconciliation of Adjusted EBITDA to associated GAAP amounts. ADJUSTED EBITDA TREND EP Investment of $15M EP Investment of $13M Store Count
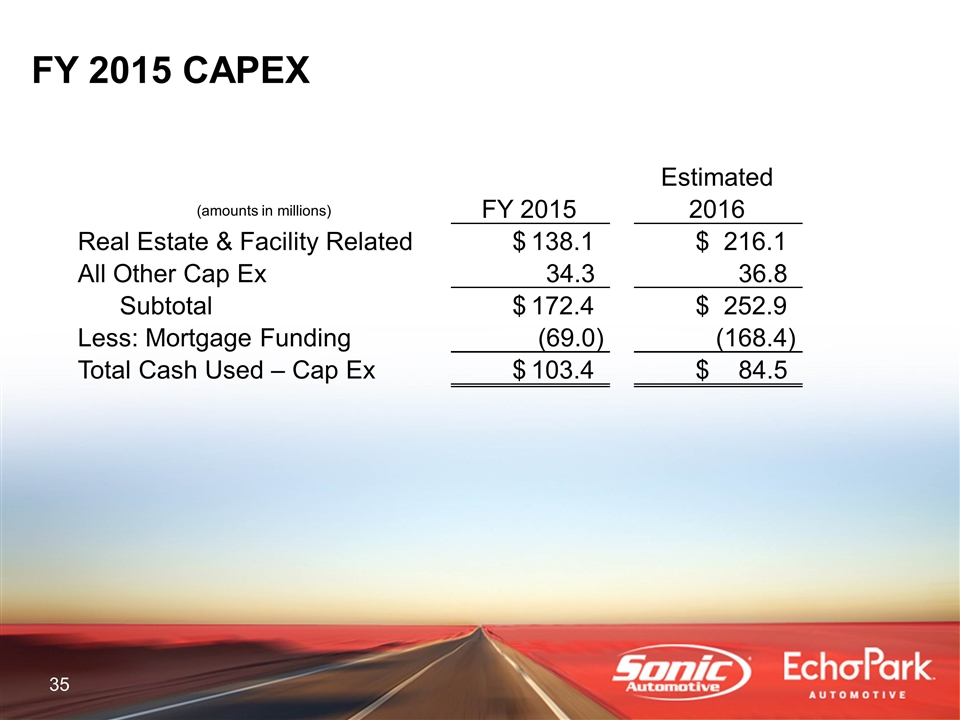
FY 2015 CAPEX (amounts in millions) FY 2015 Estimated 2016 Real Estate & Facility Related 138.1 $ 216.1 $ All Other Cap Ex 34.3 36.8 Subtotal 172.4 $ 252.9 $ Less: Mortgage Funding (69.0) (168.4) Total Cash Used – Cap Ex 103.4 $ 84.5 $
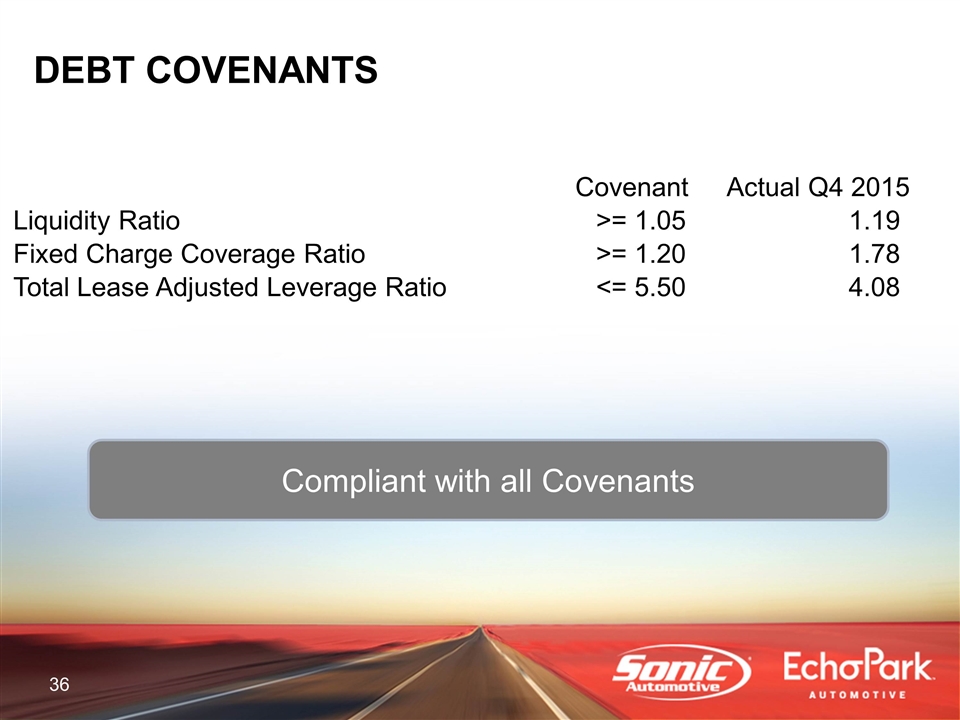
DEBT COVENANTS Compliant with all Covenants Covenant Actual Q4 2015 Liquidity Ratio >= 1.05 1.19 Fixed Charge Coverage Ratio >= 1.20 1.78 Total Lease Adjusted Leverage Ratio <= 5.50 4.08
OPERATIONS REVIEW
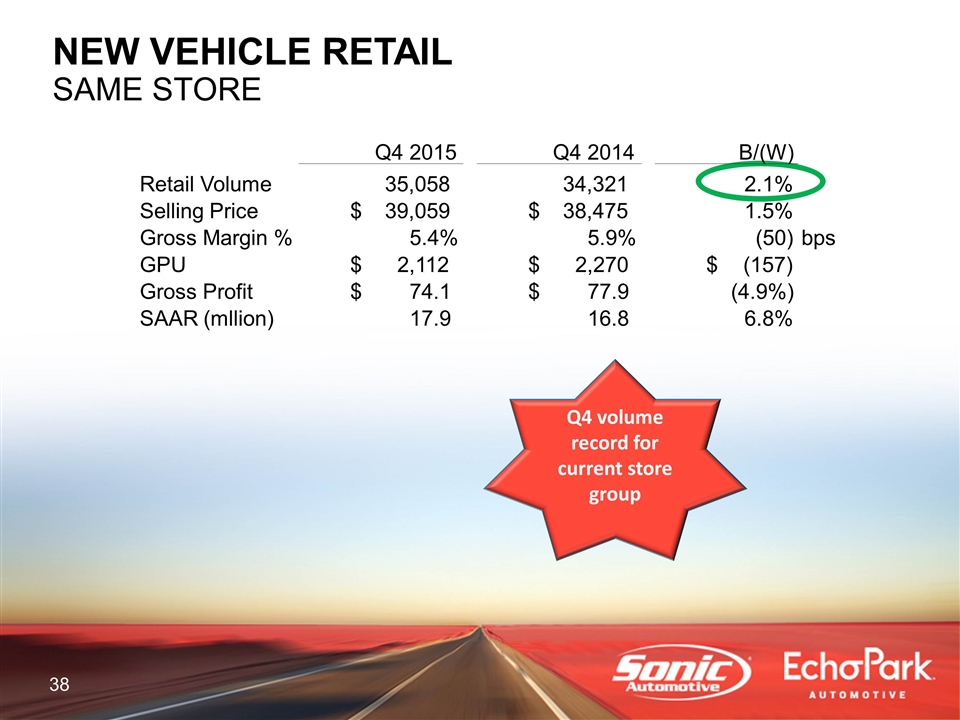
NEW VEHICLE RETAIL SAME STORE Q4 volume record for current store group Q4 2015 Q4 2014 B/(W) Retail Volume 35,058 34,321 2.1% Selling Price 39,059 $ 38,475 $ 1.5% Gross Margin % 5.4% 5.9% (50) bps GPU 2,112 $ 2,270 $ (157) $ Gross Profit 74.1 $ 77.9 $ (4.9%) SAAR (mllion) 17.9 16.8 6.8%
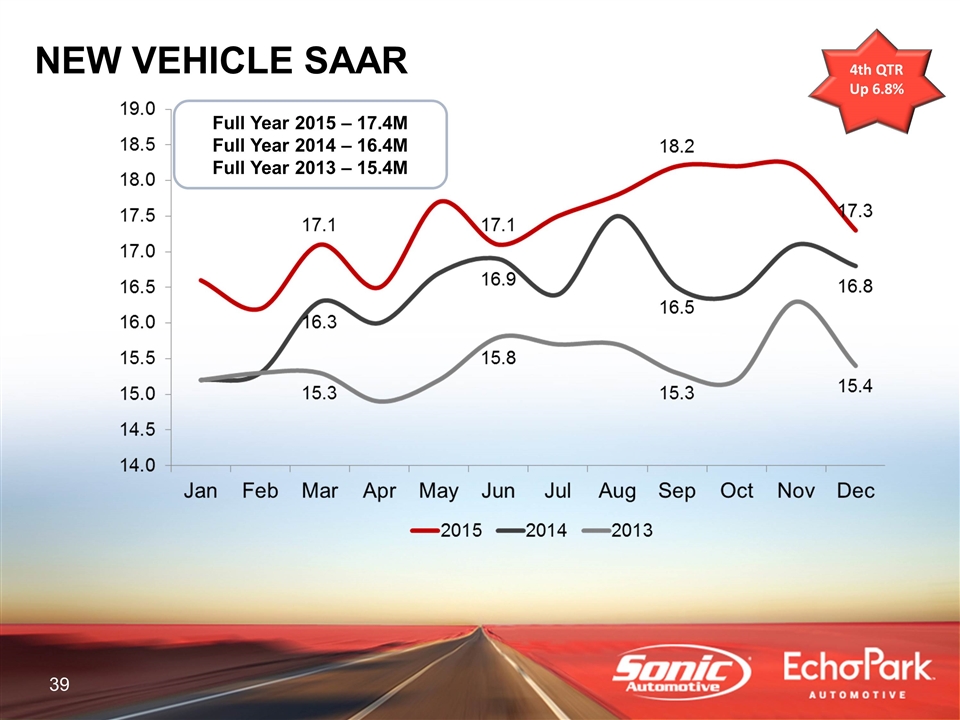
NEW VEHICLE SAAR 4th QTR Up 6.8% Full Year 2015 – 17.4M Full Year 2014 – 16.4M Full Year 2013 – 15.4M
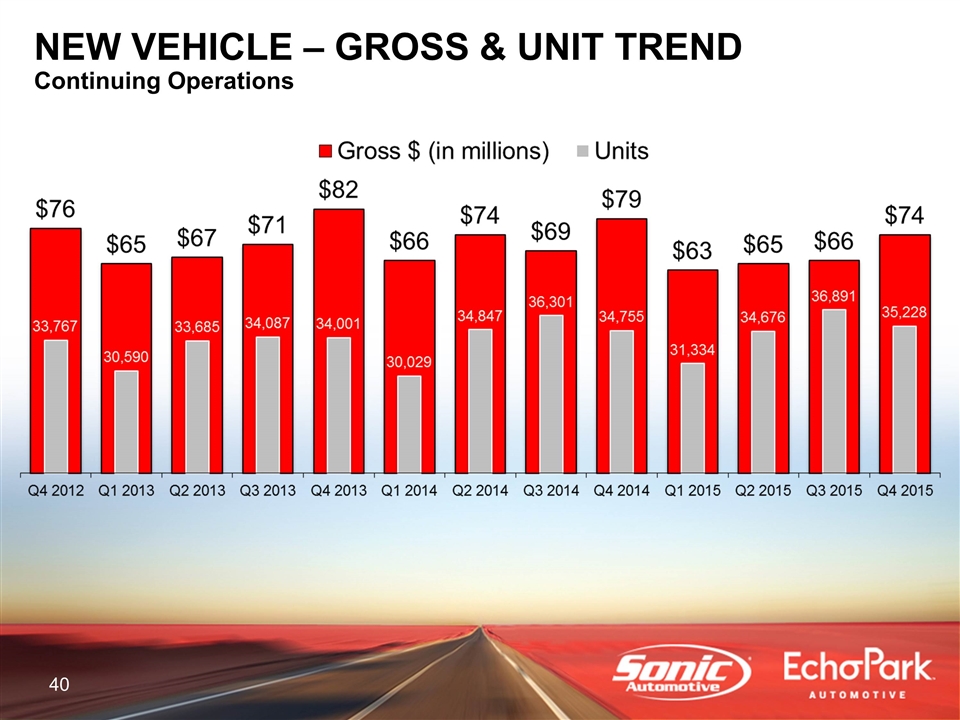
NEW VEHICLE NEW VEHICLE – GROSS & UNIT TREND Continuing Operations
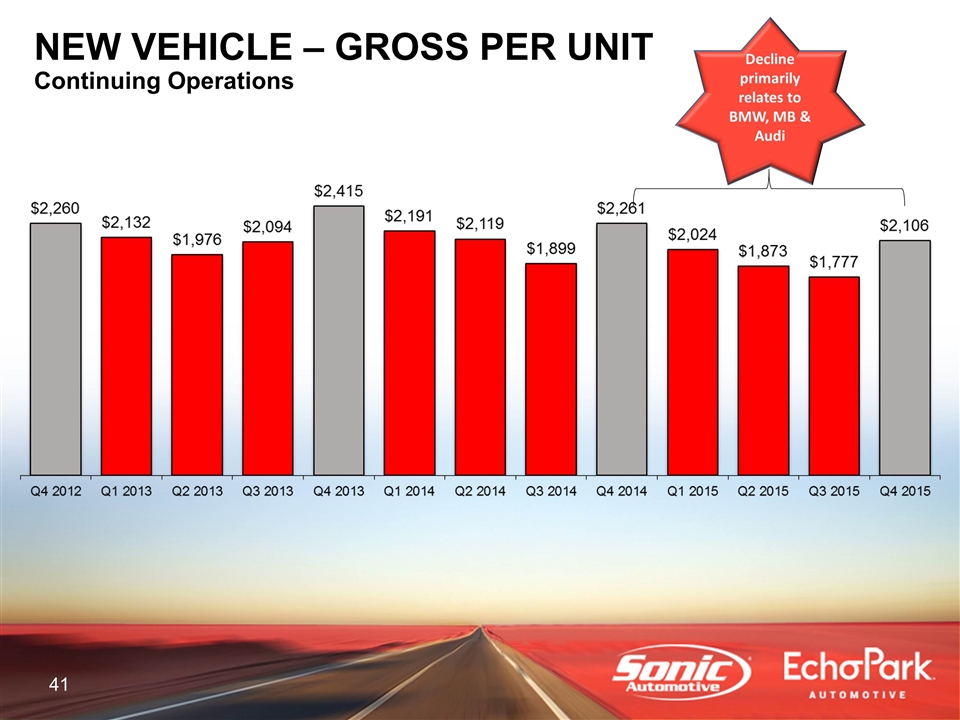
NEW VEHICLE NEW VEHICLE – GROSS PER UNIT Continuing Operations Decline primarily relates to BMW, MB & Audi
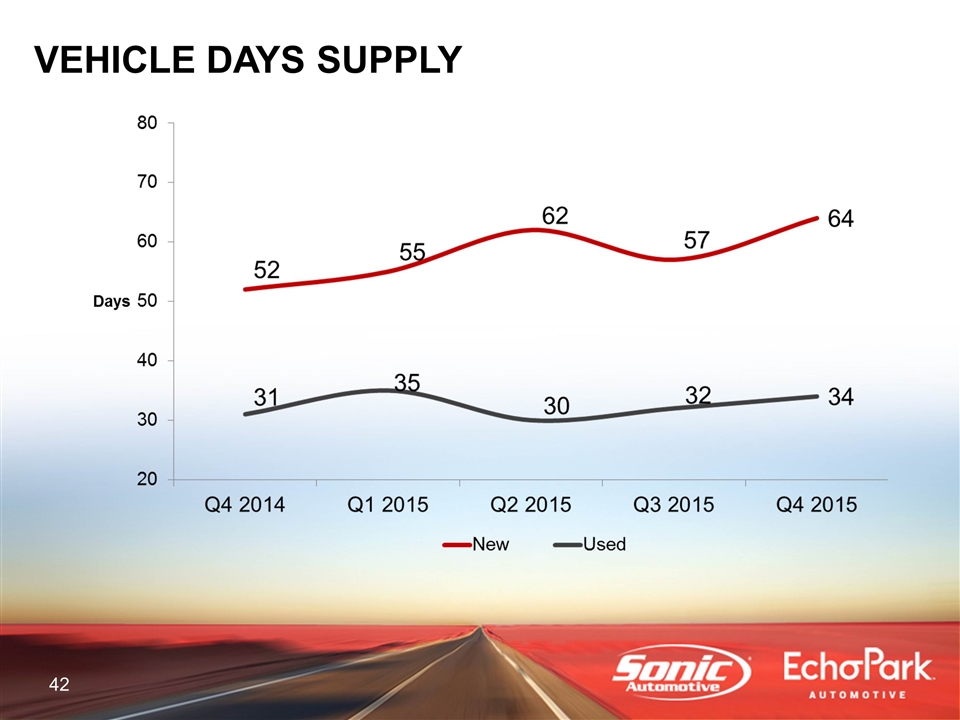
VEHICLE DAYS SUPPLY
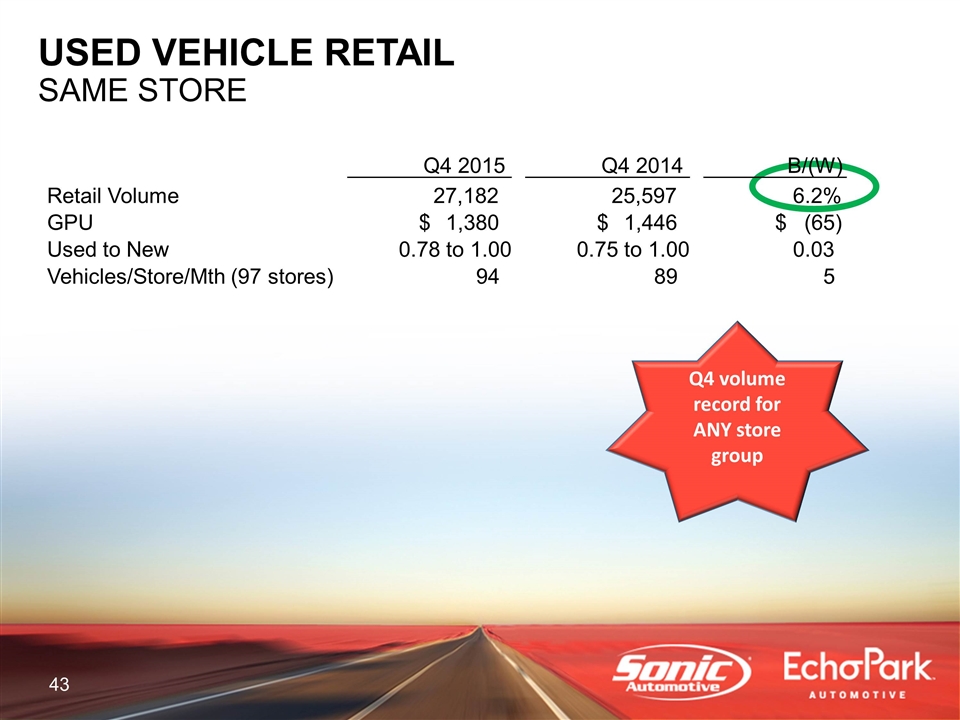
USED VEHICLE RETAIL SAME STORE Q4 volume record for ANY store group Q4 2015 Q4 2014 B/(W) Retail Volume 27,182 25,597 6.2% GPU 1,380 $ 1,446 $ (65) $ Used to New 0.78 to 1.00 0.75 to 1.00 0.03 Vehicles/Store/Mth (97 stores) 94 89 5
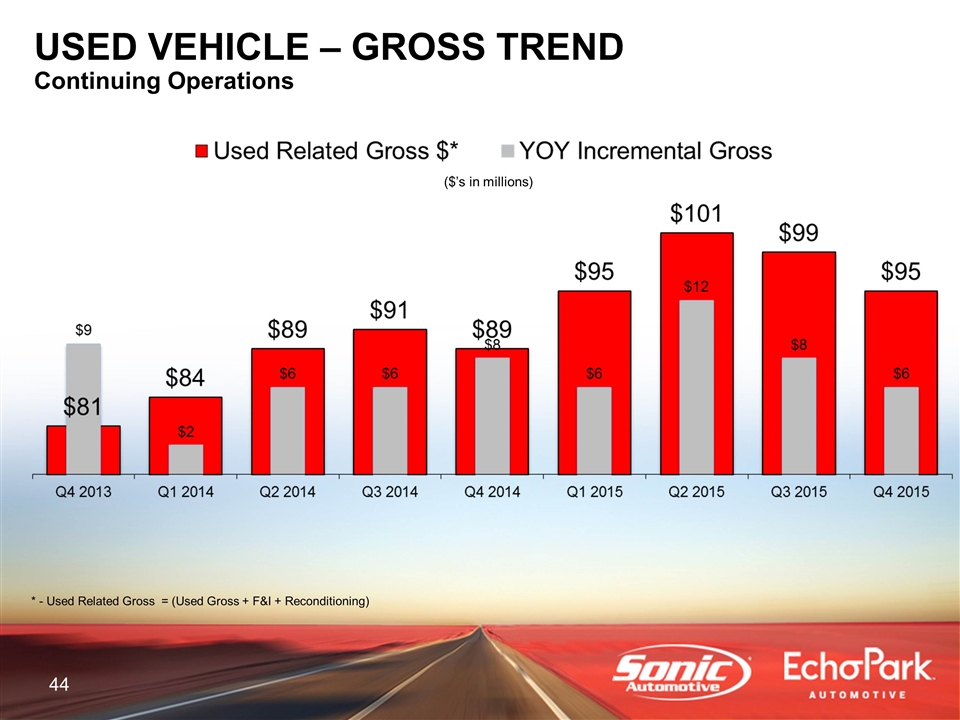
PRE-OWNED * - Used Related Gross = (Used Gross + F&I + Reconditioning) ($’s in millions) USED VEHICLE – GROSS TREND Continuing Operations
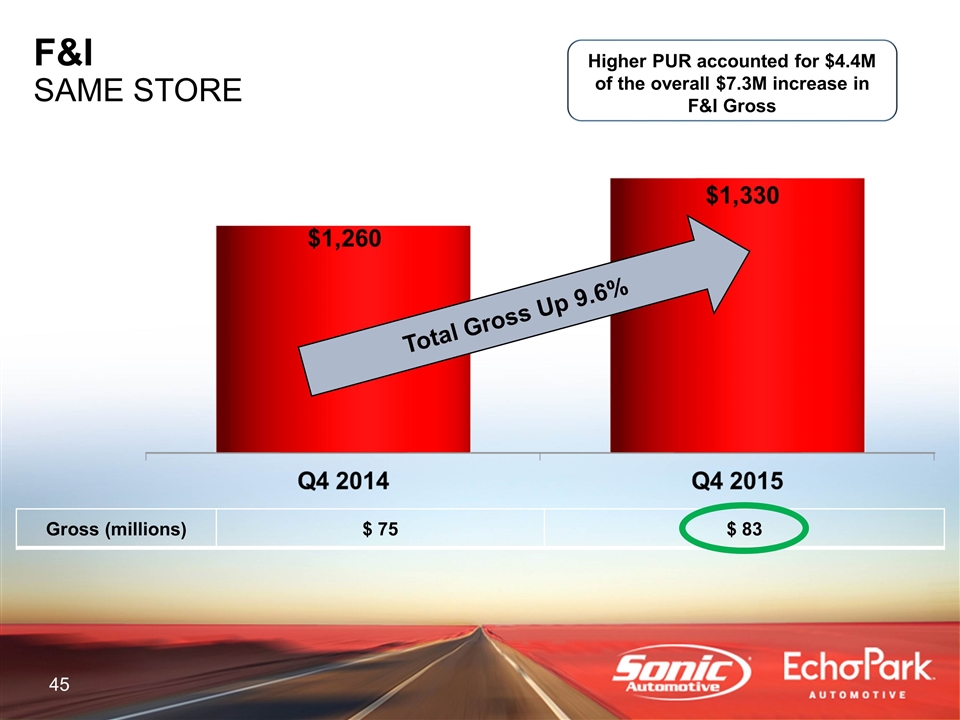
Total Gross Up 9.6% Higher PUR accounted for $4.4M of the overall $7.3M increase in F&I Gross Gross (millions) $ 75 $ 83 F&I SAME STORE
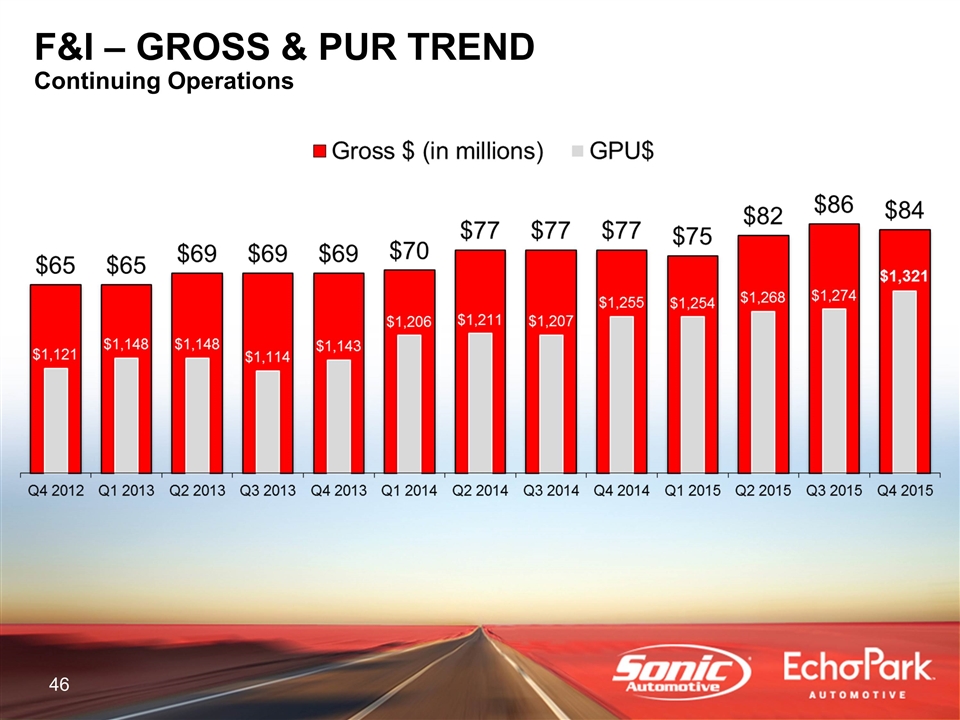
F&I F&I – GROSS & PUR TREND Continuing Operations
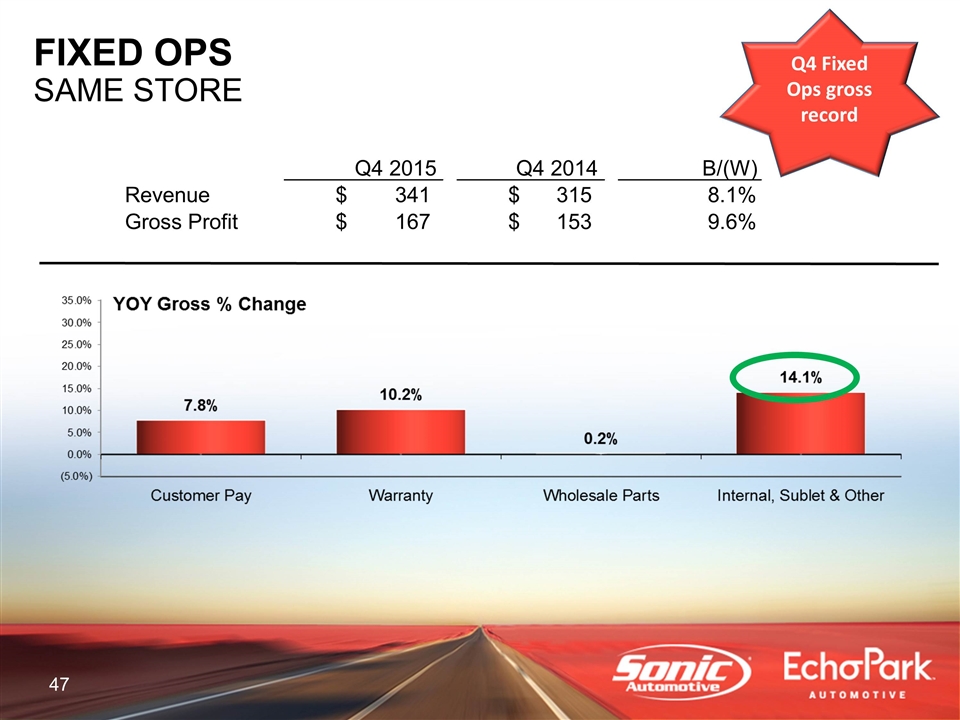
FIXED OPS SAME STORE Q4 Fixed Ops gross record Q4 2015 Q4 2014 B/(W) Revenue 341 $ 315 $ 8.1% Gross Profit 167 $ 153 $ 9.6%
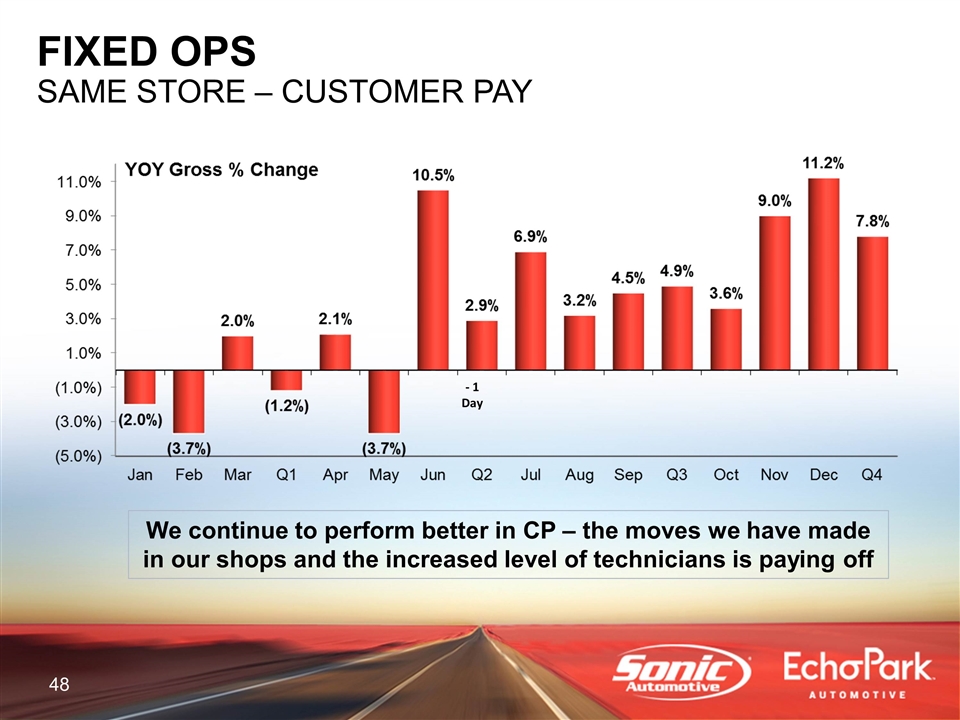
FIXED OPS SAME STORE – CUSTOMER PAY We continue to perform better in CP – the moves we have made in our shops and the increased level of technicians is paying off - 1 Day
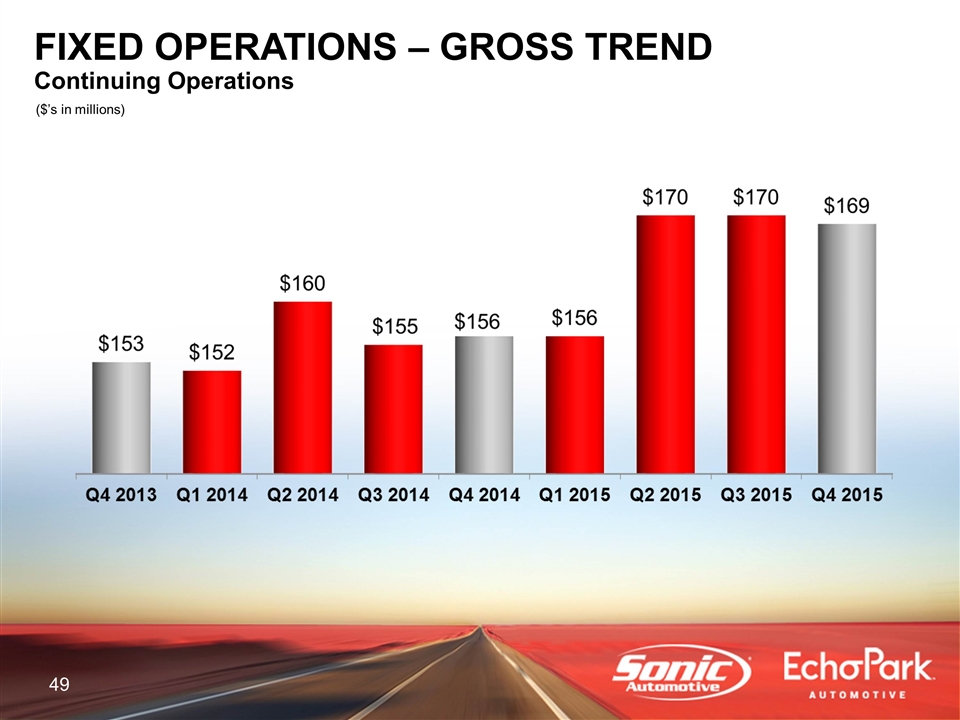
FIXED OPERATIONS ($’s in millions) FIXED OPERATIONS – GROSS TREND Continuing Operations
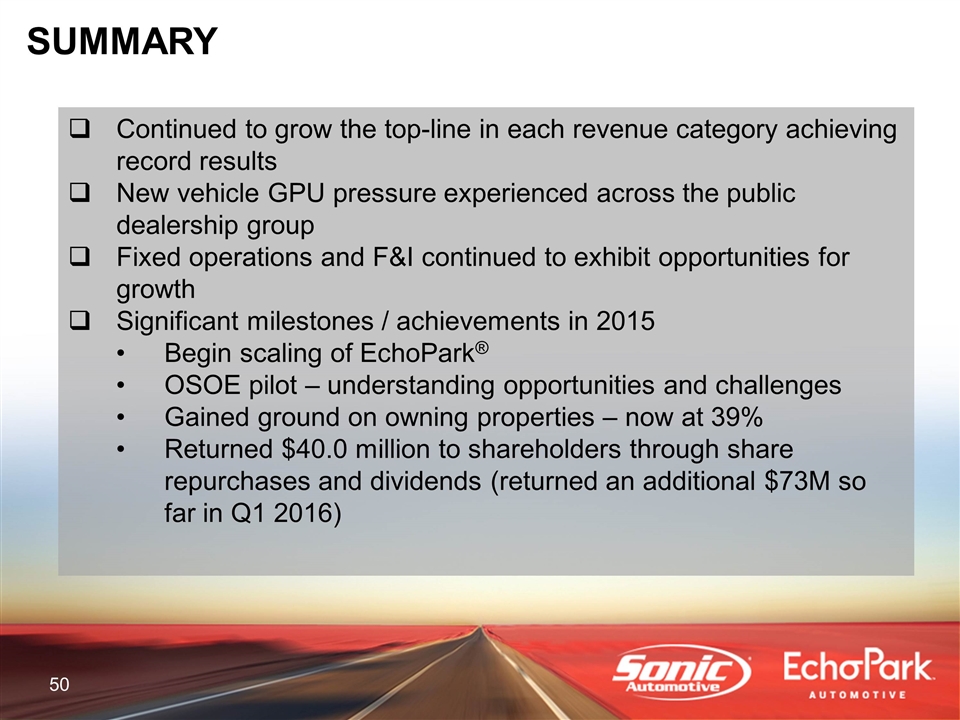
Continued to grow the top-line in each revenue category achieving record results New vehicle GPU pressure experienced across the public dealership group Fixed operations and F&I continued to exhibit opportunities for growth Significant milestones / achievements in 2015 Begin scaling of EchoPark® OSOE pilot – understanding opportunities and challenges Gained ground on owning properties – now at 39% Returned $40.0 million to shareholders through share repurchases and dividends (returned an additional $73M so far in Q1 2016) SUMMARY
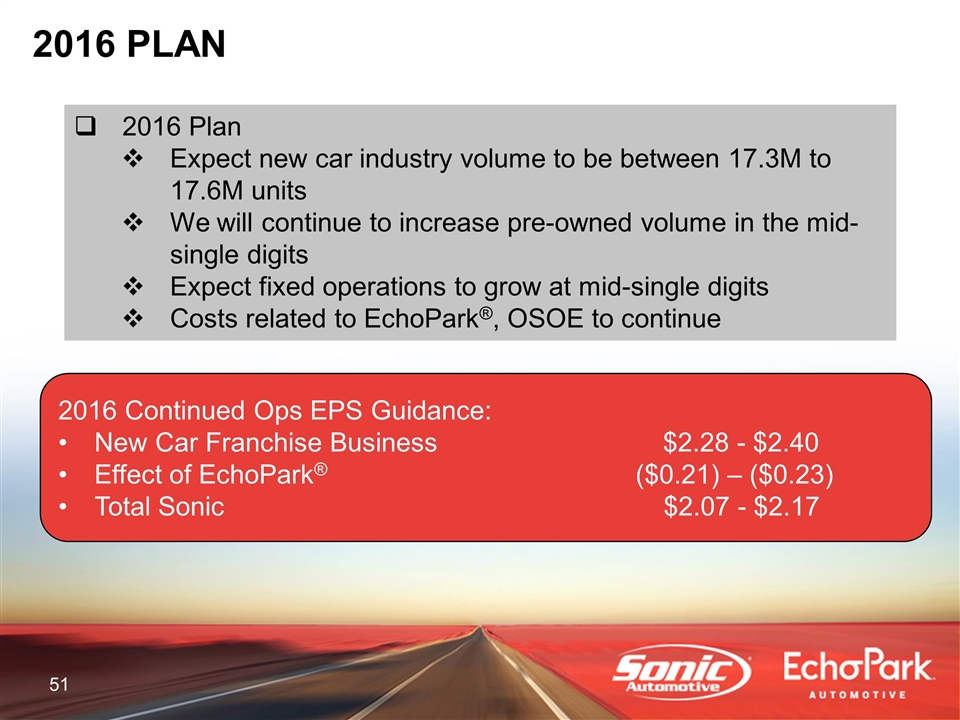
2016 PLAN 2016 Plan Expect new car industry volume to be between 17.3M to 17.6M units We will continue to increase pre-owned volume in the mid-single digits Expect fixed operations to grow at mid-single digits Costs related to EchoPark®, OSOE to continue 2016 Continued Ops EPS Guidance: New Car Franchise Business $2.28 - $2.40 Effect of EchoPark® ($0.21) – ($0.23) Total Sonic $2.07 - $2.17

APPENDIX
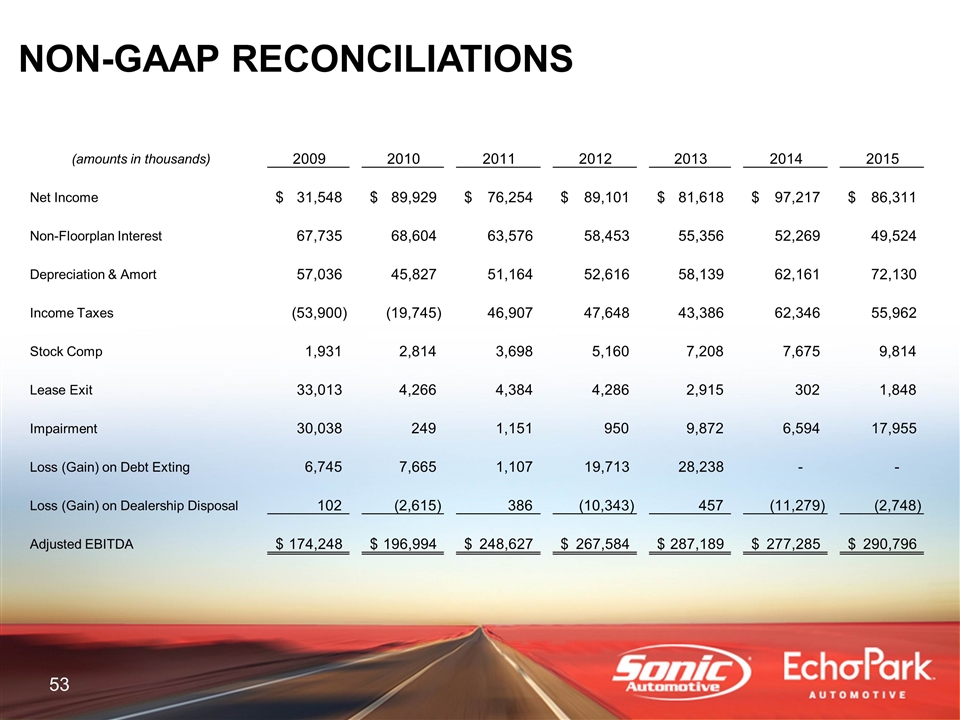
NON-GAAP RECONCILIATIONS (amounts in thousands) 2009 2010 2011 2012 2013 2014 2015 Net Income 31,548 $ 89,929 $ 76,254 $ 89,101 $ 81,618 $ 97,217 $ 86,311 $ Non-Floorplan Interest 67,735 68,604 63,576 58,453 55,356 52,269 49,524 Depreciation & Amort 57,036 45,827 51,164 52,616 58,139 62,161 72,130 Income Taxes (53,900) (19,745) 46,907 47,648 43,386 62,346 55,962 Stock Comp 1,931 2,814 3,698 5,160 7,208 7,675 9,814 Lease Exit 33,013 4,266 4,384 4,286 2,915 302 1,848 Impairment 30,038 249 1,151 950 9,872 6,594 17,955 Loss (Gain) on Debt Exting 6,745 7,665 1,107 19,713 28,238 - - Loss (Gain) on Dealership Disposal 102 (2,615) 386 (10,343) 457 (11,279) (2,748) Adjusted EBITDA 174,248 $ 196,994 $ 248,627 $ 267,584 $ 287,189 $ 277,285 $ 290,796 $
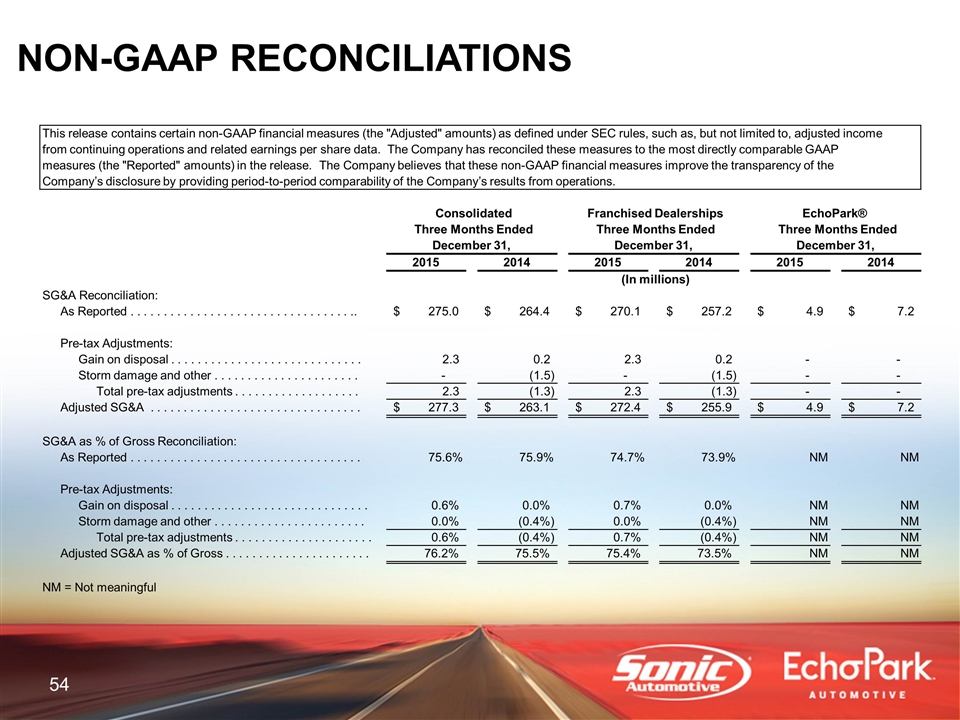
NON-GAAP RECONCILIATIONS Consolidated Franchised Dealerships EchoPark® Three Months Ended Three Months Ended Three Months Ended December 31, December 31, December 31, 2015 2014 2015 2014 2015 2014 (In millions) SG&A Reconciliation: As Reported . . . . . . . . . . . .. . . . . . . . . . . . . . . . . . . . . . .. 275.0 $ 264.4 $ 270.1 $ 257.2 $ 4.9 $ 7.2 $ Pre-tax Adjustments: Gain on disposal . . . . . . . . . . . . . . . . . . . . . . . . . . . . . 2.3 0.2 2.3 0.2 - - Storm damage and other . . . . . . . . . . .. . . . . . . . . . . . - (1.5) - (1.5) - - Total pre-tax adjustments . . . . . . . . . . . . . . . . . . . 2.3 (1.3) 2.3 (1.3) - - Adjusted SG&A . . . . . . . . . . . . . . . . . . . . . . . . . . . . . . . . 277.3 $ 263.1 $ 272.4 $ 255.9 $ 4.9 $ 7.2 $ SG&A as % of Gross Reconciliation: As Reported . . . . . . . . . . . . . . . . . . . . . . . . . . . . . . . . . . . 75.6% 75.9% 74.7% 73.9% NM NM Pre-tax Adjustments: Gain on disposal . . . . . . . . . . . . . . . . . . . . . . . . . . .. . . . 0.6% 0.0% 0.7% 0.0% NM NM Storm damage and other . . . . . . . . . . . . . . . . . . . . . . . 0.0% (0.4%) 0.0% (0.4%) NM NM Total pre-tax adjustments . . . . . . . . . . . . . . . . . . . . . 0.6% (0.4%) 0.7% (0.4%) NM NM Adjusted SG&A as % of Gross . . . . . . . . . . . . . . . . . . . . . . 76.2% 75.5% 75.4% 73.5% NM NM NM = Not meaningful This release contains certain non-GAAP financial measures (the "Adjusted" amounts) as defined under SEC rules, such as, but not limited to, adjusted income from continuing operations and related earnings per share data. The Company has reconciled these measures to the most directly comparable GAAP measures (the "Reported" amounts) in the release. The Company believes that these non-GAAP financial measures improve the transparency of the Company’s disclosure by providing period-to-period comparability of the Company’s results from operations.
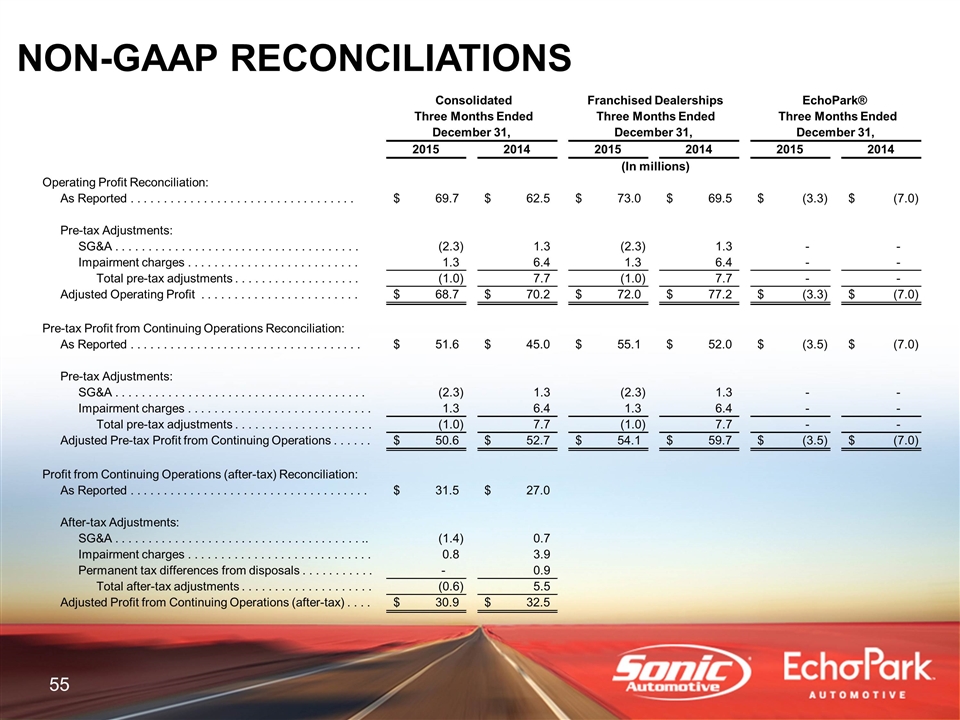
NON-GAAP RECONCILIATIONS Consolidated Franchised Dealerships EchoPark® Three Months Ended Three Months Ended Three Months Ended December 31, December 31, December 31, 2015 2014 2015 2014 2015 2014 (In millions) Operating Profit Reconciliation: As Reported . . . . . . . .. . . . . . . . . . . . . . . . . . . . . . . . . . . 69.7 $ 62.5 $ 73.0 $ 69.5 $ (3.3) $ (7.0) $ Pre-tax Adjustments: SG&A . . . . . . . . . . . . . . . . . . . . . . . . . . . . . . . . . . . . . (2.3) 1.3 (2.3) 1.3 - - Impairment charges . . .. . . . . . . . . . . . . . . . . . . . . . . . 1.3 6.4 1.3 6.4 - - Total pre-tax adjustments . . . . . . . . . . . . . . . . . . . (1.0) 7.7 (1.0) 7.7 - - Adjusted Operating Profit . . . . . . . . . . . . . . . . . . . . . . . . 68.7 $ 70.2 $ 72.0 $ 77.2 $ (3.3) $ (7.0) $ Pre-tax Profit from Continuing Operations Reconciliation: As Reported . . . . . . . . . . . . . . . . . . . . . . . . . . . . . . . . . . . 51.6 $ 45.0 $ 55.1 $ 52.0 $ (3.5) $ (7.0) $ Pre-tax Adjustments: SG&A . . . . . .. . . . . . . . . . . . . . . . . . . . . . . . . . . . . . . . . (2.3) 1.3 (2.3) 1.3 - - Impairment charges . . . . . . . . . . . . . . . . . . . . . . . . . . . . 1.3 6.4 1.3 6.4 - - Total pre-tax adjustments . . . . . . . . . . . . . . . . . . . .. . (1.0) 7.7 (1.0) 7.7 - - Adjusted Pre-tax Profit from Continuing Operations . . . . . . 50.6 $ 52.7 $ 54.1 $ 59.7 $ (3.5) $ (7.0) $ Profit from Continuing Operations (after-tax) Reconciliation: As Reported . . . . . . . . . . . . . . . . . . . . .. . . . . . . . . . . . . . . . 31.5 $ 27.0 $ After-tax Adjustments: SG&A . . . . . . . . . . . . . . . . . . . . . . . . . . . . . . . . . . . . . .. (1.4) 0.7 Impairment charges . . . . . . . . . . . . . . . . . . . . . . . . . . . . 0.8 3.9 Permanent tax differences from disposals . . . . . . . . . . . - 0.9 Total after-tax adjustments . . . . . . . . . . . . . . . . . . . . (0.6) 5.5 Adjusted Profit from Continuing Operations (after-tax) . . . . 30.9 $ 32.5 $
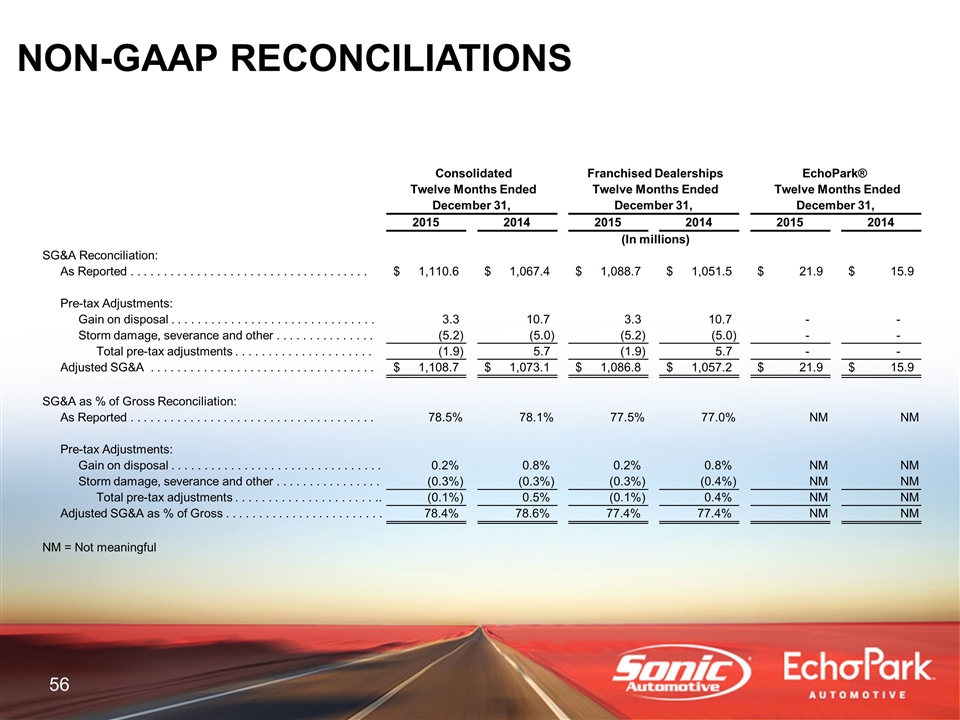
NON-GAAP RECONCILIATIONS Consolidated Franchised Dealerships EchoPark® Twelve Months Ended Twelve Months Ended Twelve Months Ended December 31, December 31, December 31, 2015 2014 2015 2014 2015 2014 (In millions) SG&A Reconciliation: As Reported . . . . . . . . . .. . . . . . . . . . . . . . . . . . . . . . . . . . . 1,110.6 $ 1,067.4 $ 1,088.7 $ 1,051.5 $ 21.9 $ 15.9 $ Pre-tax Adjustments: Gain on disposal . . . . . . . . . . . . . . . . . . . . . . . . . . . . . . . 3.3 10.7 3.3 10.7 - - Storm damage, severance and other . . . . . . . . . . . . . . . (5.2) (5.0) (5.2) (5.0) - - Total pre-tax adjustments . . . . . . . . . . . . . . . . . . . . . (1.9) 5.7 (1.9) 5.7 - - Adjusted SG&A . . . . . . . . . . . . . . . . . . . . . . . . . . . . . . . .. . . 1,108.7 $ 1,073.1 $ 1,086.8 $ 1,057.2 $ 21.9 $ 15.9 $ SG&A as % of Gross Reconciliation: As Reported . . . . . . . . . . . . . . . . . . . . . . . . . . . . . . . . . . . . . 78.5% 78.1% 77.5% 77.0% NM NM Pre-tax Adjustments: Gain on disposal . . . . . . . . . . . . . . . . . . . . . . . . . . . . . . . . 0.2% 0.8% 0.2% 0.8% NM NM Storm damage, severance and other . . . . . . . . . . . . . . . . (0.3%) (0.3%) (0.3%) (0.4%) NM NM Total pre-tax adjustments . . . . . . . . . . . . .. . . . . . . . . .. (0.1%) 0.5% (0.1%) 0.4% NM NM Adjusted SG&A as % of Gross . . . . . . . . . . . . . . . . . . . . . . . . 78.4% 78.6% 77.4% 77.4% NM NM NM = Not meaningful
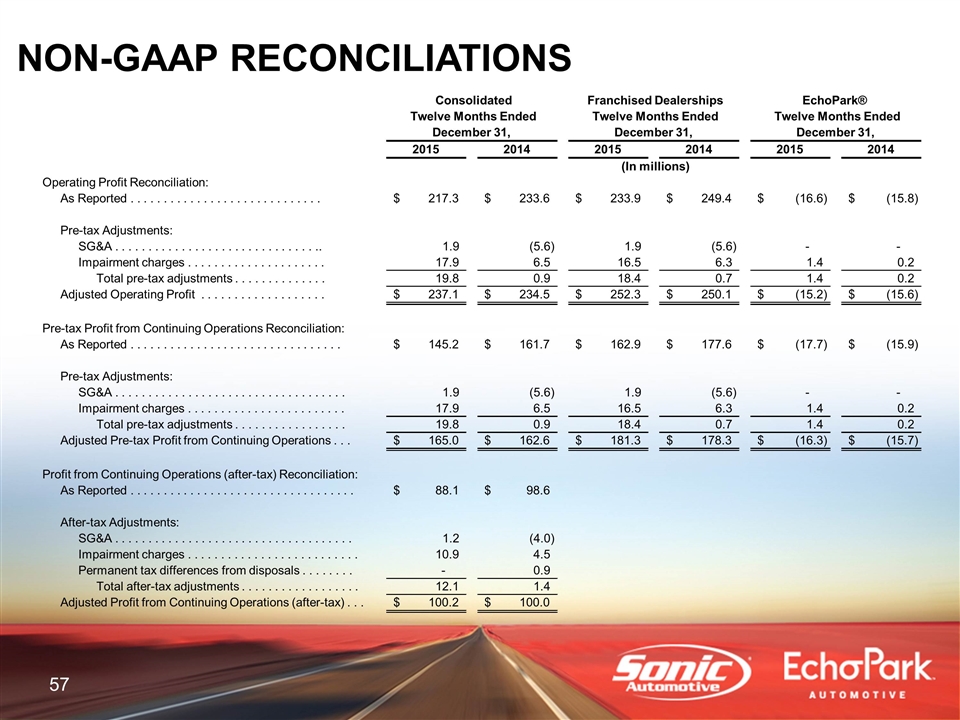
NON-GAAP RECONCILIATIONS Consolidated Franchised Dealerships EchoPark® Twelve Months Ended Twelve Months Ended Twelve Months Ended December 31, December 31, December 31, 2015 2014 2015 2014 2015 2014 (In millions) Operating Profit Reconciliation: As Reported . . . . . .. . . . . . . . . . . . . . . . . . . . . . . . 217.3 $ 233.6 $ 233.9 $ 249.4 $ (16.6) $ (15.8) $ Pre-tax Adjustments: SG&A . . . . . . . . . . . . . . . . . . . . . . . . . . . . . . .. 1.9 (5.6) 1.9 (5.6) - - Impairment charges . . . . . . . . .. . . . . . . . . . . . . 17.9 6.5 16.5 6.3 1.4 0.2 Total pre-tax adjustments . . . . . . . . . . . . . . 19.8 0.9 18.4 0.7 1.4 0.2 Adjusted Operating Profit . . . . . . . . . . . . . . . . . . . 237.1 $ 234.5 $ 252.3 $ 250.1 $ (15.2) $ (15.6) $ Pre-tax Profit from Continuing Operations Reconciliation: As Reported . . . . . . . . . . . . . . . . . . . . . . . . . . . . . . . . 145.2 $ 161.7 $ 162.9 $ 177.6 $ (17.7) $ (15.9) $ Pre-tax Adjustments: SG&A . . . . . . . . . . . . . . . . . . .. . . . . . . . . . . . . . . . . 1.9 (5.6) 1.9 (5.6) - - Impairment charges . . . . . . . . . . . . . . . . . . . . . . . . 17.9 6.5 16.5 6.3 1.4 0.2 Total pre-tax adjustments . . . . . . . . . . . . . . . . . 19.8 0.9 18.4 0.7 1.4 0.2 Adjusted Pre-tax Profit from Continuing Operations . . . 165.0 $ 162.6 $ 181.3 $ 178.3 $ (16.3) $ (15.7) $ Profit from Continuing Operations (after-tax) Reconciliation: As Reported . . . . . . . . . . . . . . . . . . . . . . . . . . . . . . . . . . 88.1 $ 98.6 $ After-tax Adjustments: SG&A . . . . . . . . . . . . . . . . . . . . . . . . . . . . . . . . . . . . 1.2 (4.0) Impairment charges . . . . . . . . . . . . . . . . . . . . . . . . . . 10.9 4.5 Permanent tax differences from disposals . . . . .. . . . - 0.9 Total after-tax adjustments . . . . . . . . . . . . . . . . . . 12.1 1.4 Adjusted Profit from Continuing Operations (after-tax) . . . 100.2 $ 100.0 $
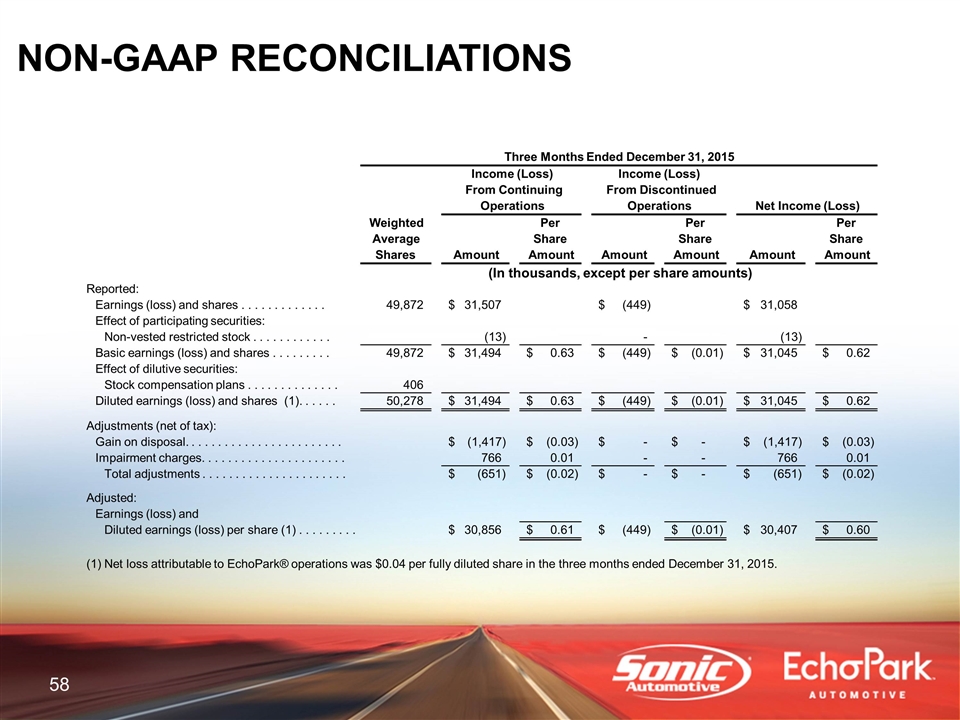
NON-GAAP RECONCILIATIONS Three Months Ended December 31, 2015 Income (Loss) Income (Loss) From Continuing From Discontinued Operations Operations Net Income (Loss) Weighted Per Per Per Average Share Share Share Shares Amount Amount Amount Amount Amount Amount (In thousands, except per share amounts) Reported: Earnings (loss) and shares . . . . . . . . . . . . . 49,872 31,507 $ (449) $ 31,058 $ Effect of participating securities: Non-vested restricted stock . . . . . . . . . . . . (13) - (13) Basic earnings (loss) and shares . . . . . . . . . 49,872 31,494 $ 0.63 $ (449) $ (0.01) $ 31,045 $ 0.62 $ Effect of dilutive securities: Stock compensation plans . . . . . . . . . . . . . . 406 Diluted earnings (loss) and shares (1). . . . . . 50,278 31,494 $ 0.63 $ (449) $ (0.01) $ 31,045 $ 0.62 $ Adjustments (net of tax): Gain on disposal. . . . . . . . . . . . . . . . . . . . . . . . (1,417) $ (0.03) $ - $ - $ (1,417) $ (0.03) $ Impairment charges. . . . . . . . . . . . . . . . . . . . . . 766 0.01 - - 766 0.01 Total adjustments . . . . . . . . . . . . . . . . . . . . . . (651) $ (0.02) $ - $ - $ (651) $ (0.02) $ Adjusted: Earnings (loss) and Diluted earnings (loss) per share (1) . . . . . . . . . 30,856 $ 0.61 $ (449) $ (0.01) $ 30,407 $ 0.60 $ (1) Net loss attributable to EchoPark® operations was $0.04 per fully diluted share in the three months ended December 31, 2015.
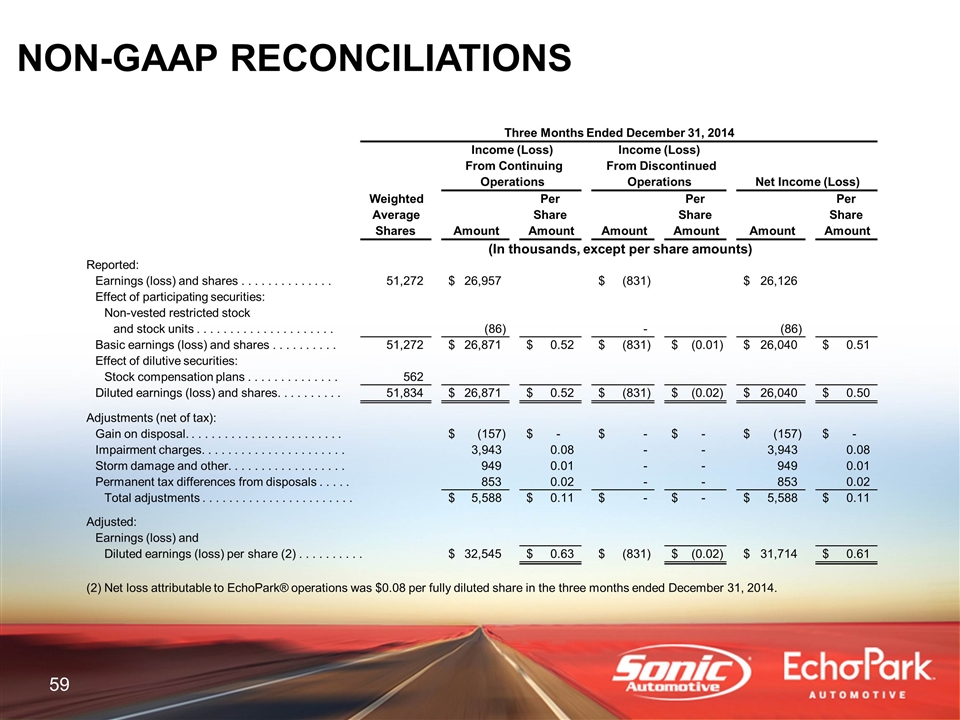
NON-GAAP RECONCILIATIONS Three Months Ended December 31, 2014 Income (Loss) Income (Loss) From Continuing From Discontinued Operations Operations Net Income (Loss) Weighted Per Per Per Average Share Share Share Shares Amount Amount Amount Amount Amount Amount (In thousands, except per share amounts) Reported: Earnings (loss) and shares . . . . . . . . . . . . . . 51,272 26,957 $ (831) $ 26,126 $ Effect of participating securities: Non-vested restricted stock and stock units . . . . . . . . . . . . . . . . . . . . . (86) - (86) Basic earnings (loss) and shares . . . . . . . . . . 51,272 26,871 $ 0.52 $ (831) $ (0.01) $ 26,040 $ 0.51 $ Effect of dilutive securities: Stock compensation plans . . . . . . . . . . . . . . 562 Diluted earnings (loss) and shares. . . .. . . . . . . 51,834 26,871 $ 0.52 $ (831) $ (0.02) $ 26,040 $ 0.50 $ Adjustments (net of tax): Gain on disposal. . . . . . . . . . . . . . . . . . . . . . . . (157) $ - $ - $ - $ (157) $ - $ Impairment charges. . . . . . . . . . . . . . . . . . . . .. . 3,943 0.08 - - 3,943 0.08 Storm damage and other. . . . . . . . . . . . . . . . . . 949 0.01 - - 949 0.01 Permanent tax differences from disposals . . . . . 853 0.02 - - 853 0.02 Total adjustments . . . . . . . . . . . . . . . . . . . . . . . 5,588 $ 0.11 $ - $ - $ 5,588 $ 0.11 $ Adjusted: Earnings (loss) and Diluted earnings (loss) per share (2) . . . . . . . . . . 32,545 $ 0.63 $ (831) $ (0.02) $ 31,714 $ 0.61 $ (2) Net loss attributable to EchoPark® operations was $0.08 per fully diluted share in the three months ended December 31, 2014.
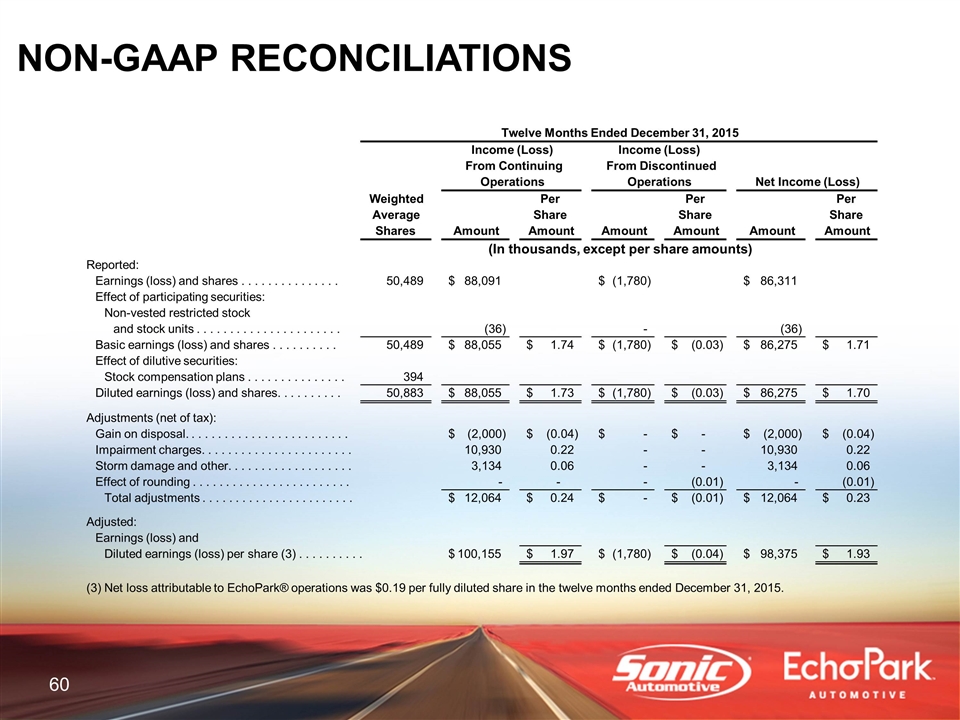
NON-GAAP RECONCILIATIONS Twelve Months Ended December 31, 2015 Income (Loss) Income (Loss) From Continuing From Discontinued Operations Operations Net Income (Loss) Weighted Per Per Per Average Share Share Share Shares Amount Amount Amount Amount Amount Amount (In thousands, except per share amounts) Reported: Earnings (loss) and shares . . . . . . . . . . . . . . . 50,489 88,091 $ (1,780) $ 86,311 $ Effect of participating securities: Non-vested restricted stock and stock units . . . . . . . . . . . . . . . . . . . . . .. (36) - (36) Basic earnings (loss) and shares . . . . . . . . . . 50,489 88,055 $ 1.74 $ (1,780) $ (0.03) $ 86,275 $ 1.71 $ Effect of dilutive securities: Stock compensation plans . . . . . . . . . . . . . . . 394 Diluted earnings (loss) and shares. . . . . . . . . . 50,883 88,055 $ 1.73 $ (1,780) $ (0.03) $ 86,275 $ 1.70 $ Adjustments (net of tax): Gain on disposal. . . . . . . . . . . . . . . . . . . . . . . . . (2,000) $ (0.04) $ - $ - $ (2,000) $ (0.04) $ Impairment charges. . . . . .. . . . . . . . . . . . . . . . . . 10,930 0.22 - - 10,930 0.22 Storm damage and other. . . . . . . . . . . . . . . . . . . 3,134 0.06 - - 3,134 0.06 Effect of rounding . . . . . . . . . . . . . . . . . . . . . . . . - - - (0.01) - (0.01) Total adjustments . . . . . . . . . . . . . . . . . . . . . . . 12,064 $ 0.24 $ - $ (0.01) $ 12,064 $ 0.23 $ Adjusted: Earnings (loss) and Diluted earnings (loss) per share (3) . . . . . . . . . . 100,155 $ 1.97 $ (1,780) $ (0.04) $ 98,375 $ 1.93 $ (3) Net loss attributable to EchoPark® operations was $0.19 per fully diluted share in the twelve months ended December 31, 2015.
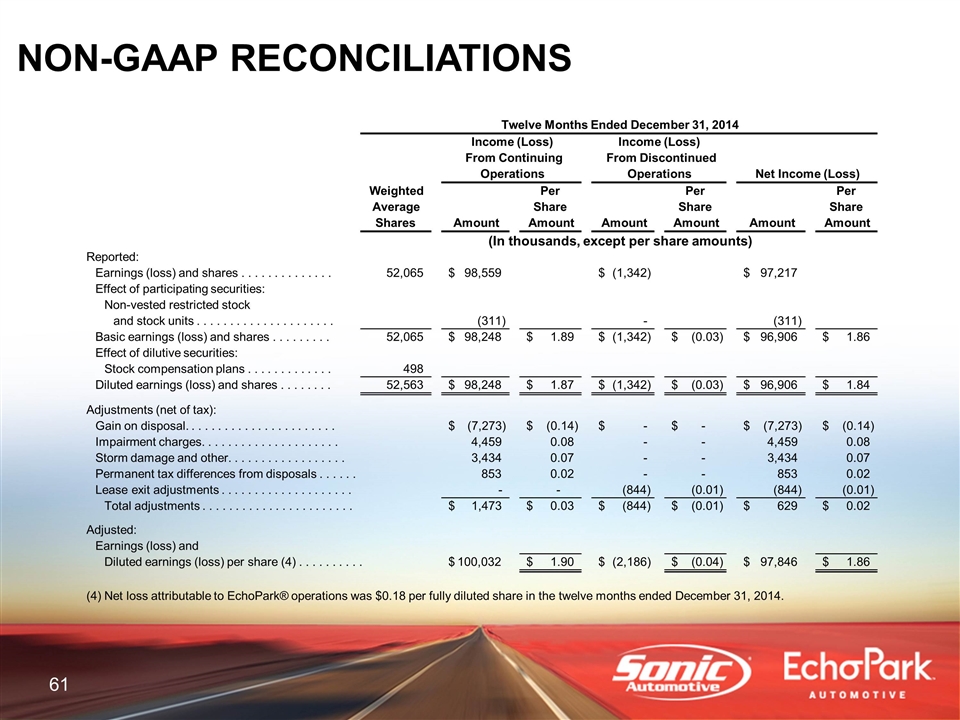
NON-GAAP RECONCILIATIONS Twelve Months Ended December 31, 2014 Income (Loss) Income (Loss) From Continuing From Discontinued Operations Operations Net Income (Loss) Weighted Per Per Per Average Share Share Share Shares Amount Amount Amount Amount Amount Amount (In thousands, except per share amounts) Reported: Earnings (loss) and shares . . . . . . . . . . . . . . 52,065 98,559 $ (1,342) $ 97,217 $ Effect of participating securities: Non-vested restricted stock and stock units . . . . . . . . . . . . . . . . . . . . . (311) - (311) Basic earnings (loss) and shares . . . . . . . . . 52,065 98,248 $ 1.89 $ (1,342) $ (0.03) $ 96,906 $ 1.86 $ Effect of dilutive securities: Stock compensation plans . . . . . . . . . . . . . 498 Diluted earnings (loss) and shares . . . .. . . . . 52,563 98,248 $ 1.87 $ (1,342) $ (0.03) $ 96,906 $ 1.84 $ Adjustments (net of tax): Gain on disposal. . . . . . . . . . . . . . . . . . . . . . . (7,273) $ (0.14) $ - $ - $ (7,273) $ (0.14) $ Impairment charges. . . . . . . . . . . . . . . .. . . . . . 4,459 0.08 - - 4,459 0.08 Storm damage and other. . . . . . . . . . . . . . . . . . 3,434 0.07 - - 3,434 0.07 Permanent tax differences from disposals . . . . . . 853 0.02 - - 853 0.02 Lease exit adjustments . . . . . . . . . . . . . . . .. . . . . - - (844) (0.01) (844) (0.01) Total adjustments . . . . . . . . . . . . . . . . . . . . . . . 1,473 $ 0.03 $ (844) $ (0.01) $ 629 $ 0.02 $ Adjusted: Earnings (loss) and Diluted earnings (loss) per share (4) . . . . . . . . . . 100,032 $ 1.90 $ (2,186) $ (0.04) $ 97,846 $ 1.86 $ (4) Net loss attributable to EchoPark® operations was $0.18 per fully diluted share in the twelve months ended December 31, 2014.
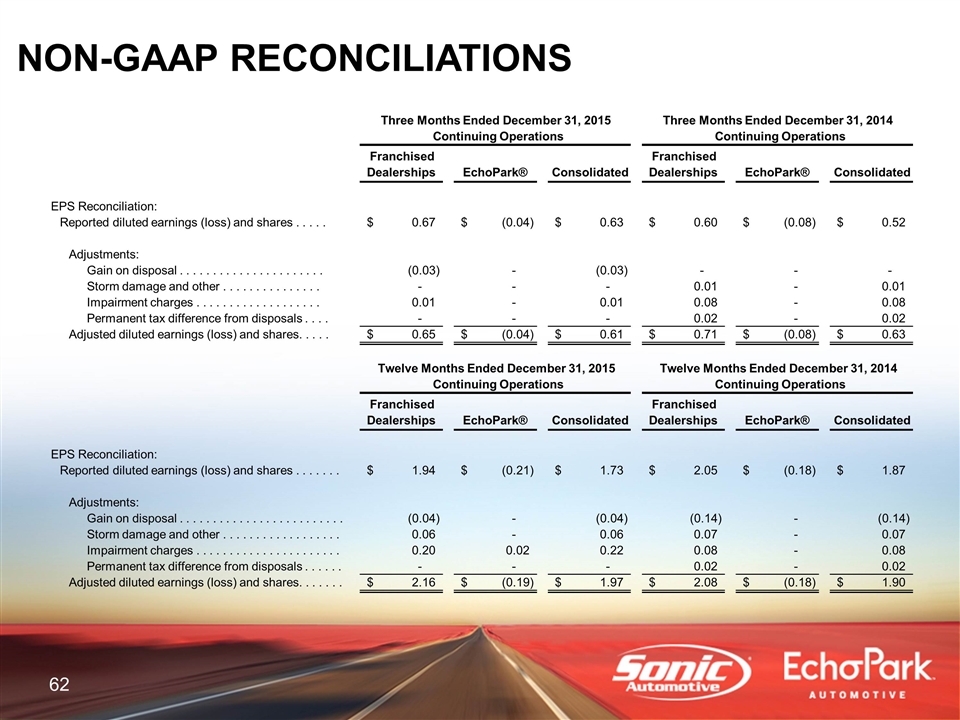
NON-GAAP RECONCILIATIONS Three Months Ended December 31, 2015 Three Months Ended December 31, 2014 Continuing Operations Continuing Operations Franchised Dealerships EchoPark® Consolidated Franchised Dealerships EchoPark® Consolidated EPS Reconciliation: Reported diluted earnings (loss) and shares . . . . . 0.67 $ (0.04) $ 0.63 $ 0.60 $ (0.08) $ 0.52 $ Adjustments: Gain on disposal . . . . . . . . . . . . . . . . . . . . . . (0.03) - (0.03) - - - Storm damage and other . . . . . . . . . . . . . . . - - - 0.01 - 0.01 Impairment charges . . . . . . . . . . . . . . . . . . . 0.01 - 0.01 0.08 - 0.08 Permanent tax difference from disposals . . . . - - - 0.02 - 0.02 Adjusted diluted earnings (loss) and shares. . . . . 0.65 $ (0.04) $ 0.61 $ 0.71 $ (0.08) $ 0.63 $ Twelve Months Ended December 31, 2015 Twelve Months Ended December 31, 2014 Continuing Operations Continuing Operations Franchised Dealerships EchoPark® Consolidated Franchised Dealerships EchoPark® Consolidated EPS Reconciliation: Reported diluted earnings (loss) and shares . . . . . . . 1.94 $ (0.21) $ 1.73 $ 2.05 $ (0.18) $ 1.87 $ Adjustments: Gain on disposal . . . . . . . . . . . . . . . . . . . . . . . . . (0.04) - (0.04) (0.14) - (0.14) Storm damage and other . . . . . . . . . . . . . . . . . . 0.06 - 0.06 0.07 - 0.07 Impairment charges . . . . . . . . . . . . . . . . . . . . . . 0.20 0.02 0.22 0.08 - 0.08 Permanent tax difference from disposals . . . . . . - - - 0.02 - 0.02 Adjusted diluted earnings (loss) and shares. . . . . . . 2.16 $ (0.19) $ 1.97 $ 2.08 $ (0.18) $ 1.90 $