
Q1 2016 Investor Presentation April 26, 2016 Exhibit 99.2
FORWARD-LOOKING STATEMENTS This presentation contains “forward-looking statements” within the meaning of the Private Securities Litigation Reform Act of 1995. These statements relate to future events, are not historical facts and are based on our current expectations and assumptions regarding our business, the economy and other future conditions. These statements can generally be identified by lead-in words such as “believe”, “expect”, “anticipate”, “intend”, “plan”, “foresee”, “may” ,”will” and other similar words. Statements that describe our Company’s objectives, plans or goals are also forward-looking statements. Examples of such forward-looking information we may be discussing in this presentation include, without limitation, anticipated 2016 industry new vehicle sales volume, the implementation of growth and operating strategies, including acquisitions of dealerships and properties, the development of open points and stand-alone pre-owned stores, the return of capital to shareholders, anticipated future success and impacts from the implementation of our strategic initiatives and earnings per share expectations. You are cautioned that these forward-looking statements are not guarantees of future performance, involve risks and uncertainties and actual results may differ materially from those projected in the forward-looking statements as a result of various factors. These risks and uncertainties include, among other things, (a) economic conditions in the markets in which we operate, (b) the success of our operational strategies, (c) our relationships with the automobile manufacturers, (d) new and pre-owned vehicle sales volume, and (e) earnings expectations for the year ending December 31, 2016. These risks and uncertainties, as well as additional factors that could affect our forward-looking statements, are described in our Form 10-K for the year ended December 31, 2015. These forward-looking statements, risks, uncertainties and additional factors speak only as of the date of this presentation. We undertake no obligation to update any such statements.

CONTENT STRATEGIC FOCUS FINANCIAL REVIEW OPERATIONS REVIEW SUMMARY & OUTLOOK

STRATEGIC FOCUS Growth EchoPark® One Sonic-One Experience Acquisitions & Open Points Own Our Properties Return Capital to Shareholders Share Repurchases Dividends

STRATEGIC FOCUS ONE SONIC-ONE EXPERIENCE (OSOE) Goals 1 Associate, 1 Price, 1 Hour Improve Transparency; Increase Trust Operational Efficiencies Grow Market Share Feed Fixed Operations Technology Being Introduced into Additional Markets (Charlotte was Pilot) CRM, Desking & Appraisal
STRATEGIC FOCUS EchoPark® Three Locations Open In Denver Thornton Hub Centennial Highlands Ranch Locations to Open in Denver Market in First Half of 2016 Dakota Ridge Stapleton One Additional Denver Market Locations by End of 2016 Acquiring Property in the Texas and Carolinas Markets Expect openings in 2017

STRATEGIC FOCUS ACQUISITIONS & OPEN POINTS Open Points Mercedes Benz in Dallas Market Operational in 2016 Audi in Pensacola Market Operational in 2016 Nissan in TN Market Operational in late 2016 / early 2017 Exploring Acquisition and Open Point Opportunities in Other Markets

STRATEGIC FOCUS OWN OUR PROPERTIES % of Properties Owned

Acquired 7.5% of OS in Q1 New Share Count = 46.2M Down from High of 53.2M (Dec 2012) Q1 Accretion = 7% STRATEGIC FOCUS RETURN CAPITAL TO SHAREHOLDERS (amounts in thousands, except per share data) Shares $/Share $ Availability Q1 Activity 4,102 $18.14 $74,414 $70,589 Q2 Activity 363 $17.62 $6,398 $64,191 YTD 4,465 $18.098992161254198 $80,812
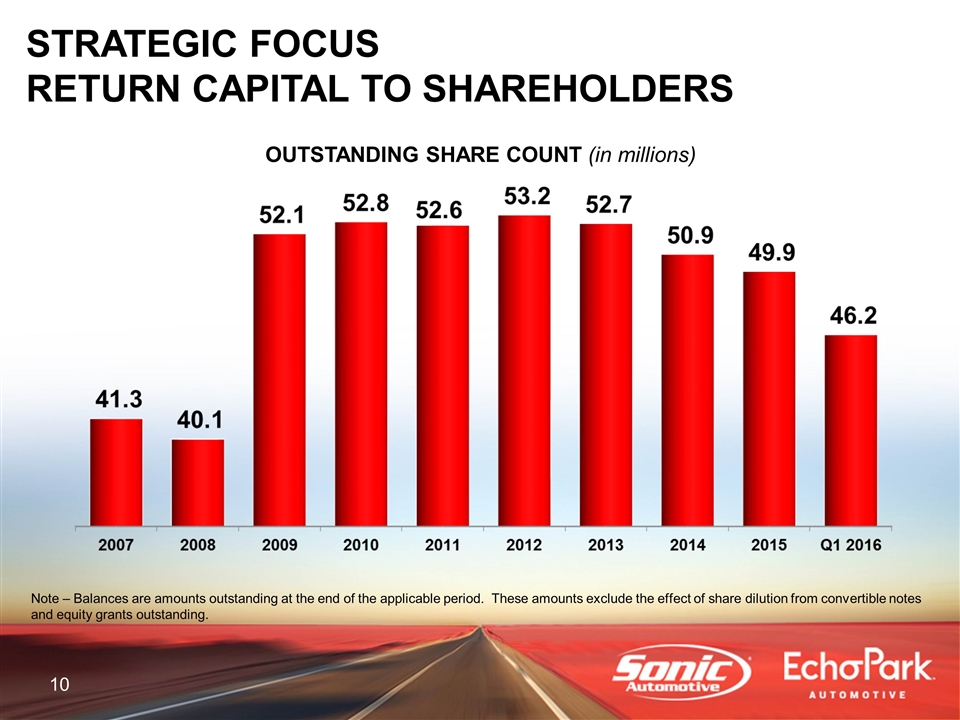
OUTSTANDING SHARE COUNT (in millions) Note – Balances are amounts outstanding at the end of the applicable period. These amounts exclude the effect of share dilution from convertible notes and equity grants outstanding. STRATEGIC FOCUS RETURN CAPITAL TO SHAREHOLDERS
Q1 2016 FINANCIAL REVIEW
Q1 2016 FINANCIAL REVIEW FRANCHISED SEGMENT
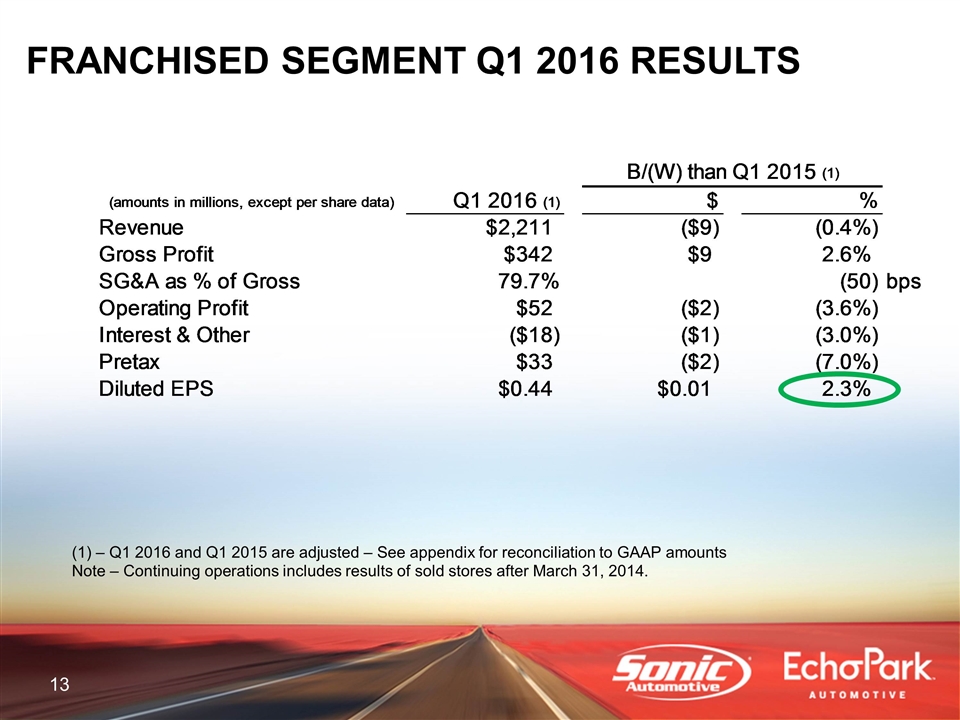
FRANCHISED SEGMENT Q1 2016 RESULTS – Q1 2016 and Q1 2015 are adjusted – See appendix for reconciliation to GAAP amounts Note – Continuing operations includes results of sold stores after March 31, 2014. B/(W) than Q1 2015 (1) (amounts in millions, except per share data) Q1 2016 (1) $ % Revenue $2,210.5855703400002 $-9.2448161800000825 -0.416464980214% Gross Profit $341.90277076999695 $8.7625259999930272 2.630281431786% SG&A as % of Gross 0.79737792888364267 -50 bps Operating Profit $51.581837113842703 $-1.9487110761553923 -3.64037197833% Interest & Other $-18.3298168 $-0.53997397999999885 -3.352937092448% Pretax $33.252020313842095 $-2.4886850561561005 -6.96316715183% Diluted EPS $0.44 $0.01 2.3% Diluted EPS Keyed $0.44 $0.01 2.3% 2.3255813953488372E-2
Q1 2016 FINANCIAL REVIEW ECHOPARK® SEGMENT

NM – Not Meaningful ECHOPARK® SEGMENT Q1 2016 RESULTS – Q1 2015 is adjusted – See appendix for reconciliation to GAAP amounts B/(W) than Q1 2015 (1) (amounts in millions, except per share, unit and per unit data) Q1 2016 $ % Revenue $24.040798879999997 $8.3561191099999998 NM Gross Profit $3.2473007699999998 $1.4282120599999999 NM Operating Profit $-3.2347051800000002 $1.5568416899999997 NM Interest & Other $-0.34109946000000002 $-0.22344724000000002 NM Pretax $-3.5758046400000003 $1.3333944499999997 0.2716114025027247 Diluted EPS $-0.05 $0.01 0.16700000000000001 Retail Units 941 281 0.42575757575757578 GPU $1,390.4525079702444 $5.1868564550929932 .3744304531% F&I ($/unit) $1,368.5311264612114 $480.43644464302963 0.5409743515853962 Diluted EPS Keyed $-0.05 $0.01 0.16700000000000001 0.16666666666666669
Q1 2016 FINANCIAL REVIEW TOTAL ENTERPRISE
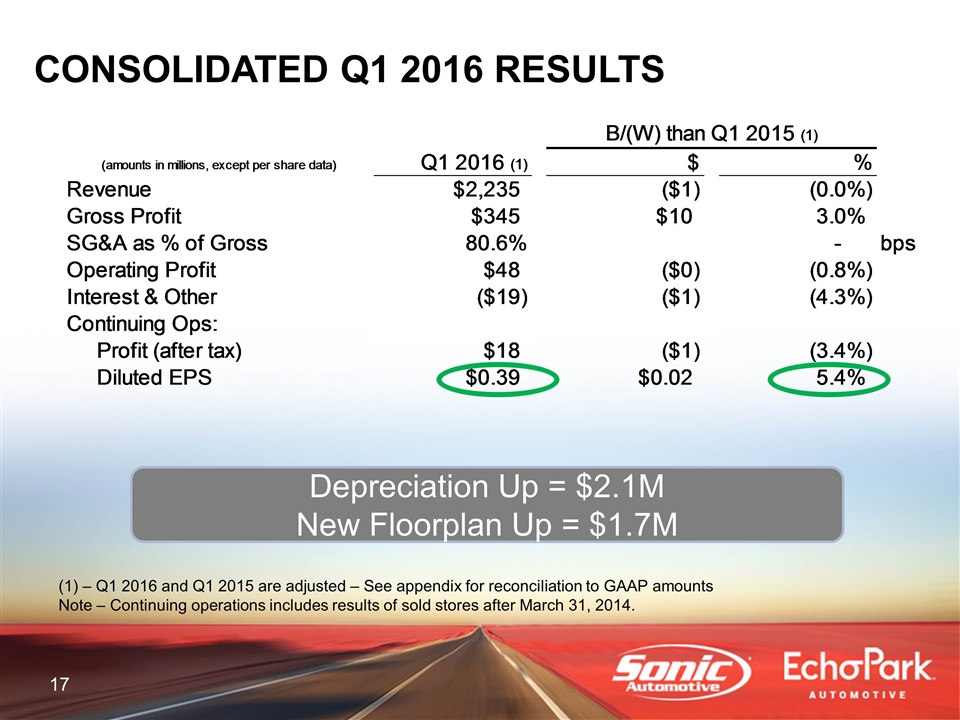
– Q1 2016 and Q1 2015 are adjusted – See appendix for reconciliation to GAAP amounts Note – Continuing operations includes results of sold stores after March 31, 2014. CONSOLIDATED Q1 2016 RESULTS Depreciation Up = $2.1M New Floorplan Up = $1.7M B/(W) than Q1 2015 (1) (amounts in millions, except per share data) Q1 2016 (1) $ % Revenue $2,234.62636922001 $-0.88869706998998299 .03975357104% Gross Profit $345.15007153999801 $10.190738059994008 3.423806836845% SG&A as % of Gross 0.80641113760830896 0 bps Operating Profit $48.347131933842803 $-0.39186938615530381 -0.8040160355% Interest & Other $-18.670916260000002 $-0.76342122000000379 -4.263137967062% Continuing Ops: Profit (after tax) $18.1618442238425 $-0.64537526615519891 -3.431529400178% Diluted EPS $0.39 $0.02 5.4% Diluted EPS Keyed $0.39 $0.02 5.4% 5.4054054054054057E-2
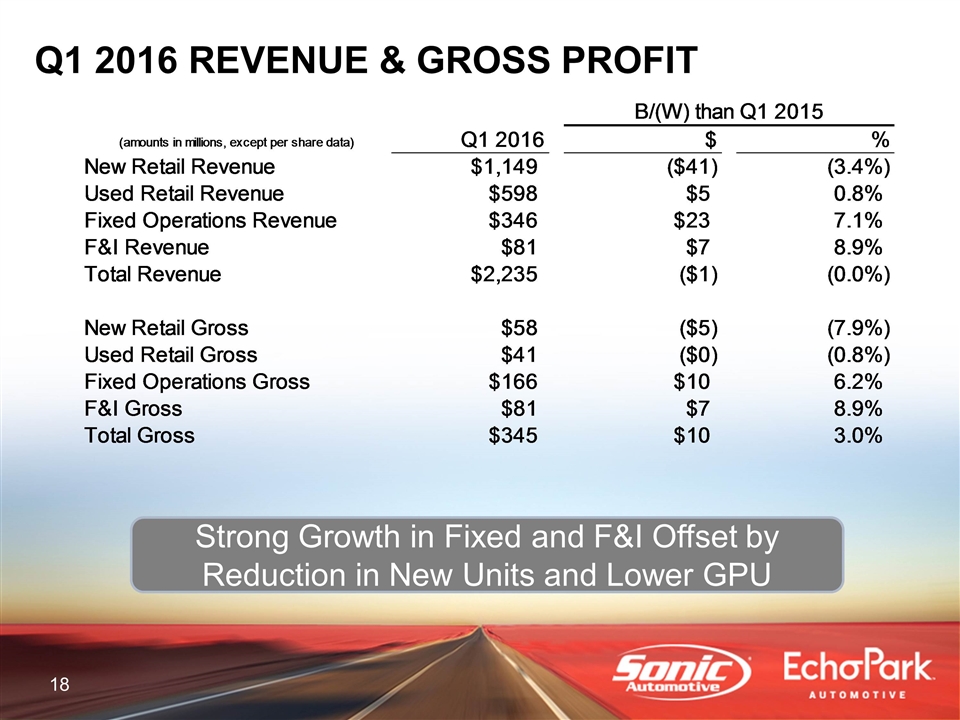
Q1 2016 REVENUE & GROSS PROFIT Strong Growth in Fixed and F&I Offset by Reduction in New Units and Lower GPU B/(W) than Q1 2015 (amounts in millions, except per share data) Q1 2016 $ % New Retail Revenue $1,149.4367360000001 $-40.77852289000014 -3.426146874308% Used Retail Revenue $598.35451798999998 $4.6125118499989624 .776854560112% Fixed Operations Revenue $346.05449943000002 $22.860565100000066 7.733273962556% F&I Revenue $81.272952369999899 $6.6734262699997924 8.945668449762% Total Revenue $2,234.62636922001 $-0.88869706998998299 .03975357104% New Retail Gross $58.387575059998802 $-5.0297534000000956 -7.931197232902% Used Retail Gross $40.530749749999799 $-0.31369647000049733 -0.768027232664% Fixed Operations Gross $166.00042727000002 $9.625684160000004 6.155523563821% F&I Gross $81.272952369999899 $6.6734262699997924 8.945668449762% Total Gross $345.15007153999801 $10.190738059994008 3.423806836845%
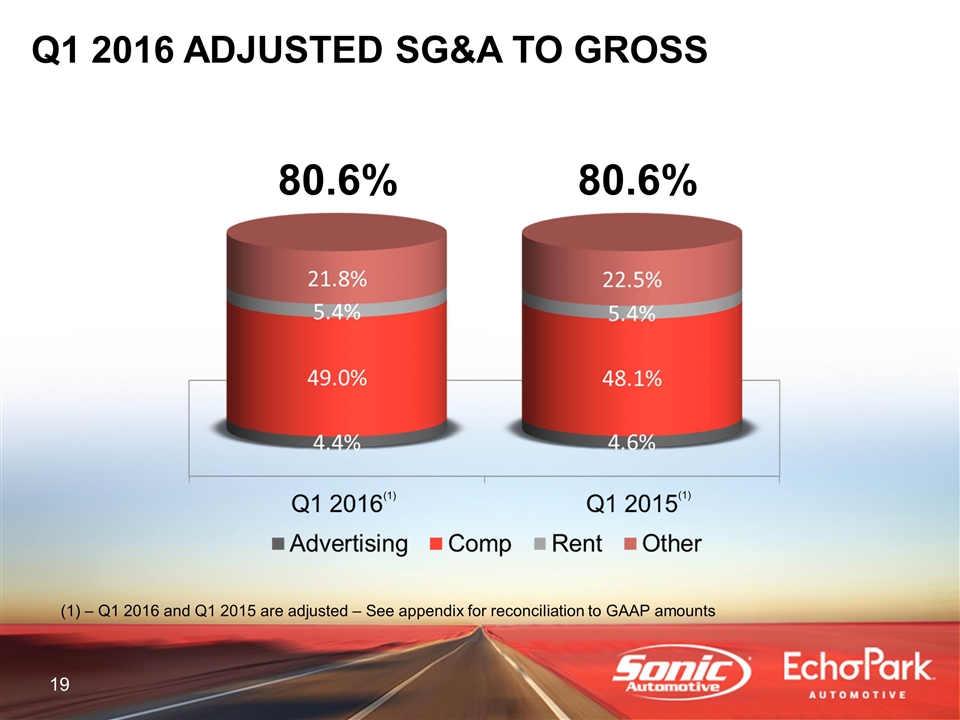
Q1 2016 ADJUSTED SG&A TO GROSS 80.6% 80.6% – Q1 2016 and Q1 2015 are adjusted – See appendix for reconciliation to GAAP amounts (1) (1)
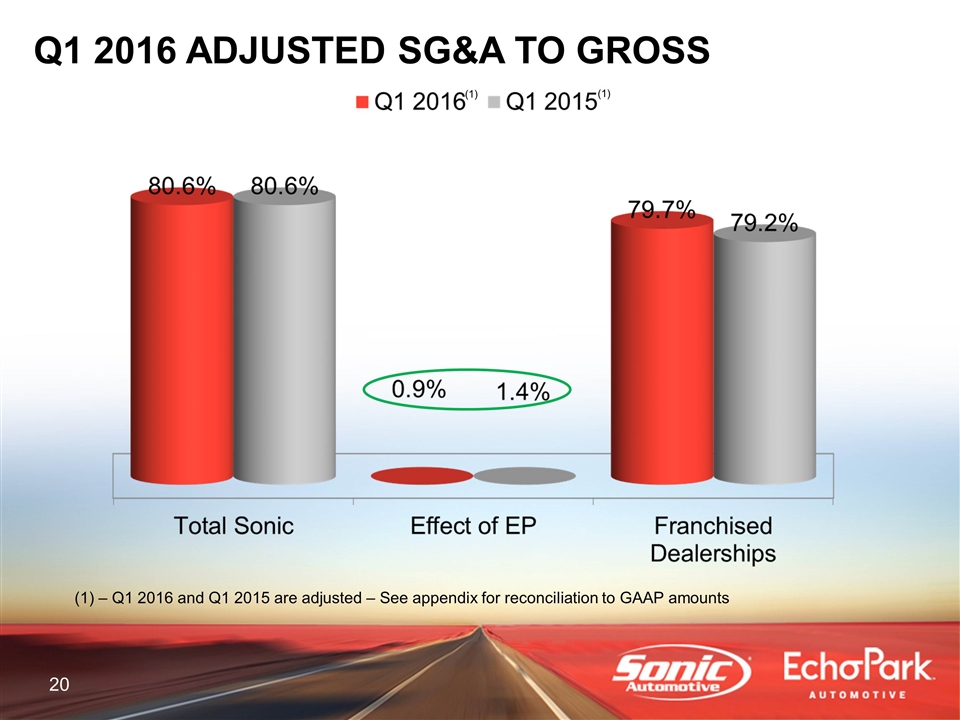
Q1 2016 ADJUSTED SG&A TO GROSS – Q1 2016 and Q1 2015 are adjusted – See appendix for reconciliation to GAAP amounts (1) (1)
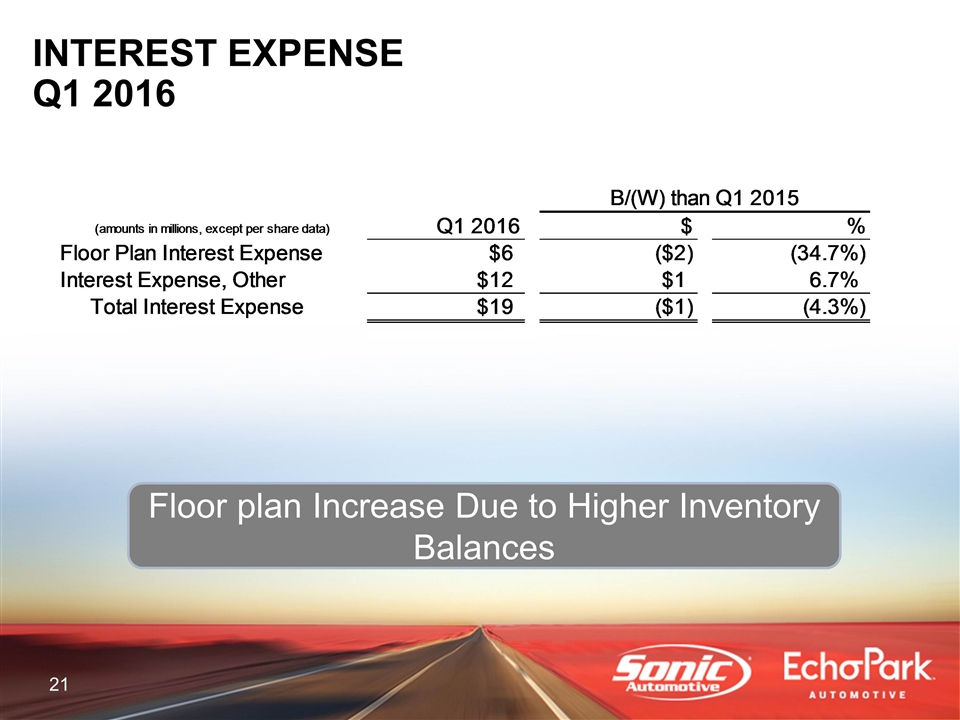
INTEREST EXPENSE Q1 2016 Floor plan Increase Due to Higher Inventory Balances B/(W) than Q1 2015 (amounts in millions, except per share data) Q1 2016 $ % Floor Plan Interest Expense $6.43546101 $-1.6574960899999995 -0.3469041982836491 Interest Expense, Other $12.339002719999998 $0.8804708600000013 6.660407879873% Total Interest Expense $18.774463730000001 $-0.77702522999999923 -4.31742122636%
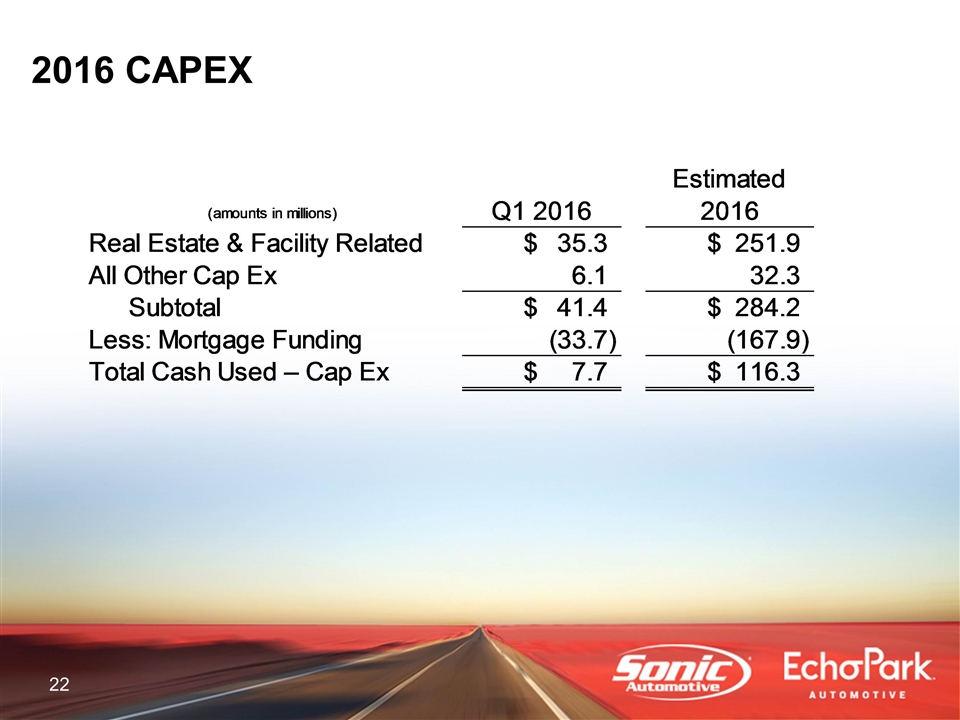
2016 CAPEX (amounts in millions) Q1 2016 Estimated 2016 Real Estate & Facility Related $35.299999999999997 $251.9 All Other Cap Ex 6.1 32.299999999999997 Subtotal $41.4 $284.2 Less: Mortgage Funding -33.700000000000003 -,167.9 Total Cash Used – Cap Ex $7.6999999999999957 $116.29999999999998
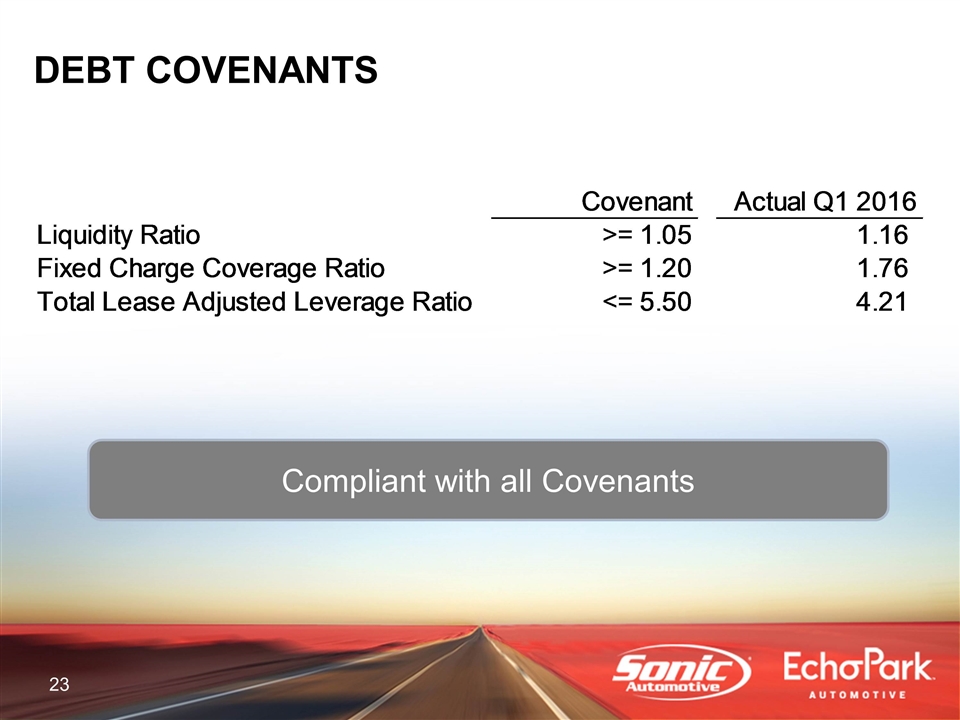
DEBT COVENANTS Compliant with all Covenants Covenant Actual Q1 2016 Liquidity Ratio >= 1.05 1.1599999999999999 Fixed Charge Coverage Ratio >= 1.20 1.76 Total Lease Adjusted Leverage Ratio <= 5.50 4.21
OPERATIONS REVIEW

NEW VEHICLE RETAIL SAME STORE Inventory levels continue to add pressure to PUR - market continues to be hyper competitive in particular with BMW Q1 2016 Q1 2015 B/(W) Retail Volume 30,156 31,017 -2.7758970887% Selling Price $38,116.362186297913 $37,959.413283683141 .4134650381% Gross Margin % 5.0999999999999997 5.3% -20 bps GPU $1,934.5646577795067 $2,017.1503214366026 $-82.585663657095893 Gross Profit $58.338731819998799 $62.565951519999103 -6.7564219792% SAAR (mllion) 17.100000000000001 16.600000000000001 3.1204819277% SAAR - Keyed 17.100000000000001 16.600000000000001 3.1%
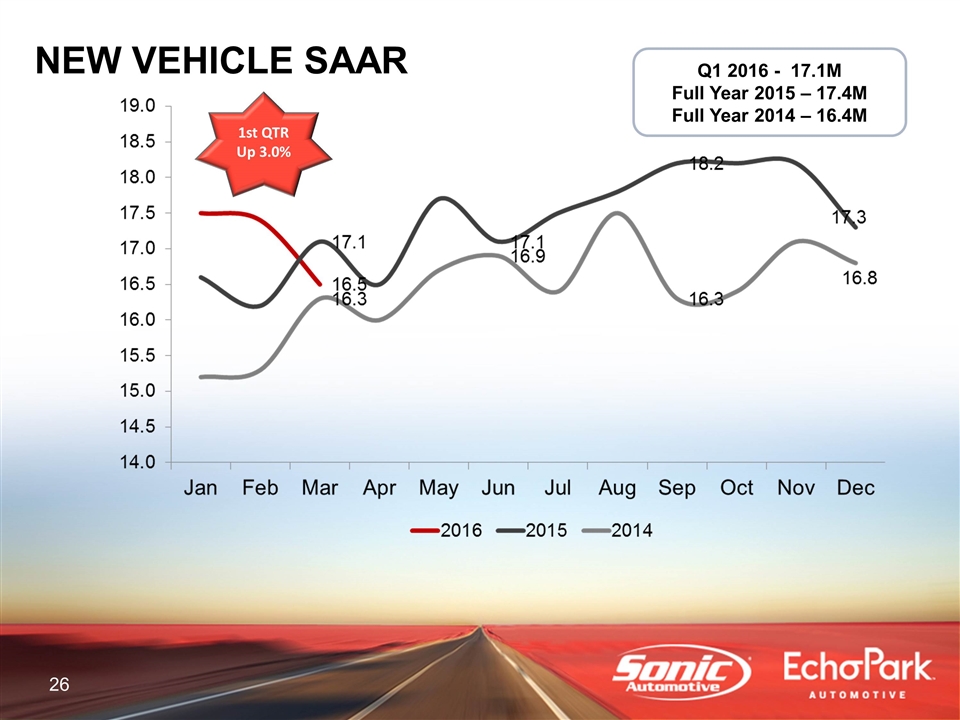
NEW VEHICLE SAAR 1st QTR Up 3.0% Q1 2016 - 17.1M Full Year 2015 – 17.4M Full Year 2014 – 16.4M

NEW VEHICLE SAAR – RETAIL ONLY
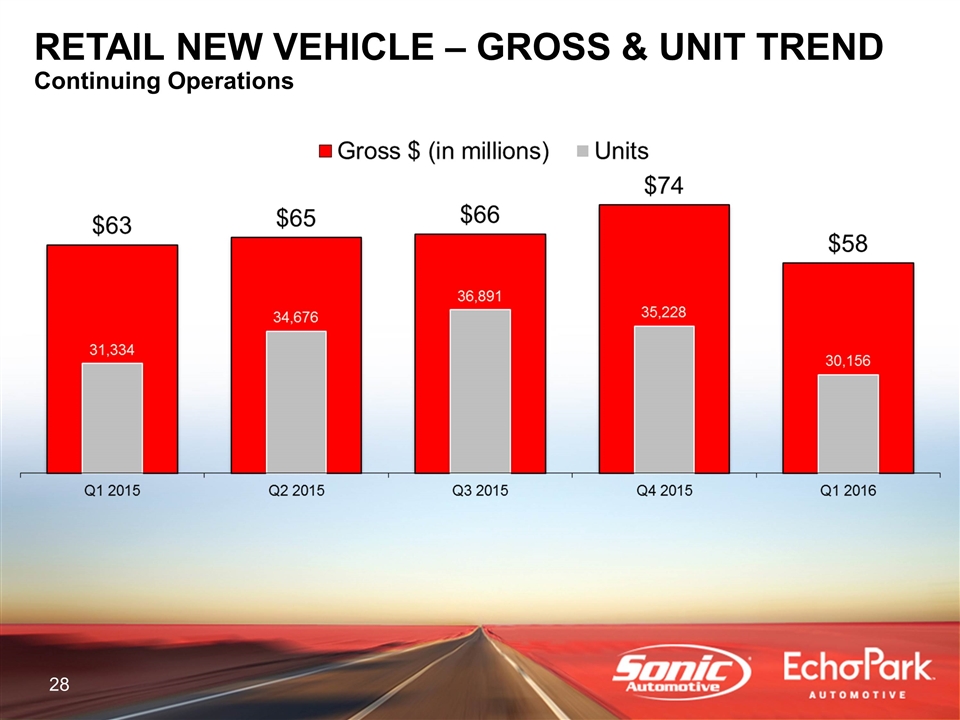
RETAIL NEW VEHICLE – GROSS & UNIT TREND Continuing Operations
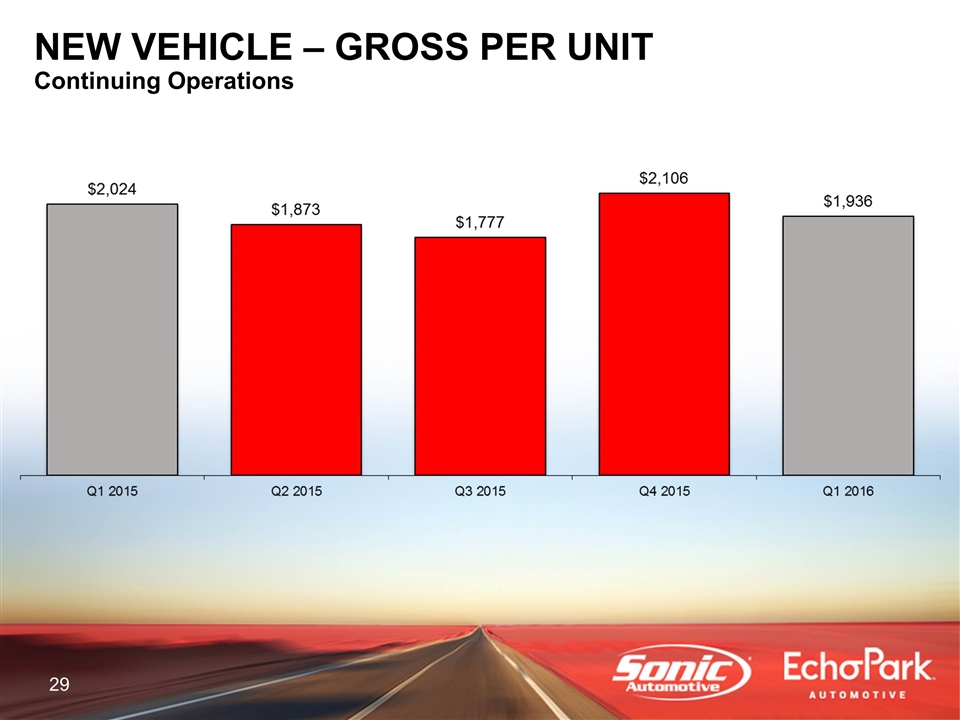
NEW VEHICLE – GROSS PER UNIT Continuing Operations

VEHICLE DAYS SUPPLY New – 74 days adjusted for 1,000 stop sell units Used – 33 days adjusted for 1,637 stop sell units

USED VEHICLE RETAIL SAME STORE Volume Increases Offset by Lower GPU Record Q1 Units Q1 2016 Q1 2015 B/(W) Retail Volume 29,333 27,687 5.9450283527% GPU $1,387.1903869362086 $1,481.1205475493987 $-93.930160613190083 Gross Profit $40.690455619999803 $41.0077846000002 $-0.31732898000039861 Used to New 0.97 to 1.00 0.89 to 1.00 8.9887640449% Vehicles/Store/Mth (105 stores) 93 88 5 Vehicles per store/month (Keyed) $0 $0 0.0%

* - Used Related Gross = (Used Gross + F&I + Reconditioning) ($’s in millions) USED VEHICLE – GROSS & UNIT TREND Continuing Operations Record Q1 Gross
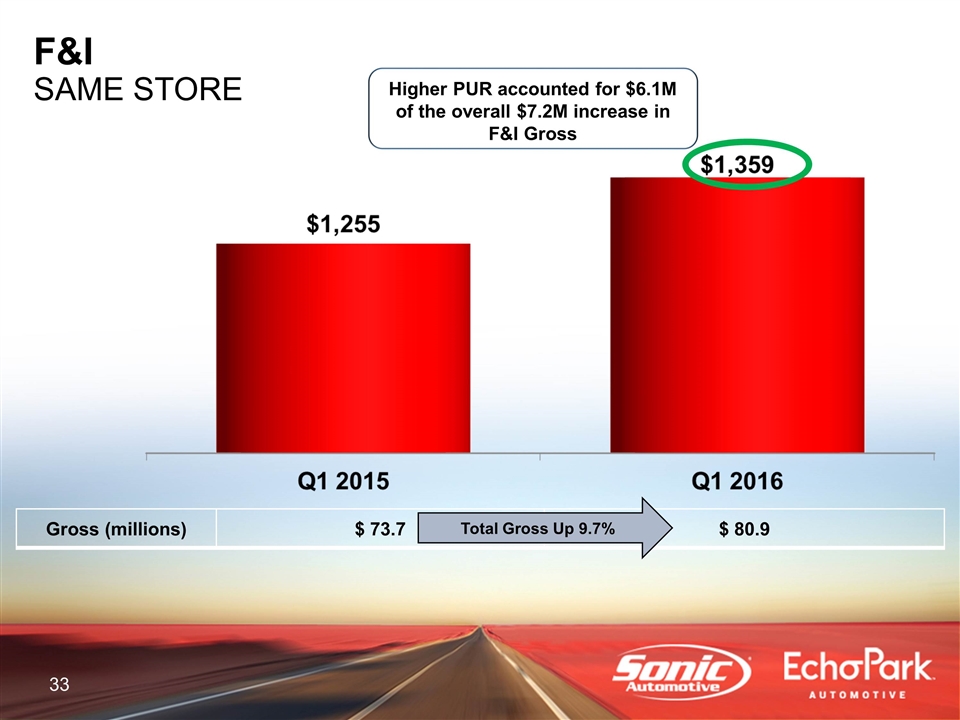
Higher PUR accounted for $6.1M of the overall $7.2M increase in F&I Gross Gross (millions) $ 73.7 $ 80.9 F&I SAME STORE Total Gross Up 9.7%
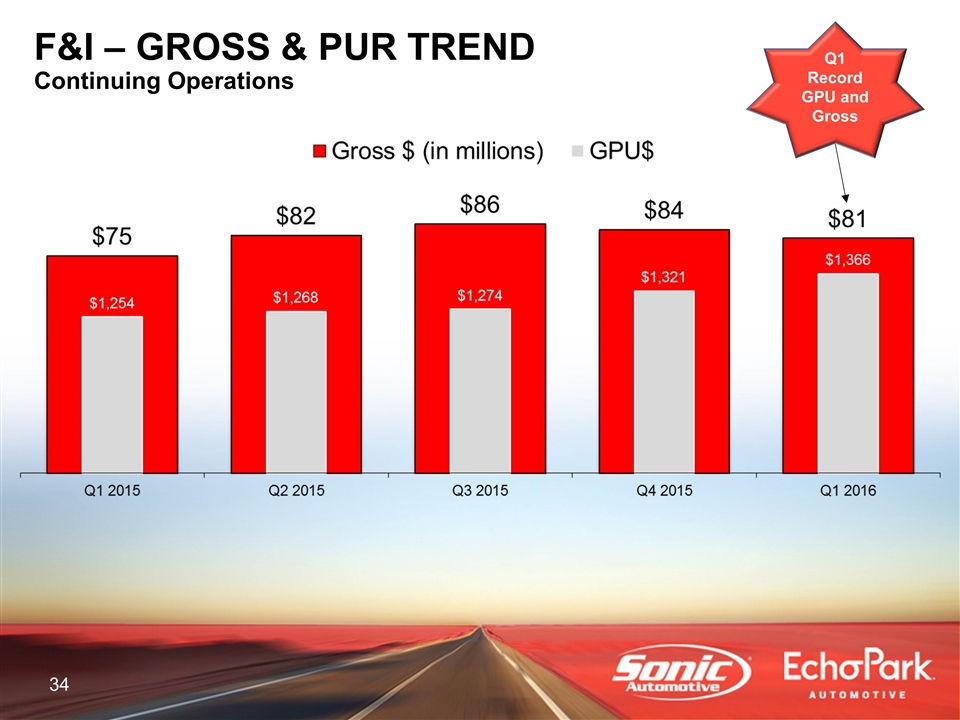
F&I – GROSS & PUR TREND Continuing Operations Q1 Record GPU and Gross
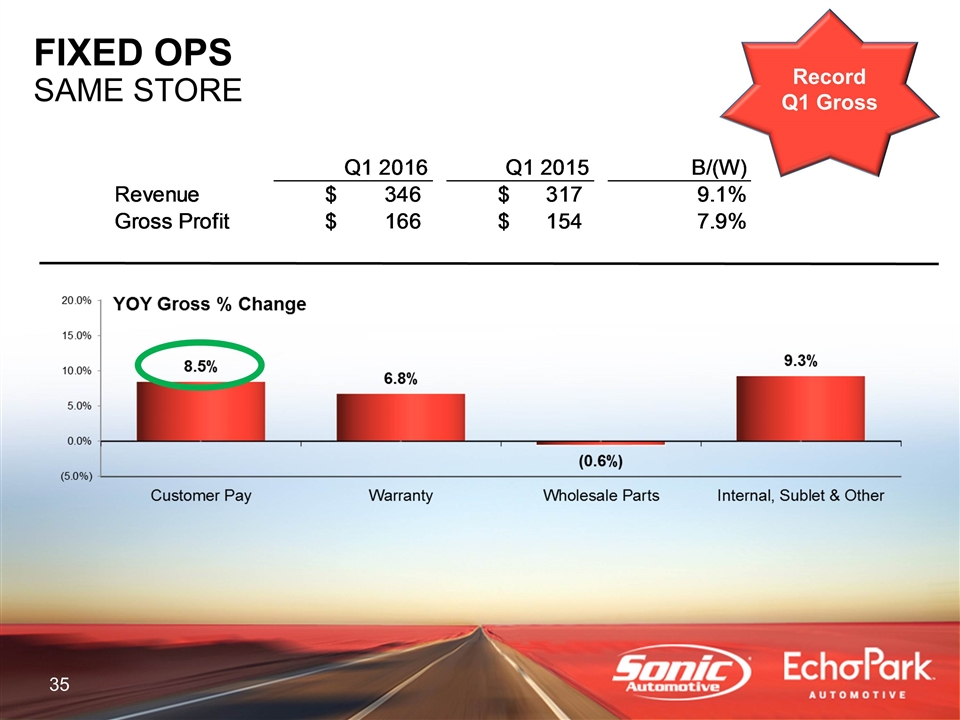
FIXED OPS SAME STORE Record Q1 Gross Q1 2016 Q1 2015 B/(W) Revenue $346.05449943000002 $317.27259285000099 9.7166494321% Gross Profit $165.64933493999999 $153.50298598000001 7.9127769942% SAAR - Keyed $0 $0 0.0%

FIXED OPS SAME STORE – CUSTOMER PAY We continue to perform better in CP – the moves we have made in our shops and the increased level of technicians is paying off
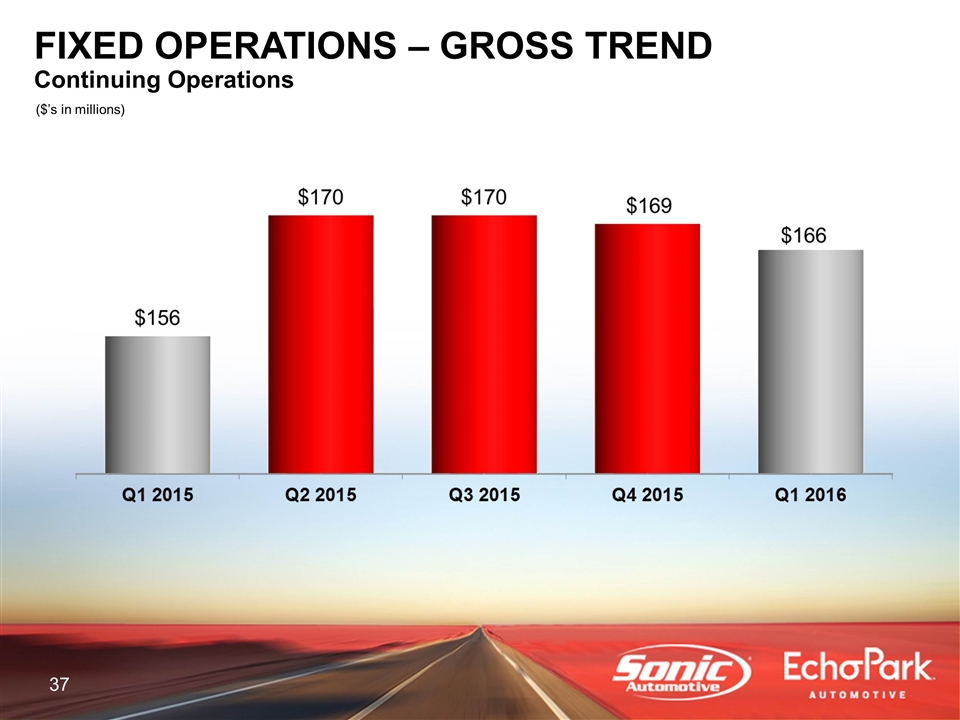
($’s in millions) FIXED OPERATIONS – GROSS TREND Continuing Operations

EchoPark® entering 2 new markets – Texas & Carolinas Returned capital through stock purchases and dividend Continued to grow the top-line revenue and gross New vehicle GPU pressure continues – industry supply continues to be higher than historic levels Used environment is stable Fixed operations and F&I continue to grow and show strength Maintain 2016 Adjusted Continued Ops EPS Guidance: New Car Franchise Business $2.28 - $2.40 Effect of EchoPark® ($0.21) – ($0.23) Total Sonic $2.07 - $2.17 SUMMARY

APPENDIX

ADJUSTMENTS BRIDGE Q1 2016 (amounts in millions, except per share data) Q1 2016 Q1 2015 Notes 2016 Notes 2015 Pre-Tax EPS Pre-Tax EPS Unadjusted $0.31 $0.28000000000000003 Storm Damage 6.1 0.08 0 0 TX Hail Impairment 0 0 6.2 7.0000000000000007E-2 Website Other 0 0 1 0.02 Severance & Loss on Disposal Adjusted EPS $0.39 $0.37
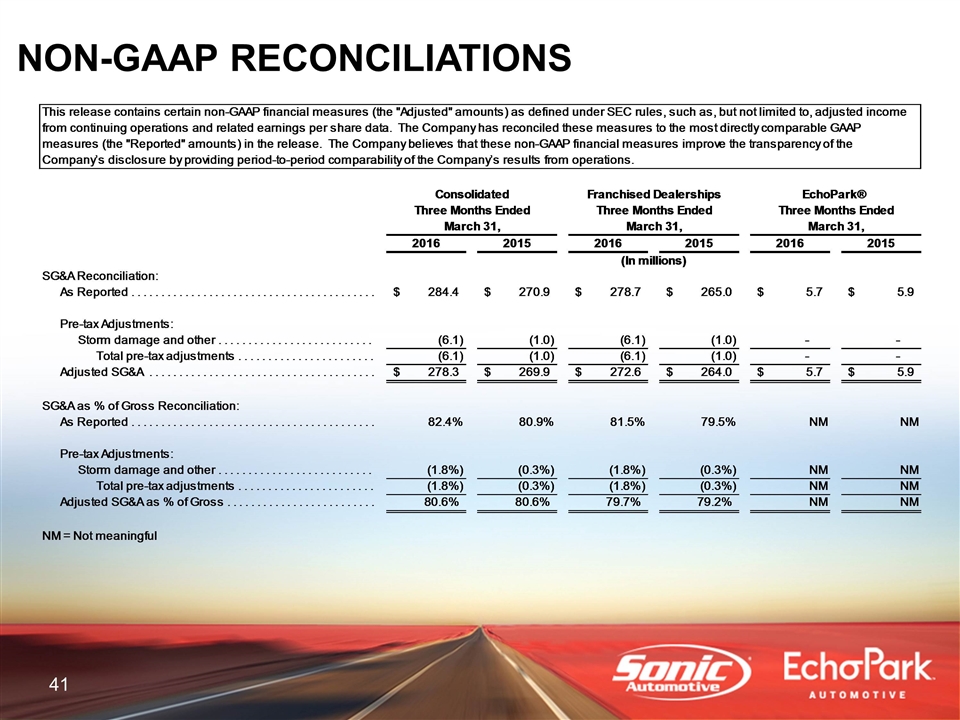
NON-GAAP RECONCILIATIONS

NON-GAAP RECONCILIATIONS
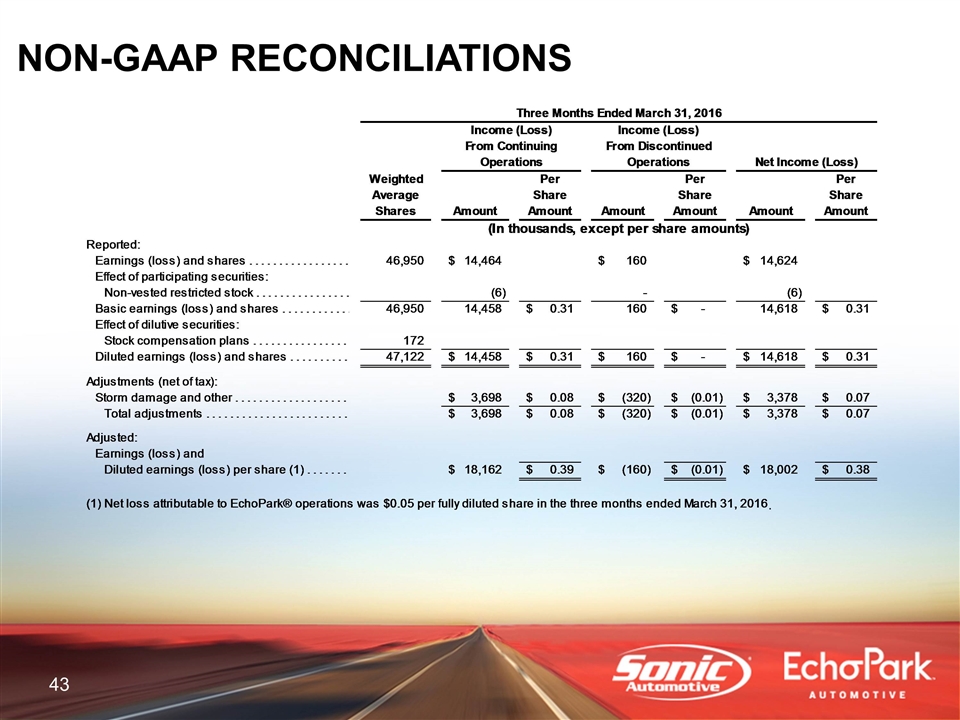
NON-GAAP RECONCILIATIONS ..
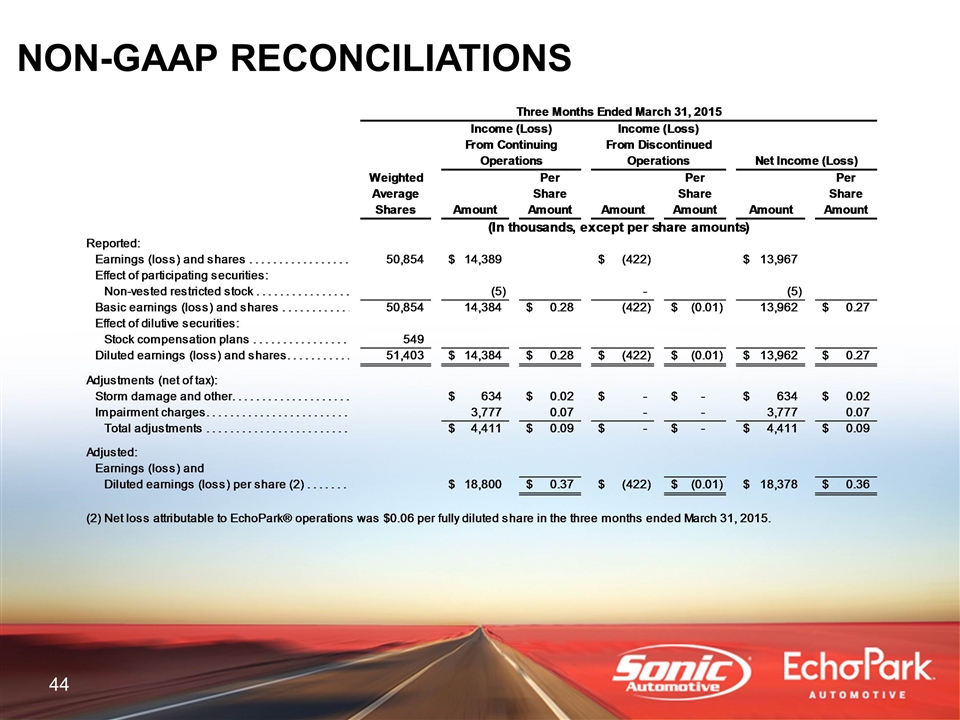
NON-GAAP RECONCILIATIONS
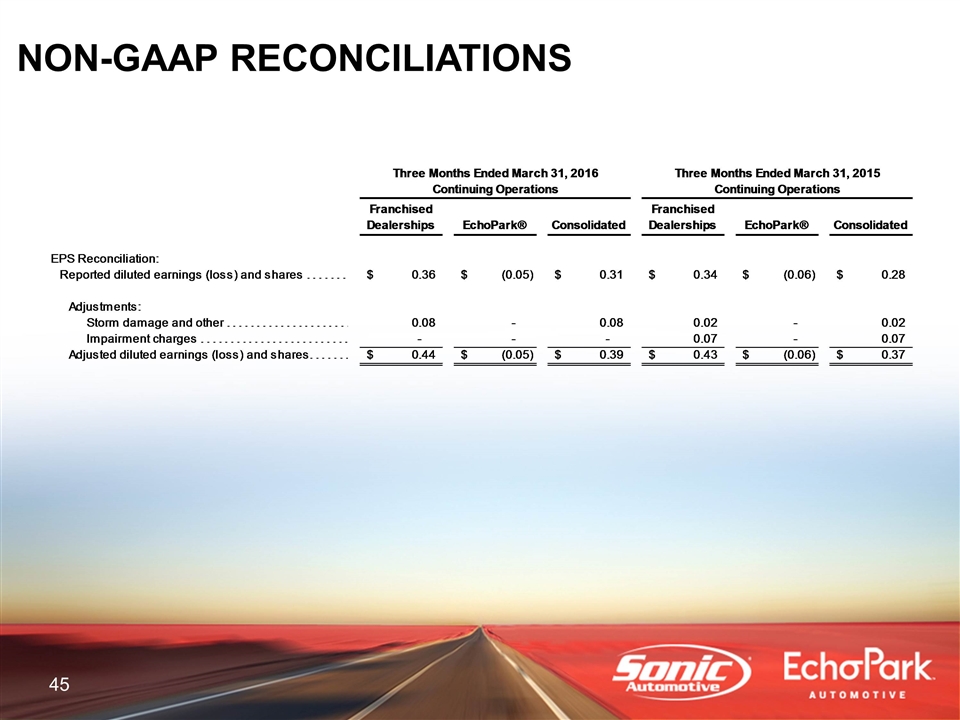
NON-GAAP RECONCILIATIONS