
Q2 2016 Investor Presentation July 26, 2016 Exhibit 99.2
FORWARD-LOOKING STATEMENTS This presentation contains “forward-looking statements” within the meaning of the Private Securities Litigation Reform Act of 1995. These statements relate to future events, are not historical facts and are based on our current expectations and assumptions regarding our business, the economy and other future conditions. These statements can generally be identified by lead-in words such as “believe”, “expect”, “anticipate”, “intend”, “plan”, “foresee”, “may” ,”will” and other similar words. Statements that describe our Company’s objectives, plans or goals are also forward-looking statements. Examples of such forward-looking information we may be discussing in this presentation include, without limitation, anticipated 2016 industry new vehicle sales volume, the implementation of growth and operating strategies, including acquisitions of dealerships and properties, the development of open points and stand-alone pre-owned stores, the return of capital to shareholders, anticipated future success and impacts from the implementation of our strategic initiatives and earnings per share expectations. You are cautioned that these forward-looking statements are not guarantees of future performance, involve risks and uncertainties and actual results may differ materially from those projected in the forward-looking statements as a result of various factors. These risks and uncertainties include, among other things, (a) economic conditions in the markets in which we operate, (b) the success of our operational strategies, (c) our relationships with the automobile manufacturers, (d) new and pre-owned vehicle sales volume, and (e) earnings expectations for the year ending December 31, 2016. These risks and uncertainties, as well as additional factors that could affect our forward-looking statements, are described in our Form 10-K for the year ended December 31, 2015. These forward-looking statements, risks, uncertainties and additional factors speak only as of the date of this presentation. We undertake no obligation to update any such statements.

CONTENT OVERVIEW STRATEGIC FOCUS FINANCIAL REVIEW OPERATIONS REVIEW SUMMARY & OUTLOOK

OVERVIEW – FRANCHISED GEOGRAPHIC Based in Charlotte, NC 102 Stores, 25 Brands, 18 Collision Repair Centers Platforms in Major Metro Markets

OVERVIEW – ECHOPARK® GEOGRAPHIC Dakota Ridge - Opened June 2016 Stapleton - Opened June 2016 Colorado Springs - Opens Q4 2016
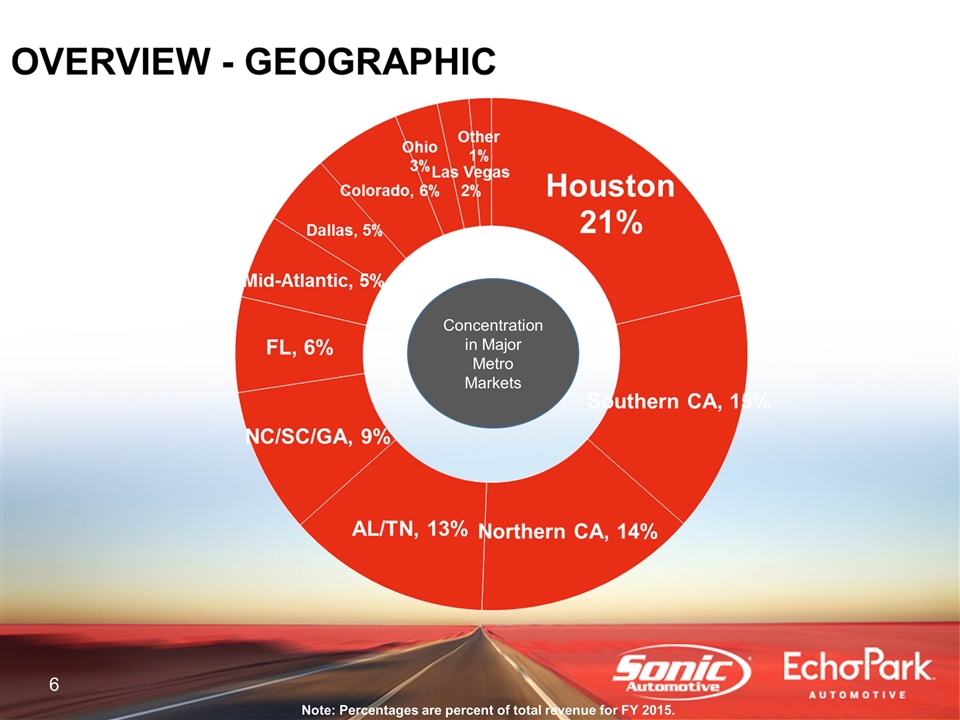
Note: Percentages are percent of total revenue for FY 2015. Concentration in Major Metro Markets
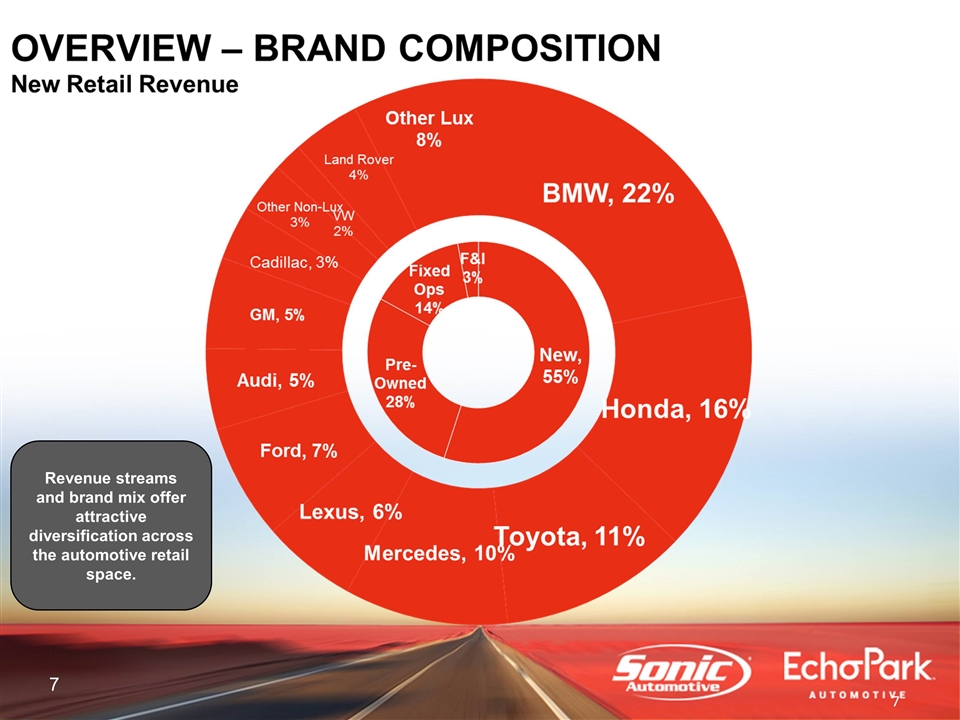
Revenue streams and brand mix offer attractive diversification across the automotive retail space.
STRATEGIC FOCUS Growth EchoPark® One Sonic-One Experience Acquisitions & Open Points Own Our Properties Return Capital to Shareholders Share Repurchases Dividends

STRATEGIC FOCUS ONE SONIC-ONE EXPERIENCE (OSOE) Goals 1 Associate, 1 Price, 1 Hour Improve Transparency; Increase Trust Operational Efficiencies Grow Market Share Feed Fixed Operations Technology Being Introduced into Additional Markets (Charlotte was Pilot) CRM, Desking & Appraisal
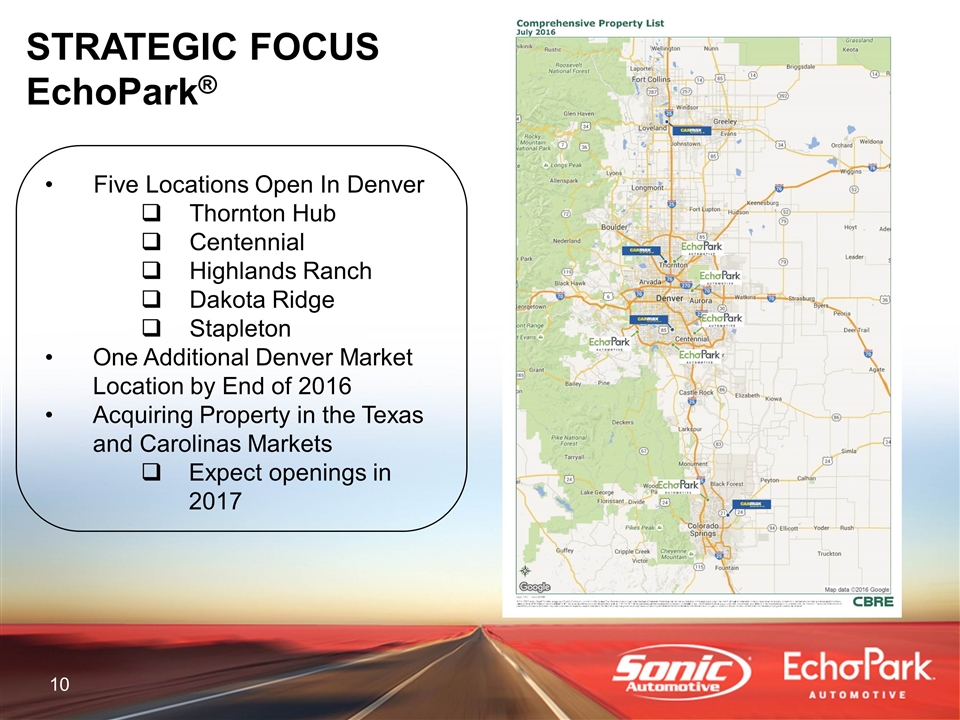
STRATEGIC FOCUS EchoPark® Five Locations Open In Denver Thornton Hub Centennial Highlands Ranch Dakota Ridge Stapleton One Additional Denver Market Location by End of 2016 Acquiring Property in the Texas and Carolinas Markets Expect openings in 2017
STRATEGIC FOCUS ACQUISITIONS & OPEN POINTS Open Points Mercedes Benz in Dallas Market Operational in 2016 Audi in Pensacola Market Operational in 2016 Nissan in TN Market Operational in late 2016 / early 2017 Exploring Acquisition and Open Point Opportunities in Other Markets
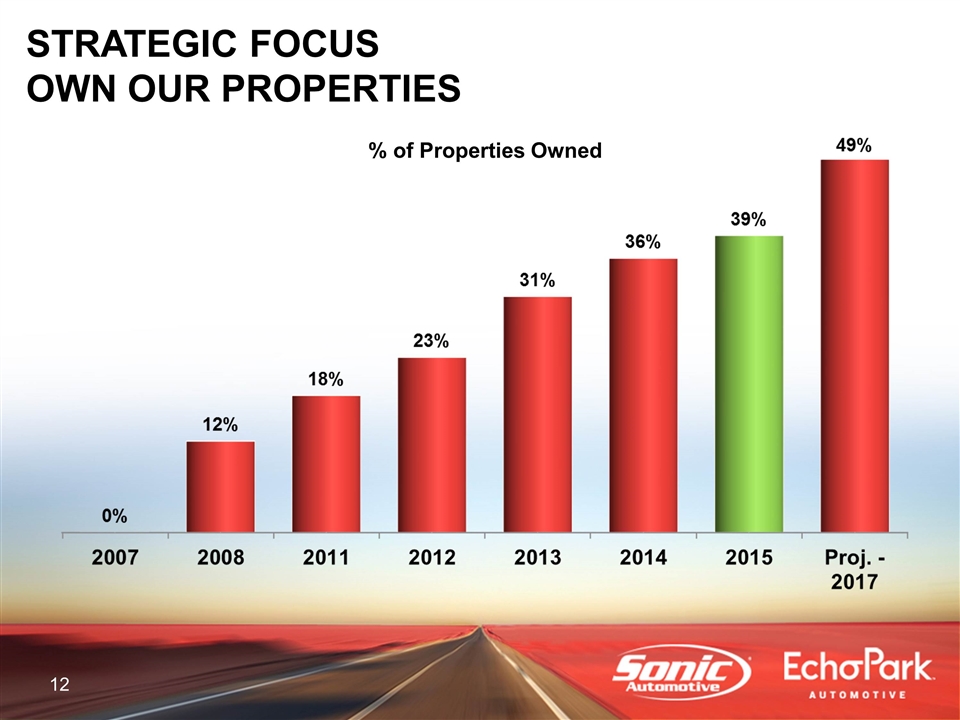
STRATEGIC FOCUS OWN OUR PROPERTIES % of Properties Owned

SHARE REPURCHASES Acquired 9.7% of OS in YTD Q2 New Share Count = 45.4M Down from High of 53.2M (Dec 2012) (amounts in thousands, except per share data) Shares $/Share $ Availability Q1 Activity 4,102 18.14 $ 74,414 $ 70,589 $ Q2 Activity 759 17.24 $ 13,090 $ 57,499 $ YTD 4,861 18.00 $ 87,504 $
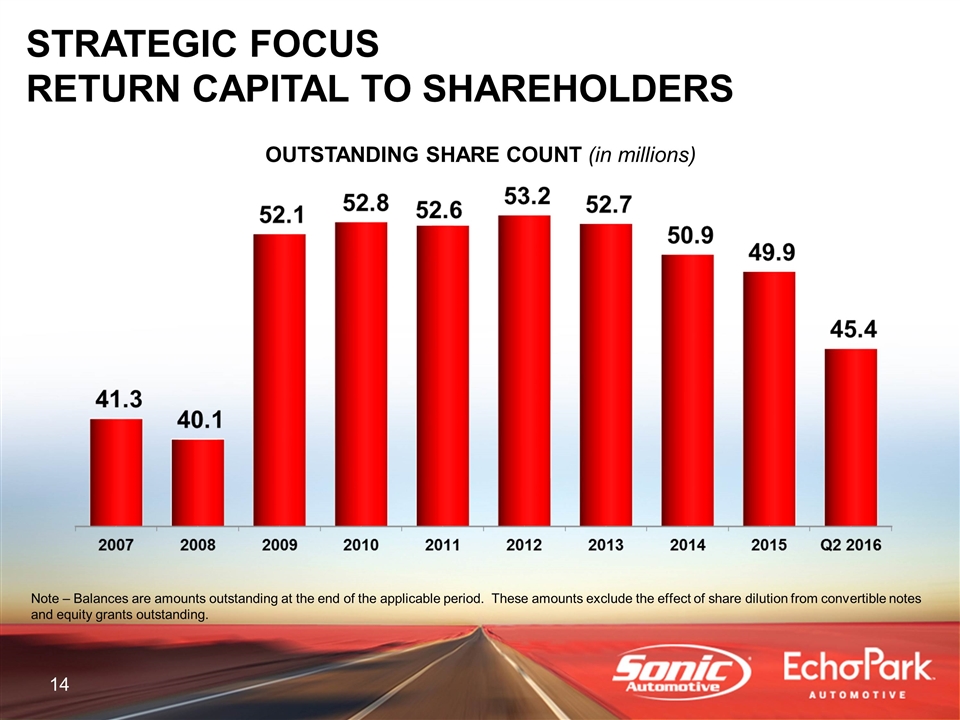
OUTSTANDING SHARE COUNT (in millions) Note – Balances are amounts outstanding at the end of the applicable period. These amounts exclude the effect of share dilution from convertible notes and equity grants outstanding. STRATEGIC FOCUS RETURN CAPITAL TO SHAREHOLDERS

Q2 2016 FINANCIAL REVIEW
Q2 2016 FINANCIAL REVIEW FRANCHISED SEGMENT
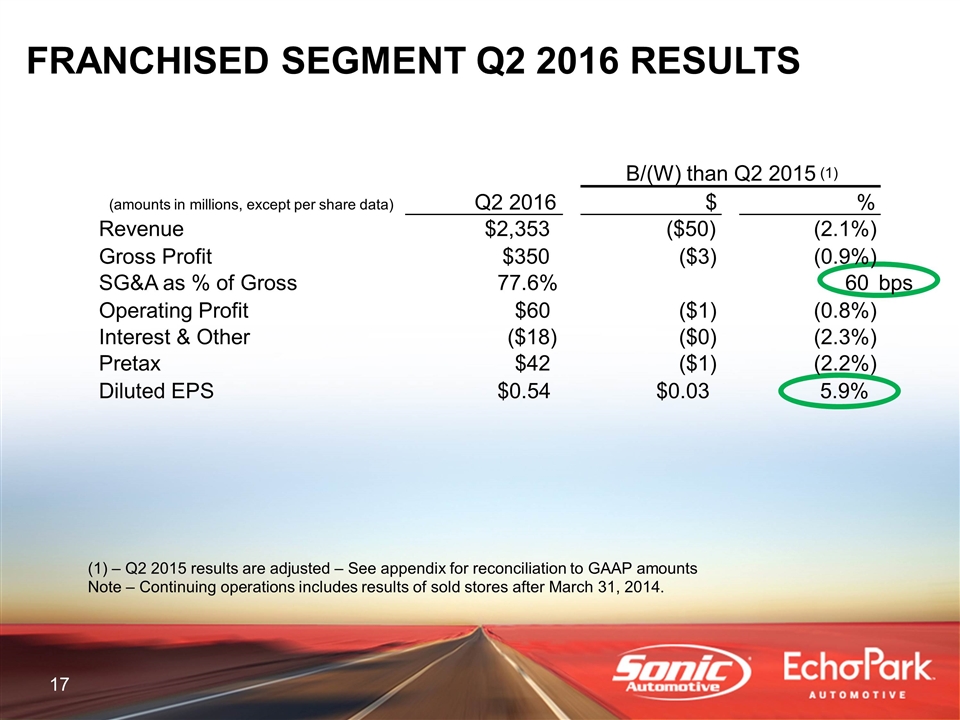
FRANCHISED SEGMENT Q2 2016 RESULTS – Q2 2015 results are adjusted – See appendix for reconciliation to GAAP amounts Note – Continuing operations includes results of sold stores after March 31, 2014. B/(W) than Q2 2015 (1) (amounts in millions, except per share data) Q2 2016 $ % Revenue $2,353 ($50) (2.1%) Gross Profit $350 ($3) (0.9%) SG&A as % of Gross 77.6% 60 bps Operating Profit $60 ($1) (0.8%) Interest & Other ($18) ($0) (2.3%) Pretax $42 ($1) (2.2%) Diluted EPS $0.54 $0.03 5.9%
Q2 2016 FINANCIAL REVIEW ECHOPARK® SEGMENT

ECHOPARK® SEGMENT Q2 2016 RESULTS – Q2 2015 is adjusted – See appendix for reconciliation to GAAP amounts B/(W) than Q2 2015 (1) (amounts in millions, except per share, unit and per unit data) Q2 2016 $ % Revenue $29 $8 40.5% Gross Profit $3 $1 30.2% Operating Profit ($3) $1 21.7% Interest & Other ($0) ($0) (26.2%) Pretax ($3) $1 17.9% Diluted EPS ($0.04) $0.01 20.0% Retail Units 1,136 255 28.9% GPU $1,042 ($227) (17.9%) F&I ($/unit) $1,140 $230 25.3%
Q2 2016 FINANCIAL REVIEW TOTAL ENTERPRISE
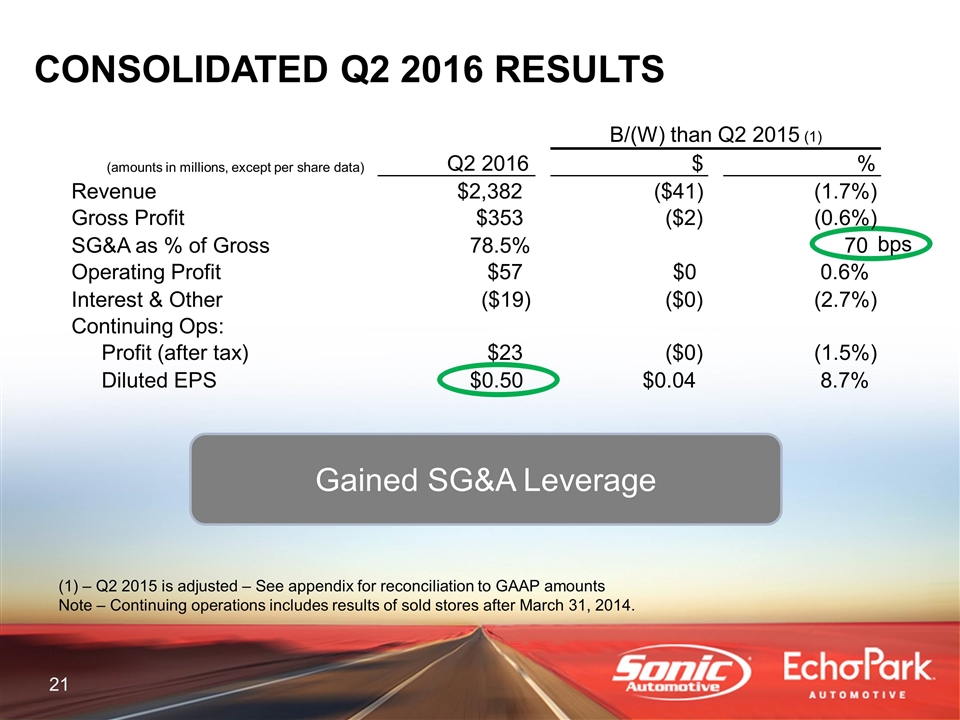
CONSOLIDATED Q2 2016 RESULTS Gained SG&A Leverage – Q2 2015 is adjusted – See appendix for reconciliation to GAAP amounts Note – Continuing operations includes results of sold stores after March 31, 2014. B/(W) than Q2 2015 (1) (amounts in millions, except per share data) Q2 2016 $ % Revenue $2,382 ($41) (1.7%) Gross Profit $353 ($2) (0.6%) SG&A as % of Gross 78.5% 70 bps Operating Profit $57 $0 0.6% Interest & Other ($19) ($0) (2.7%) Continuing Ops: Profit (after tax) $23 ($0) (1.5%) Diluted EPS $0.50 $0.04 8.7%
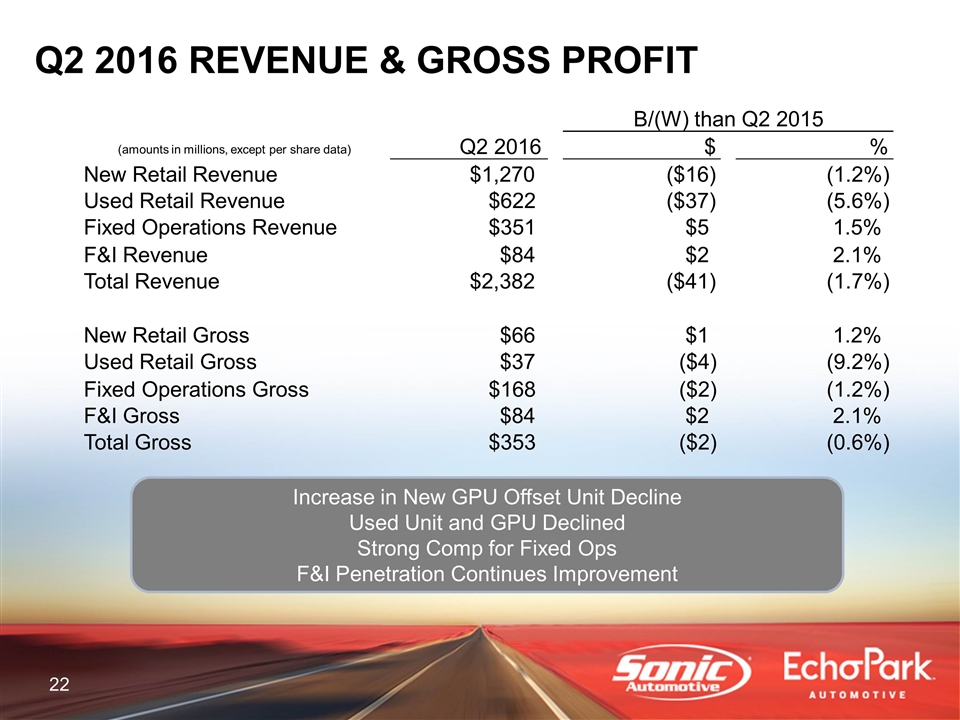
Q2 2016 REVENUE & GROSS PROFIT Increase in New GPU Offset Unit Decline Used Unit and GPU Declined Strong Comp for Fixed Ops F&I Penetration Continues Improvement B/(W) than Q2 2015 (amounts in millions, except per share data) Q2 2016 $ % New Retail Revenue $1,270 ($16) (1.2%) Used Retail Revenue $622 ($37) (5.6%) Fixed Operations Revenue $351 $5 1.5% F&I Revenue $84 $2 2.1% Total Revenue $2,382 ($41) (1.7%) New Retail Gross $66 $1 1.2% Used Retail Gross $37 ($4) (9.2%) Fixed Operations Gross $168 ($2) (1.2%) F&I Gross $84 $2 2.1% Total Gross $353 ($2) (0.6%)
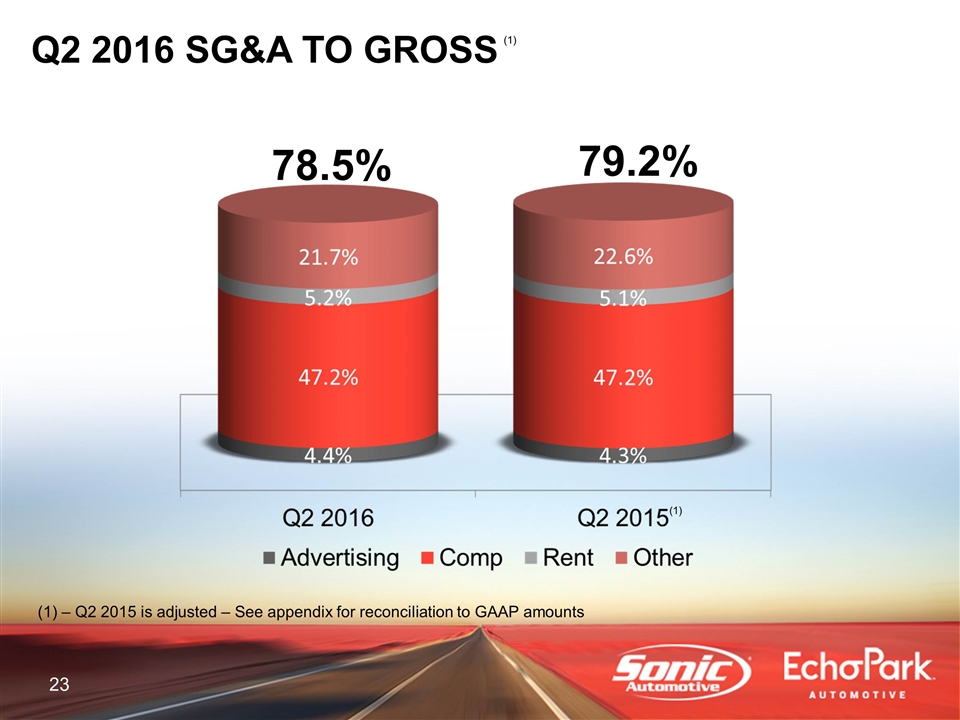
Q2 2016 SG&A TO GROSS 78.5% 79.2% (1) (1) – Q2 2015 is adjusted – See appendix for reconciliation to GAAP amounts
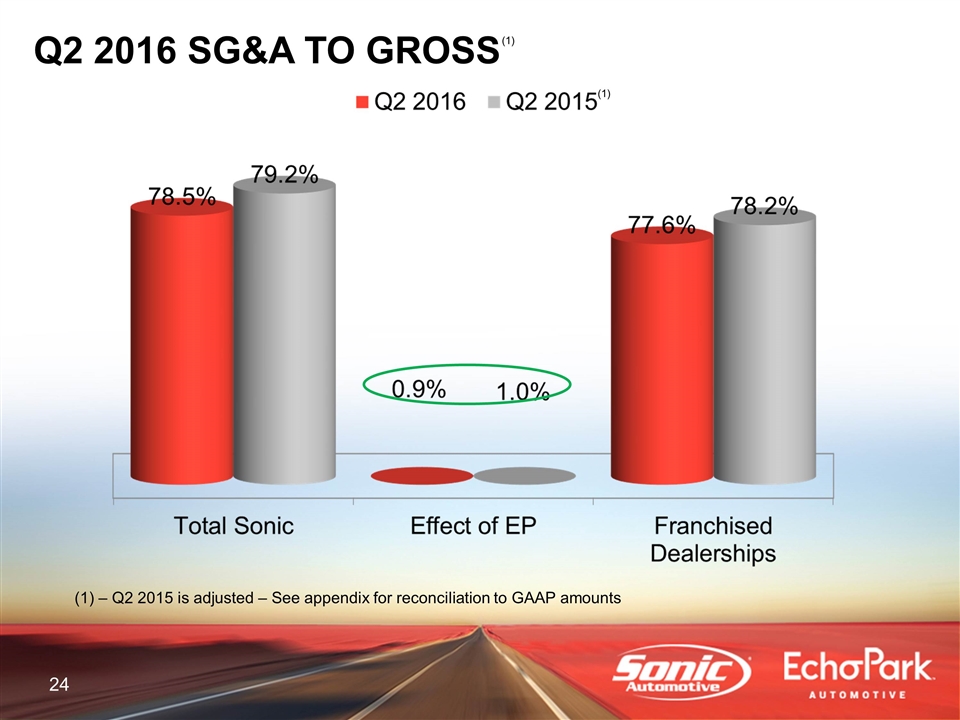
Q2 2016 SG&A TO GROSS (1) (1) – Q2 2015 is adjusted – See appendix for reconciliation to GAAP amounts

INTEREST EXPENSE Q2 2016 Floor Plan Increase Primarily Due to Higher Inventory Balances B/(W) than Q2 2015 (amounts in millions) Q2 2016 $ % Floor Plan Interest Expense $7 ($1) (25.2%) Interest Expense, Other $12 $1 6.5% Total Interest Expense $19 ($0) (2.7%)

2016 CAPEX (amounts in millions) YTD Q2 2016 Estimated 2016 Real Estate & Facility Related 94.6 $ 263.1 $ All Other Cap Ex 14.3 29.8 Subtotal 108.9 $ 292.9 $ Less: Mortgage Funding (1) (76.3) (176.3) Total Cash Used – Cap Ex 32.6 $ 116.6 $

DEBT COVENANTS Compliant with all Covenants Covenant Actual Q2 2016 Liquidity Ratio >= 1.05 1.17 Fixed Charge Coverage Ratio >= 1.20 1.77 Total Lease Adjusted Leverage Ratio <= 5.50 4.24
OPERATIONS REVIEW

NEW VEHICLE RETAIL SAME STORE PUR Gains Offset Lower Retail Volume (BMW drove total company new PUR up) Q2 2016 Q2 2015 B/(W) Retail Volume 33,229 34,352 (3.3%) Selling Price 38,215 $ 37,062 $ 3.1% Gross Margin % 5.2% 5.1% 10 bps GPU 1,977 $ 1,888 $ 89 $ Gross Profit 65.7 $ 64.9 $ 1.3% SAAR (in millions) 17.1 17.1 0.0%

NEW VEHICLE SAAR SAAR is flat Q2 to Q2 but slowing vs growing prior yr YTD Q2 2016 – 17.1M Full Year 2015 – 17.4M Full Year 2014 – 16.4M
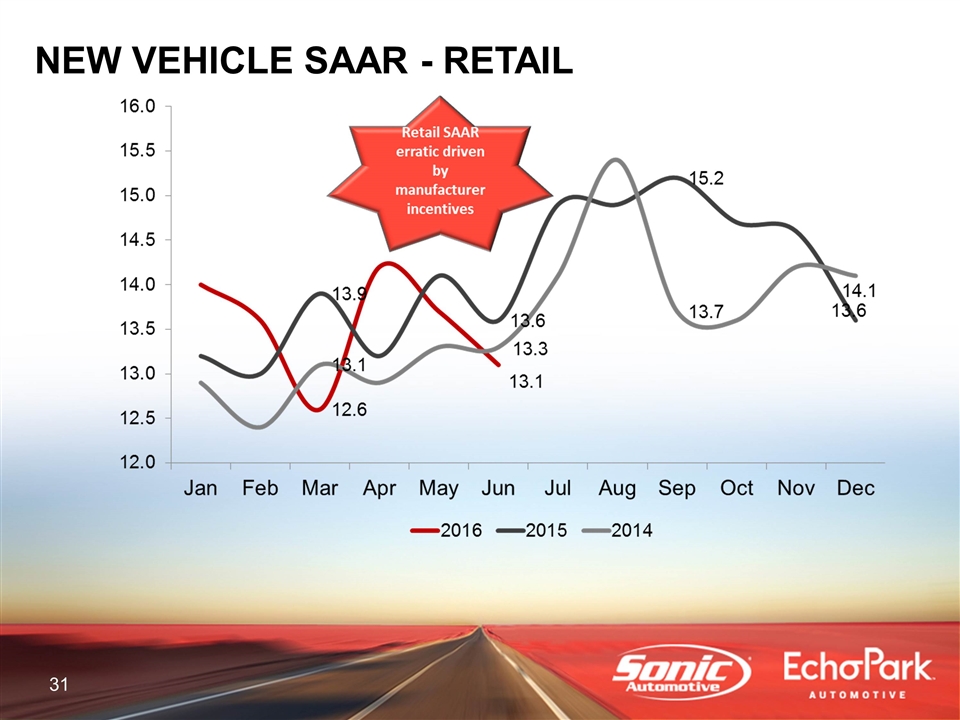
NEW VEHICLE SAAR - RETAIL

RETAIL NEW VEHICLE – GROSS & UNIT TREND Continuing Operations
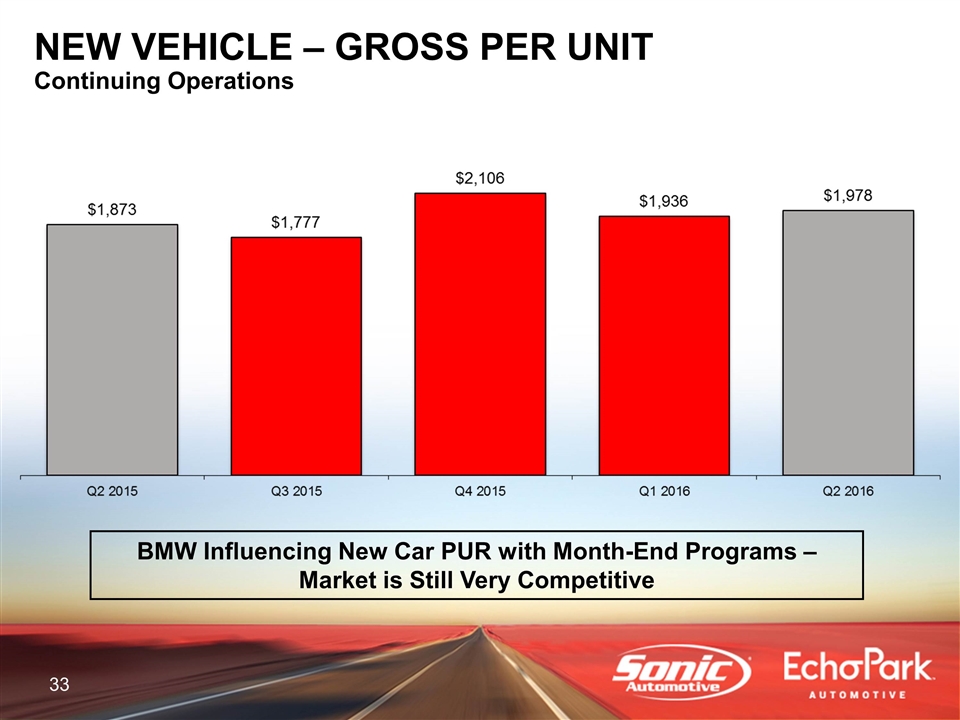
NEW VEHICLE – GROSS PER UNIT Continuing Operations BMW Influencing New Car PUR with Month-End Programs – Market is Still Very Competitive

VEHICLE DAYS SUPPLY 506 Stop-Sale New Units at 6/30 4,175 Stop-Sale Used Units at 6/30 – 35 Days Supply Without Stop-Sale
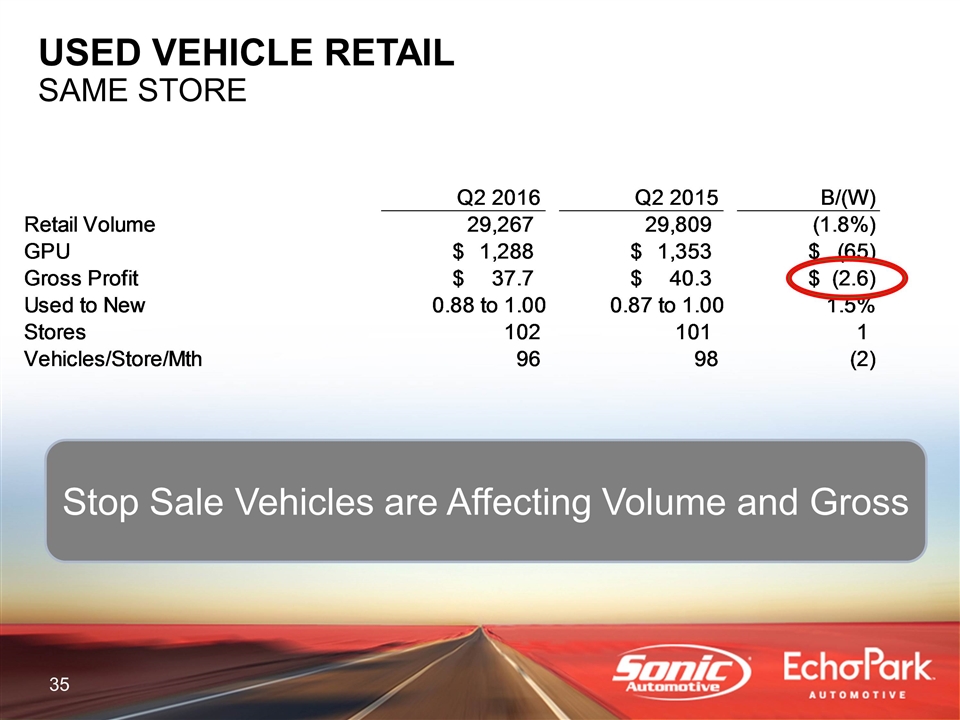
USED VEHICLE RETAIL SAME STORE Stop Sale Vehicles are Affecting Volume and Gross Q2 2016 Q2 2015 B/(W) Retail Volume 29,267 29,809 -1.8182428126% GPU $1,288.437369733727 $1,352.9112875305914 $-64.867550557218692 Gross Profit $37.697176049999698 $40.328932569999395 $-2.6317565199996968 Used to New 0.88 to 1.00 0.87 to 1.00 1.5% Stores 102 101 1 Vehicles/Store/Mth 96 98 -2 Vehicles per store/month (Keyed) $0 $0 0.0%

* - Used Related Gross = (Used Gross + F&I + Reconditioning) ($’s in millions) USED VEHICLE – GROSS TREND Continuing Operations Stop Sale Units are Impacting Results
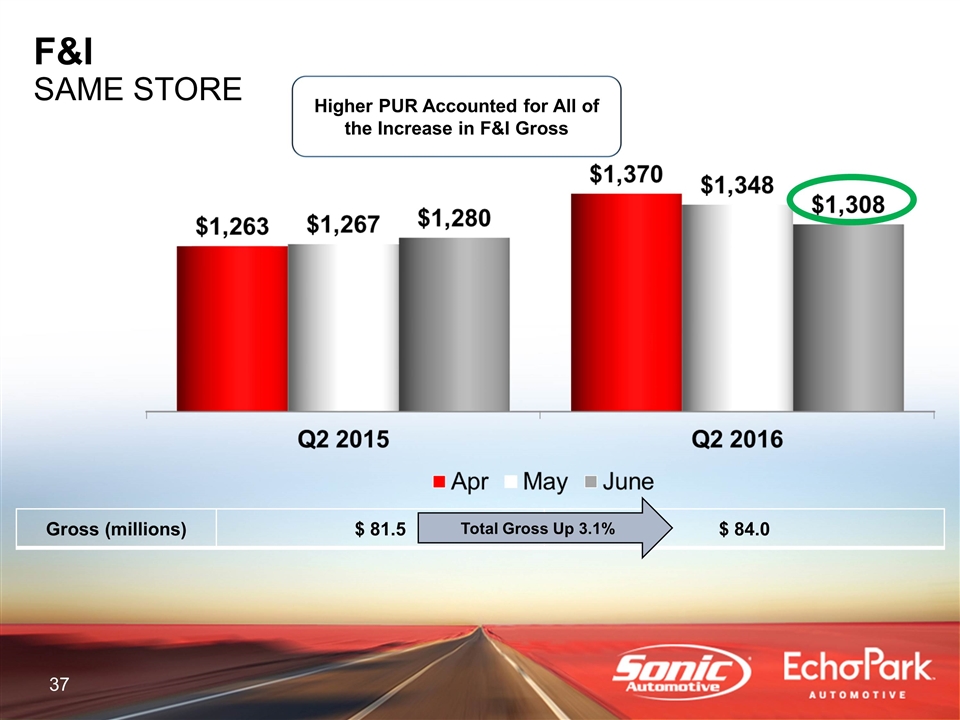
Higher PUR Accounted for All of the Increase in F&I Gross Gross (millions) $ 81.5 $ 84.0 F&I SAME STORE Total Gross Up 3.1%

F&I – GROSS & PUR TREND Continuing Operations

FIXED OPS SAME STORE Strong 2015 Comp in Warranty – High Labor Component in 2015 Q2 2016 Q2 2015 B/(W) Revenue $351.31016336999897 $341.03512471000101 3.1289747463% Gross Profit $168.13163195999999 $167.73099999999999 .2388538553% SAAR - Keyed $0 $0 0.0%
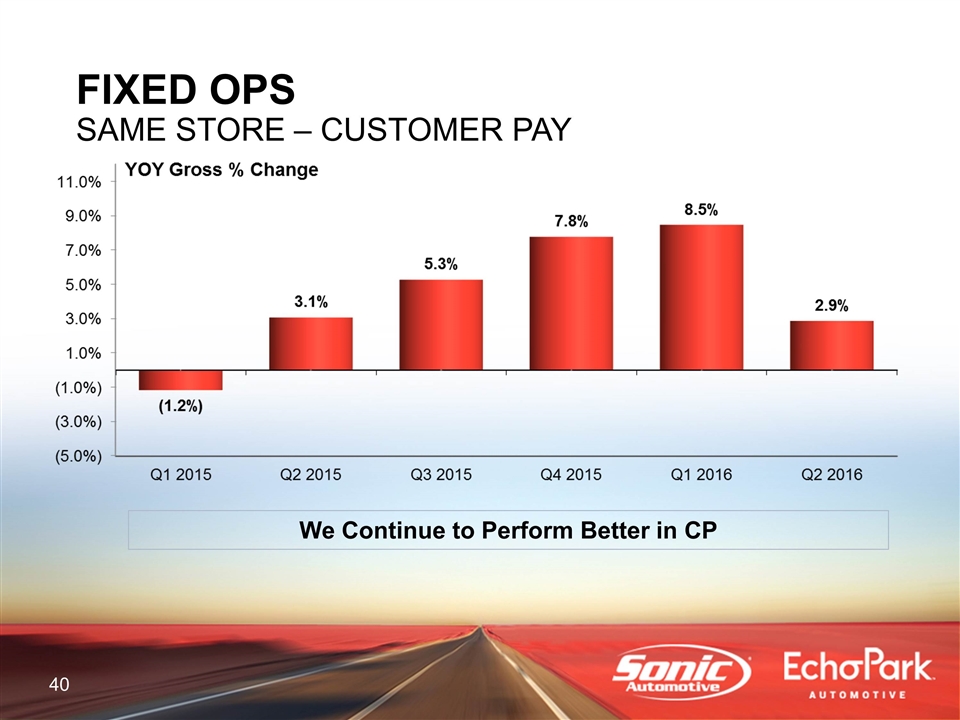
FIXED OPS SAME STORE – CUSTOMER PAY We Continue to Perform Better in CP
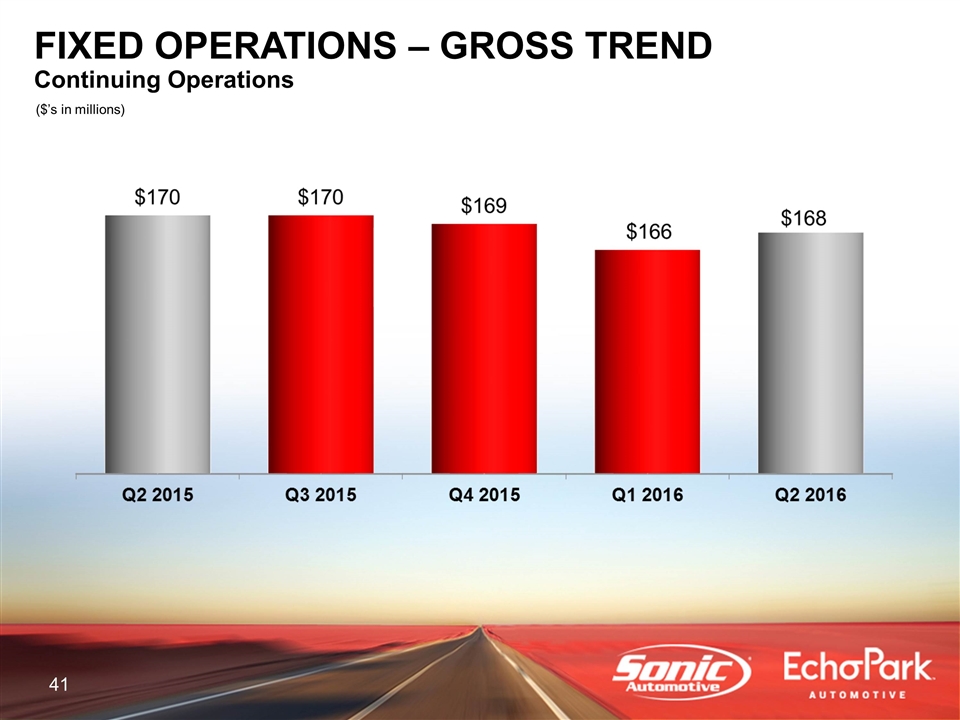
($’s in millions) FIXED OPERATIONS – GROSS TREND Continuing Operations

EchoPark® Opens 2 Denver market stores - entering 2 new markets – Texas & Carolinas Rolled out the OSOE Technologies to 14 Additional Stores (Chattanooga, Birmingham and Los Angeles Markets) Other Markets Will Follow Upon Completion of Migration Activities and Required Market/Brand Specific Technology Modifications Returned capital through stock purchases and dividend Plateauing top-line revenue and gross New vehicle GPU pressure continues – supply issues have improved Used environment is affected by stop-sell situation – volume and GPU affecting results Fixed operations and F&I continue to show strength Q3 2016 Adjusted Continuing Ops EPS Guidance of $0.52 - $0.54 Q4 2016 Adjusted Continuing Ops EPS Guidance of $0.66 - $0.69 SUMMARY

APPENDIX

NON-GAAP RECONCILIATIONS
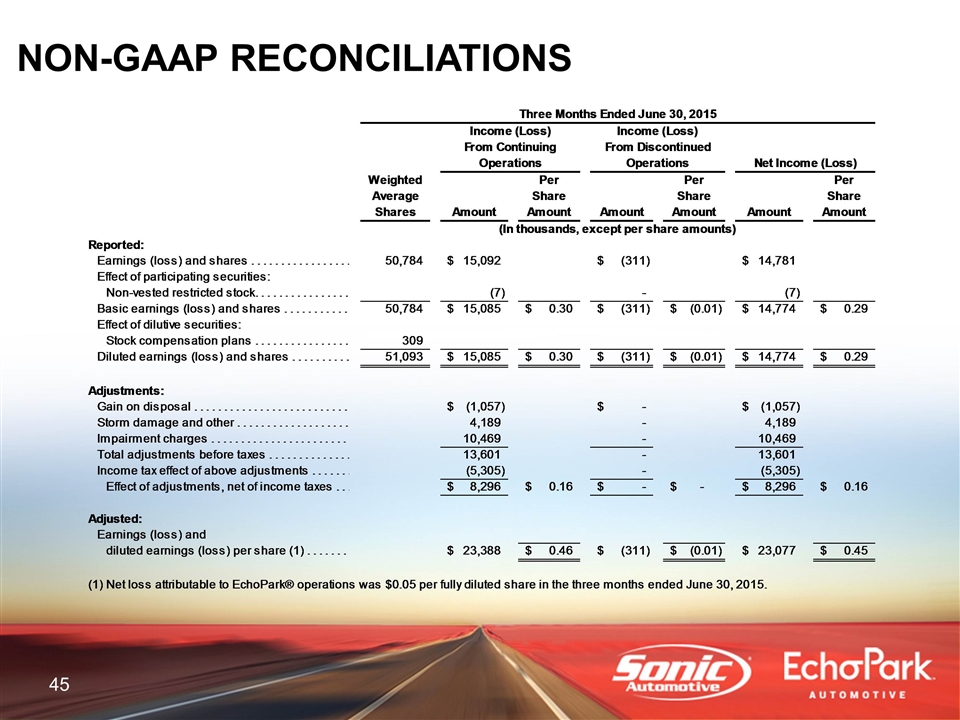
NON-GAAP RECONCILIATIONS
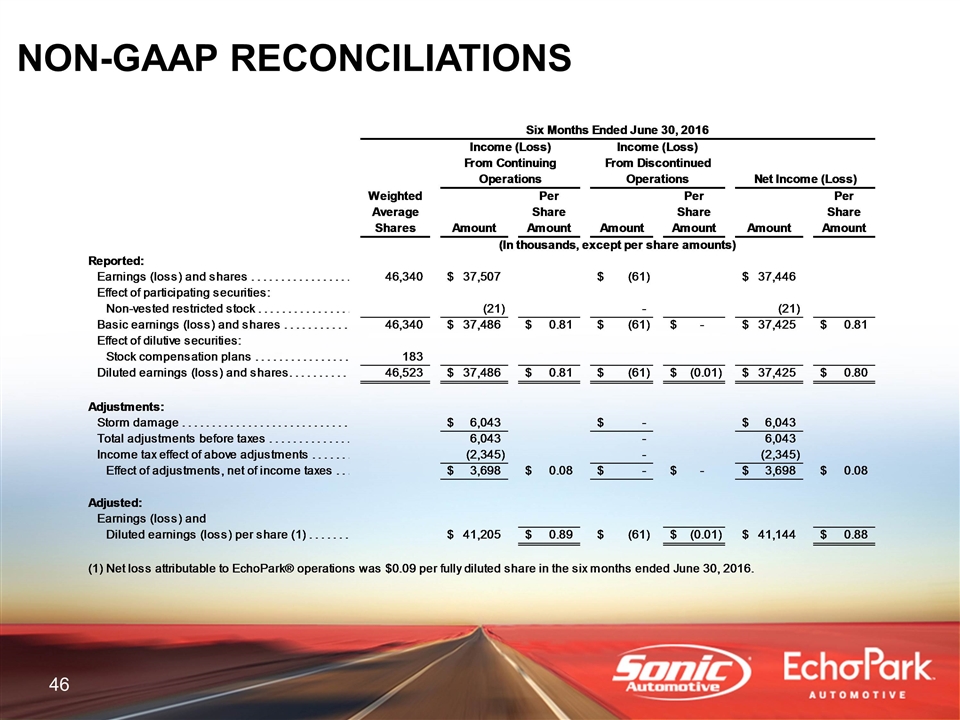
NON-GAAP RECONCILIATIONS
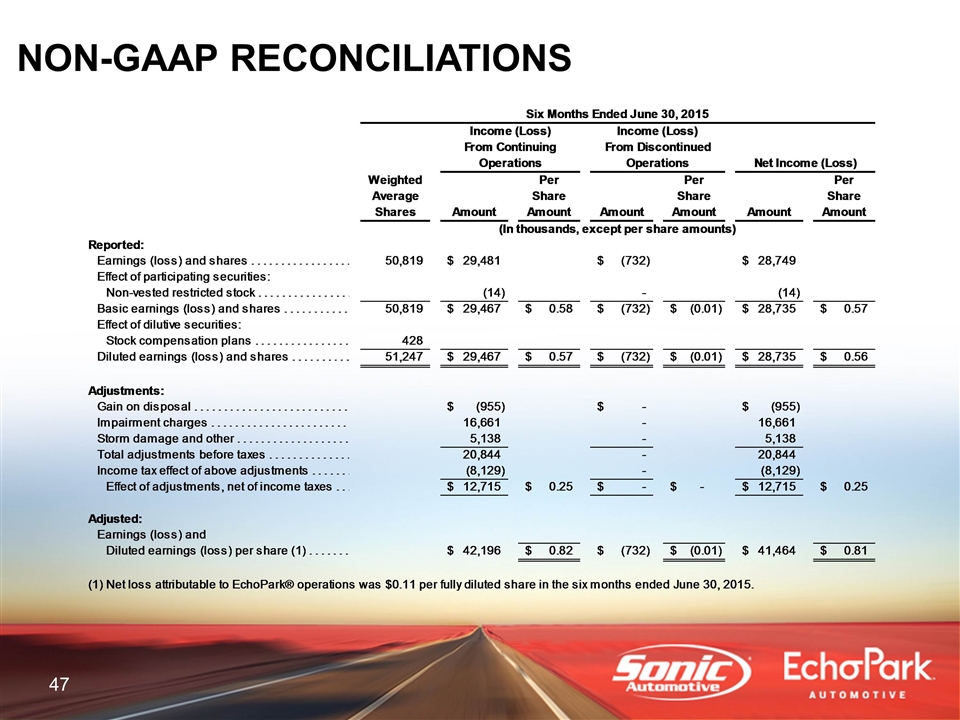
NON-GAAP RECONCILIATIONS
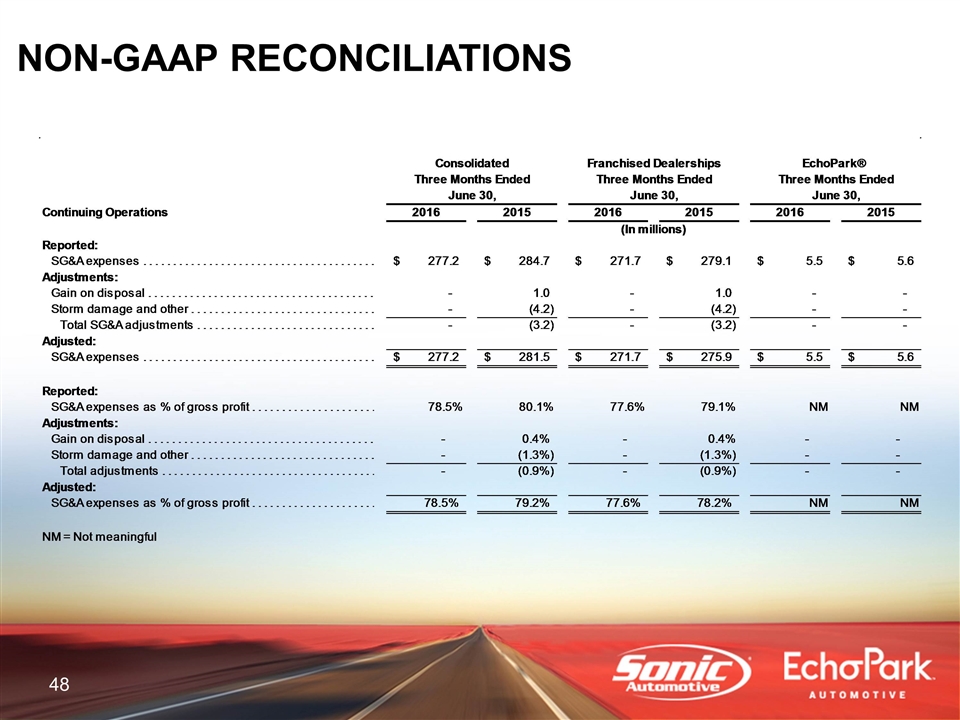
NON-GAAP RECONCILIATIONS
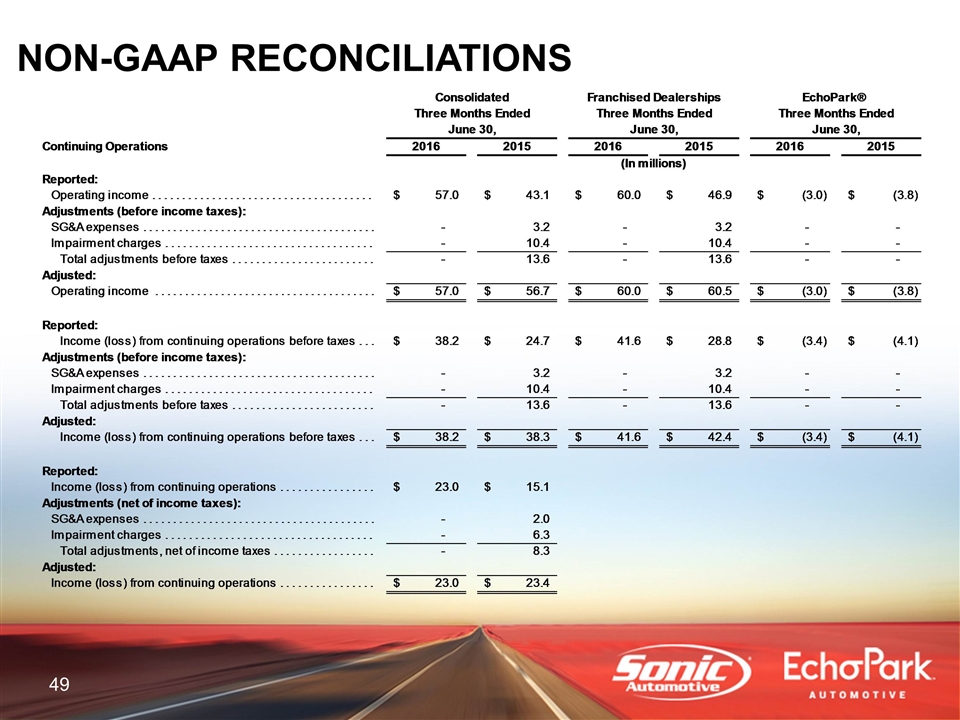
NON-GAAP RECONCILIATIONS

NON-GAAP RECONCILIATIONS
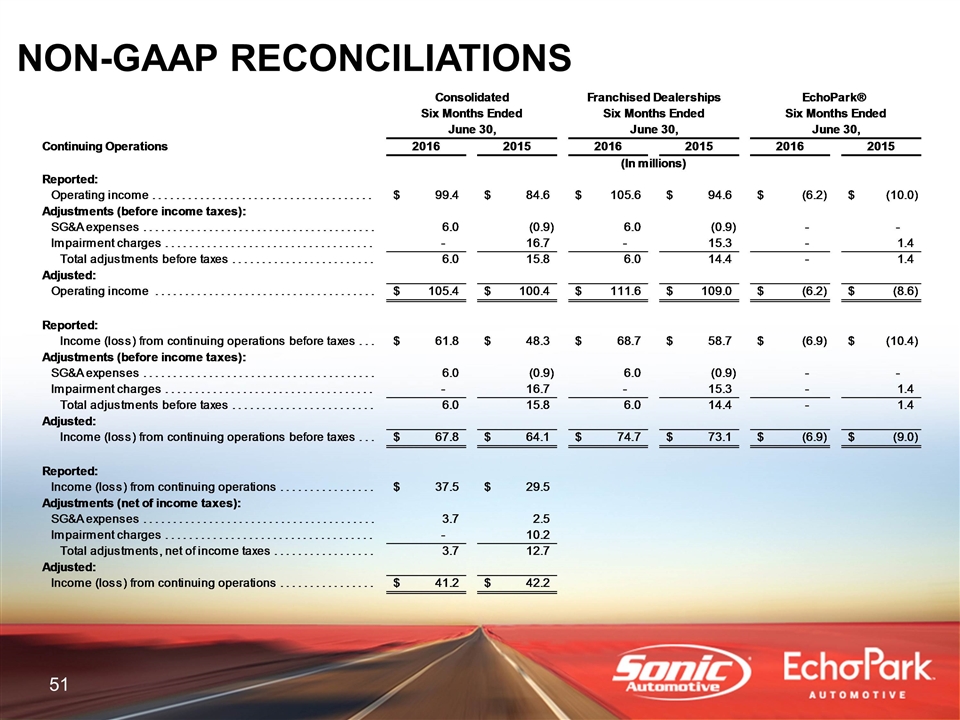
NON-GAAP RECONCILIATIONS
