
Q3 2016 Investor Presentation November 1, 2016 Exhibit 99.2
FORWARD-LOOKING STATEMENTS This presentation contains “forward-looking statements” within the meaning of the Private Securities Litigation Reform Act of 1995. These statements relate to future events, are not historical facts and are based on our current expectations and assumptions regarding our business, the economy and other future conditions. These statements can generally be identified by lead-in words such as “believe”, “expect”, “anticipate”, “intend”, “plan”, “foresee”, “may” ,”will” and other similar words. Statements that describe our Company’s objectives, plans or goals are also forward-looking statements. Examples of such forward-looking information we may be discussing in this presentation include, without limitation, anticipated 2016 industry new vehicle sales volume, the implementation of growth and operating strategies, including acquisitions of dealerships and properties, the development of open points and stand-alone pre-owned stores, the return of capital to shareholders, anticipated future success and impacts from the implementation of our strategic initiatives and earnings per share expectations. You are cautioned that these forward-looking statements are not guarantees of future performance, involve risks and uncertainties and actual results may differ materially from those projected in the forward-looking statements as a result of various factors. These risks and uncertainties include, among other things, (a) economic conditions in the markets in which we operate, (b) the success of our operational strategies, (c) our relationships with the automobile manufacturers, (d) new and pre-owned vehicle sales volume, and (e) earnings expectations for the year ending December 31, 2016. These risks and uncertainties, as well as additional factors that could affect our forward-looking statements, are described in our Form 10-K for the year ended December 31, 2015. These forward-looking statements, risks, uncertainties and additional factors speak only as of the date of this presentation. We undertake no obligation to update any such statements.

CONTENT OVERVIEW STRATEGIC FOCUS FINANCIAL REVIEW OPERATIONS REVIEW SUMMARY & OUTLOOK

COMPANY OVERVIEW
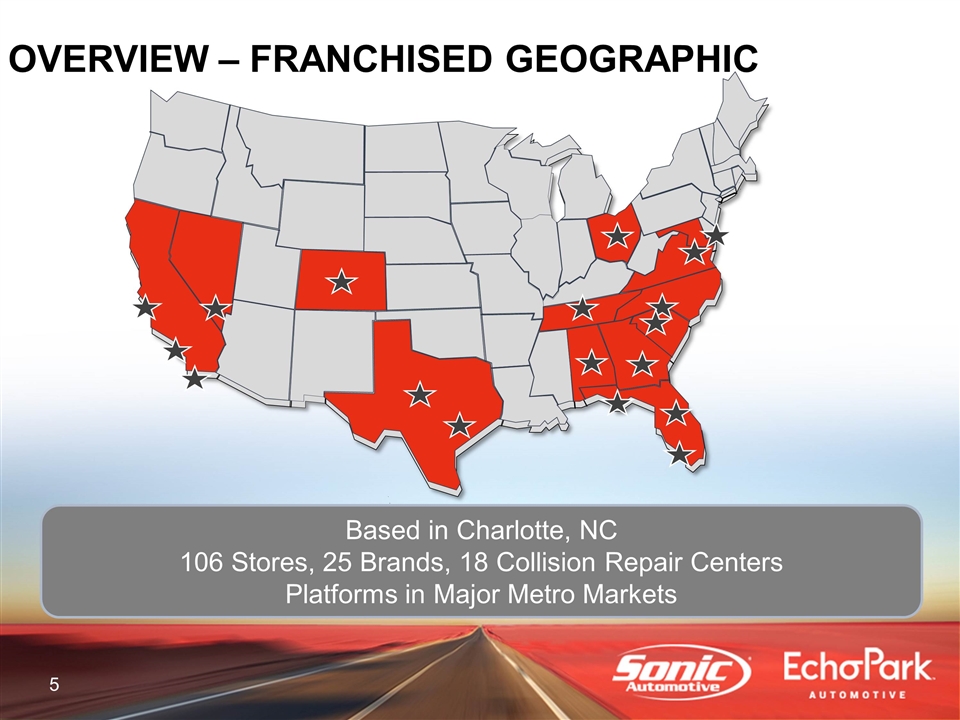
OVERVIEW – FRANCHISED GEOGRAPHIC Based in Charlotte, NC 106 Stores, 25 Brands, 18 Collision Repair Centers Platforms in Major Metro Markets
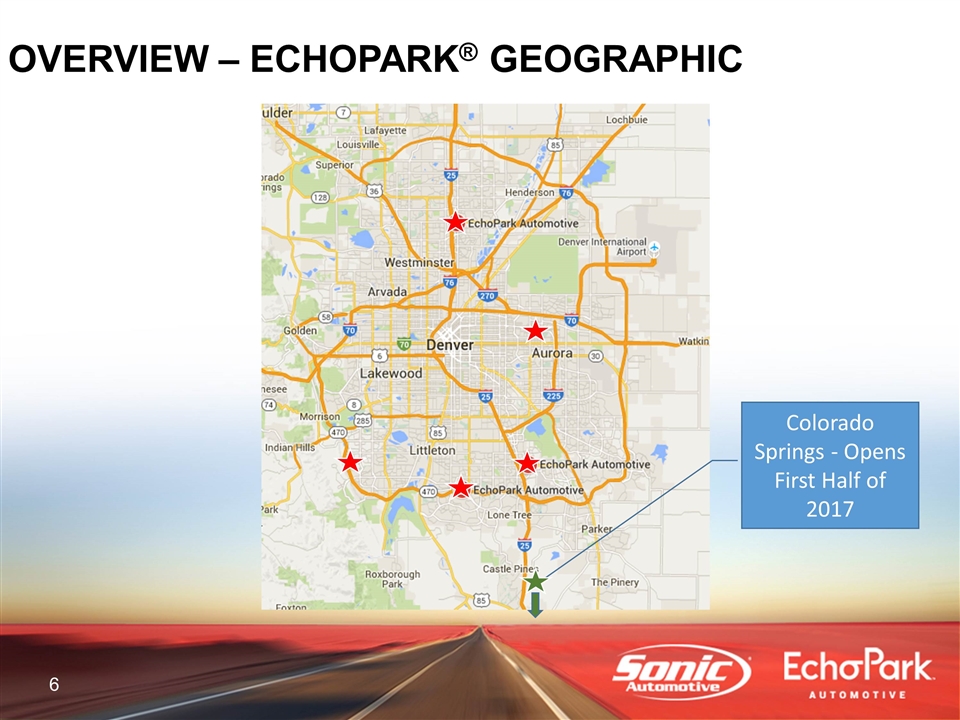
OVERVIEW – ECHOPARK® GEOGRAPHIC Colorado Springs - Opens First Half of 2017

Note: Percentages are percent of total revenue for FY 2015. Concentration in Major Metro Markets
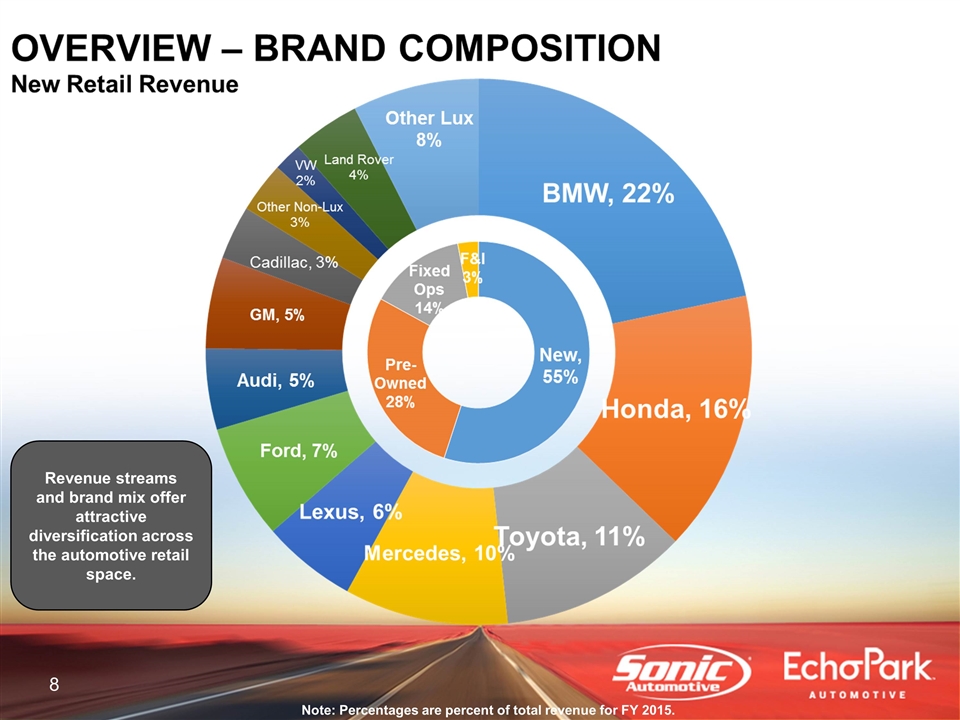
Revenue streams and brand mix offer attractive diversification across the automotive retail space. Note: Percentages are percent of total revenue for FY 2015.

STRATEGIC FOCUS
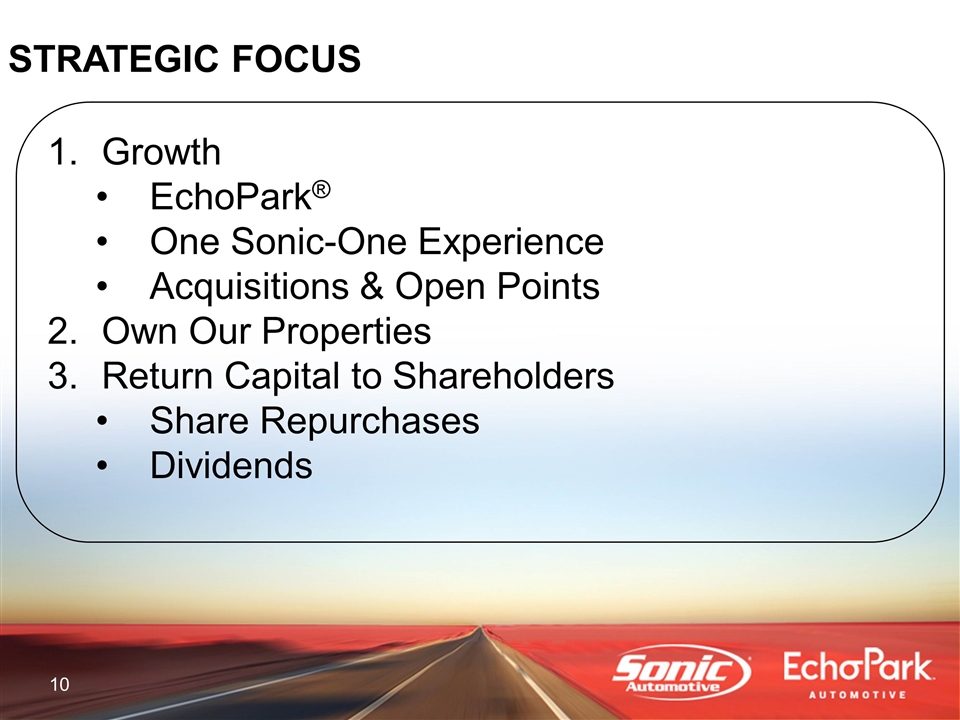
STRATEGIC FOCUS Growth EchoPark® One Sonic-One Experience Acquisitions & Open Points Own Our Properties Return Capital to Shareholders Share Repurchases Dividends
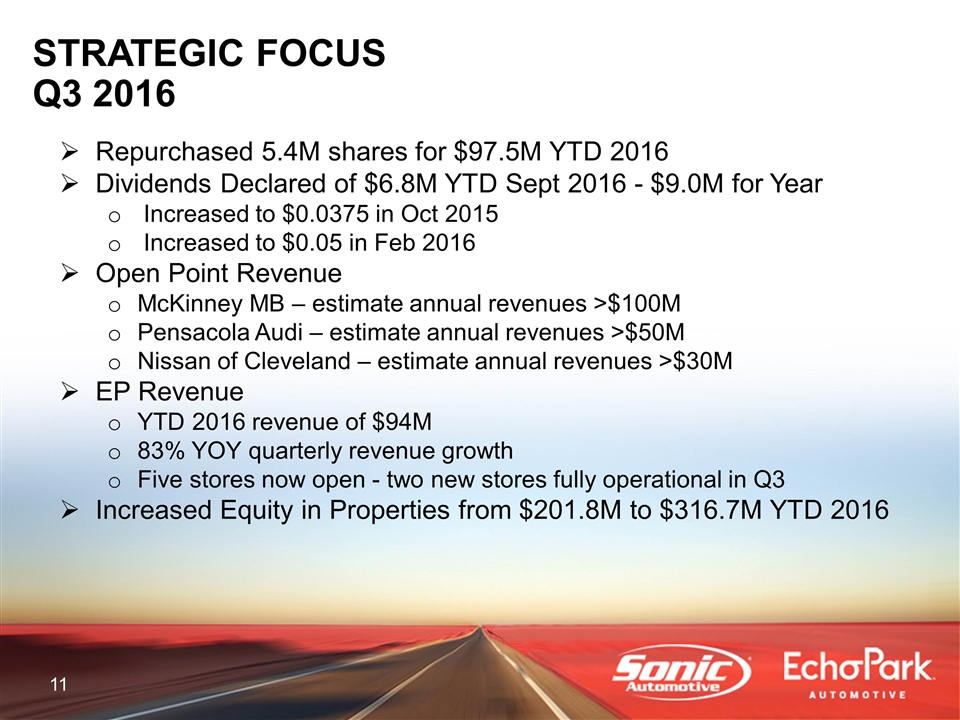
STRATEGIC FOCUS Q3 2016 Repurchased 5.4M shares for $97.5M YTD 2016 Dividends Declared of $6.8M YTD Sept 2016 - $9.0M for Year Increased to $0.0375 in Oct 2015 Increased to $0.05 in Feb 2016 Open Point Revenue McKinney MB – estimate annual revenues >$100M Pensacola Audi – estimate annual revenues >$50M Nissan of Cleveland – estimate annual revenues >$30M EP Revenue YTD 2016 revenue of $94M 83% YOY quarterly revenue growth Five stores now open - two new stores fully operational in Q3 Increased Equity in Properties from $201.8M to $316.7M YTD 2016
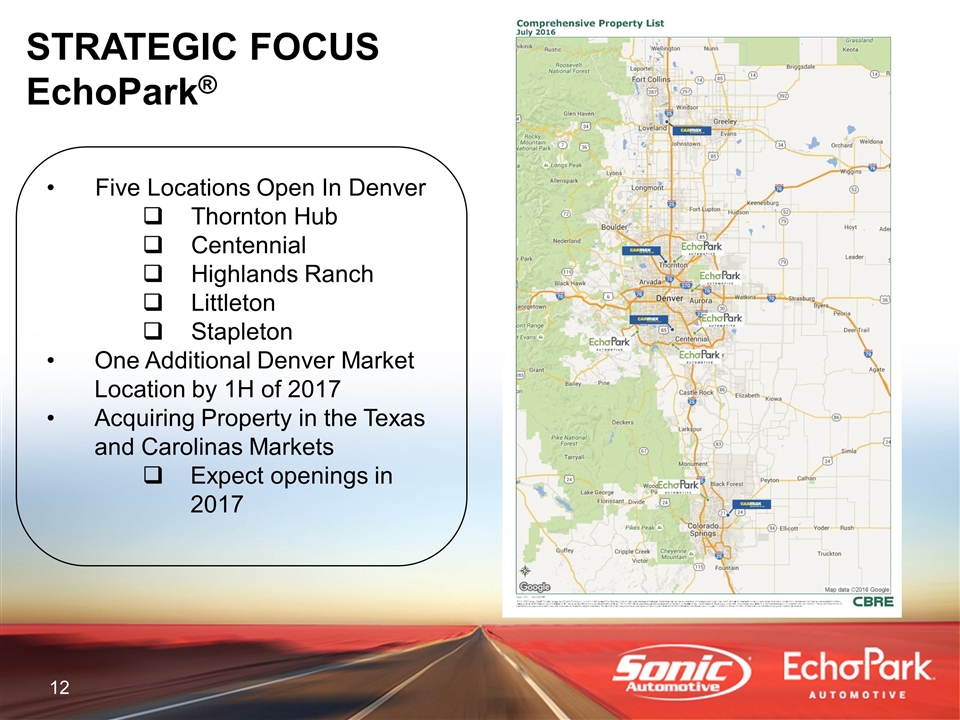
STRATEGIC FOCUS EchoPark® Five Locations Open In Denver Thornton Hub Centennial Highlands Ranch Littleton Stapleton One Additional Denver Market Location by 1H of 2017 Acquiring Property in the Texas and Carolinas Markets Expect openings in 2017
STRATEGIC FOCUS ONE SONIC-ONE EXPERIENCE (OSOE) Goals 1 Associate, 1 Price, 1 Hour Improve Transparency; Increase Trust Operational Efficiencies Grow Market Share Feed Fixed Operations Technology Being Introduced into Additional Markets (Charlotte was Pilot) CRM, Desking & Appraisal
STRATEGIC FOCUS ACQUISITIONS & OPEN POINTS Open Points Mercedes-Benz in Dallas Market Operational in Q3 2016 Audi in Pensacola Market Operational in 1H of 2017 Nissan in TN Market Operational in Q4 2016 Exploring Acquisition and Open Point Opportunities in Other Markets
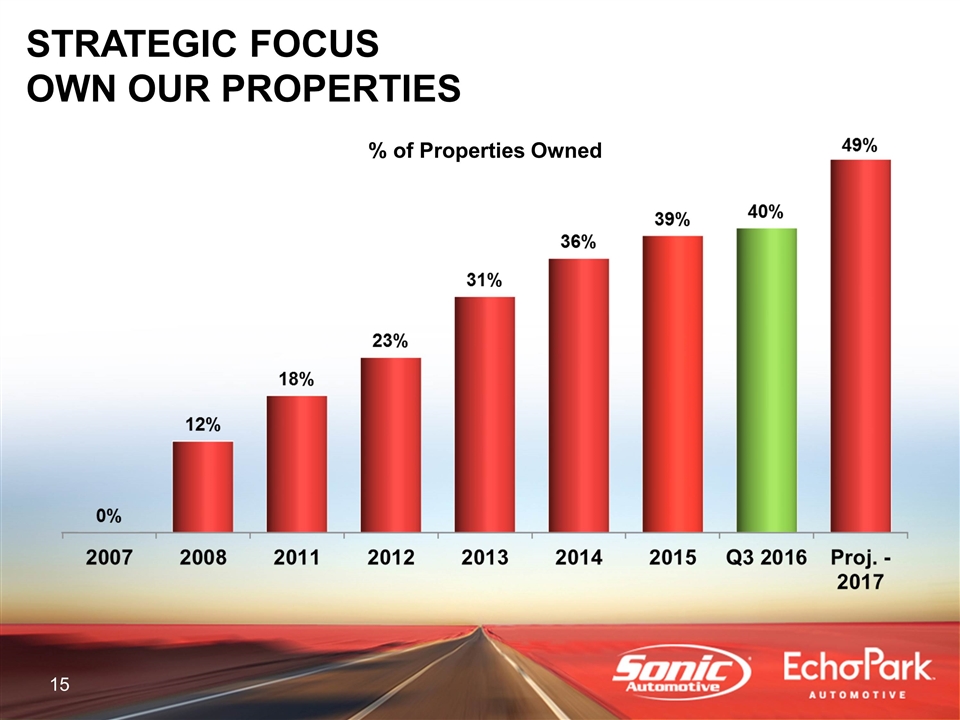
STRATEGIC FOCUS OWN OUR PROPERTIES % of Properties Owned
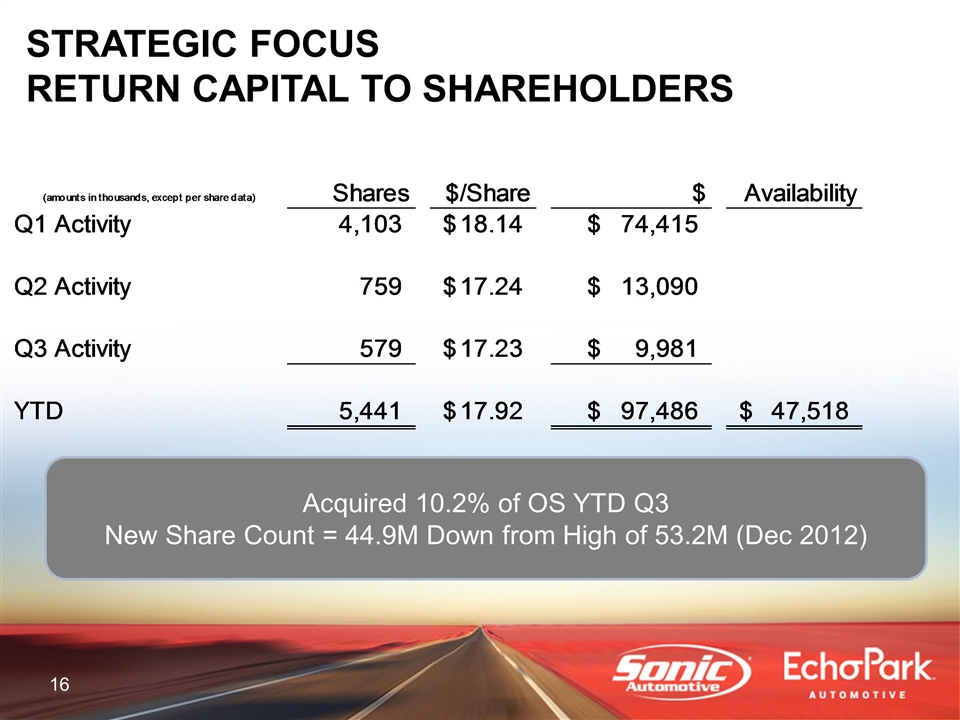
Acquired 10.2% of OS YTD Q3 New Share Count = 44.9M Down from High of 53.2M (Dec 2012) STRATEGIC FOCUS RETURN CAPITAL TO SHAREHOLDERS (amounts in thousands, except per share data) Shares $/Share $ Availability Q1 Activity 4,103 $18.14 $74,415 Q2 Activity 759 $17.239999999999998 $13,090 Q3 Activity 579 $17.23 $9,981 YTD 5,441 $17.916927035471421 $97,486 $47,518
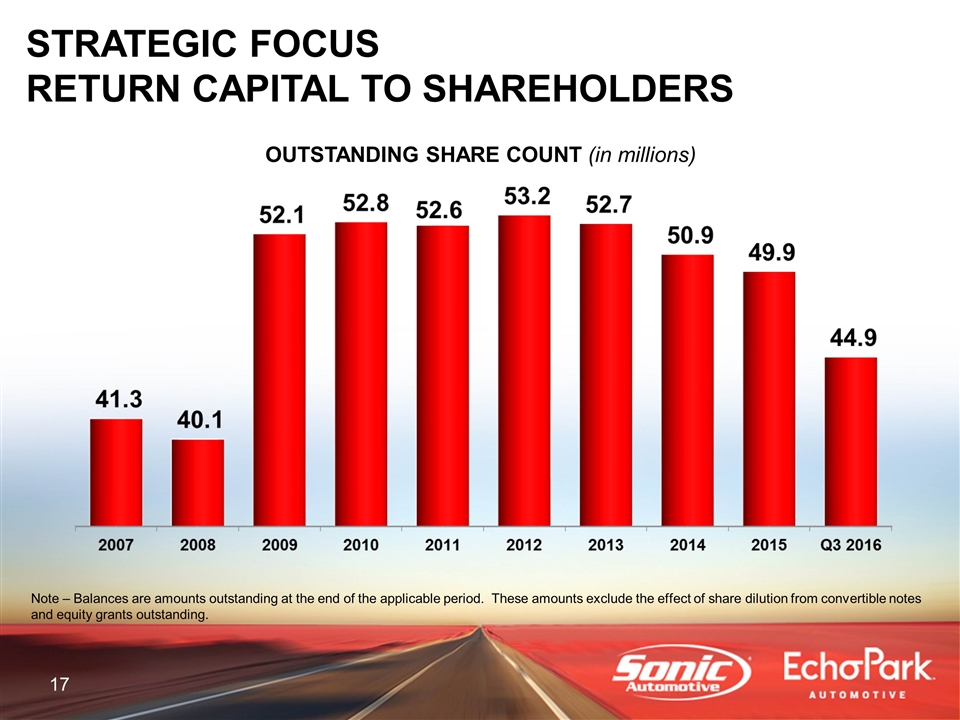
OUTSTANDING SHARE COUNT (in millions) Note – Balances are amounts outstanding at the end of the applicable period. These amounts exclude the effect of share dilution from convertible notes and equity grants outstanding. STRATEGIC FOCUS RETURN CAPITAL TO SHAREHOLDERS
Q3 2016 FINANCIAL REVIEW
Q3 2016 FINANCIAL REVIEW FRANCHISED SEGMENT
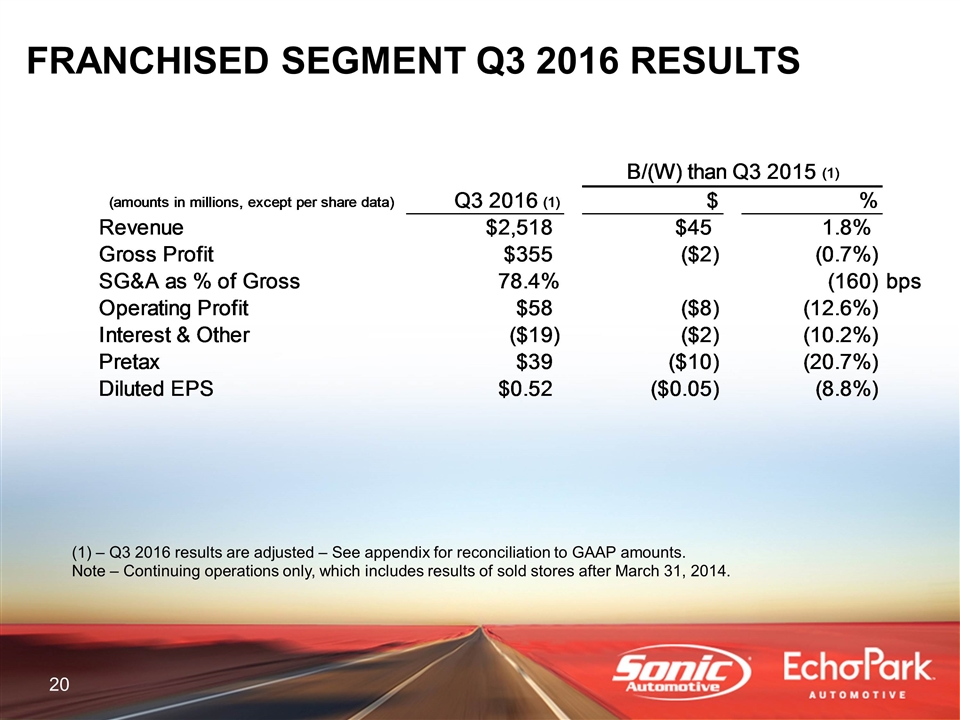
FRANCHISED SEGMENT Q3 2016 RESULTS – Q3 2016 results are adjusted – See appendix for reconciliation to GAAP amounts. Note – Continuing operations only, which includes results of sold stores after March 31, 2014. B/(W) than Q3 2015 (1) (amounts in millions, except per share data) Q3 2016 (1) $ % Revenue $2,517.5264066899999 $45.169001740030481 1.826960845127% Gross Profit $354.90492716500199 $-2.4581286450030166 -0.687851921187% SG&A as % of Gross 0.7836788783080163 -,160 bps Operating Profit $57.947791888364996 $-8.3614853481964957 -0.12609827307220528 Interest & Other $-19.185276129999998 $-1.7681772500000006 -0.10151961943733312 Pretax $38.762515758360301 $-10.129662598201598 -0.20718370378852385 Diluted EPS $0.52 $-0.05 -8.8% Diluted EPS Keyed $0.54 $0.03 5.9% 1700.0% 0.56999999999999995 0.52 4.9999999999999933E-2 8.7719298245613919E-2
Q3 2016 FINANCIAL REVIEW ECHOPARK® SEGMENT
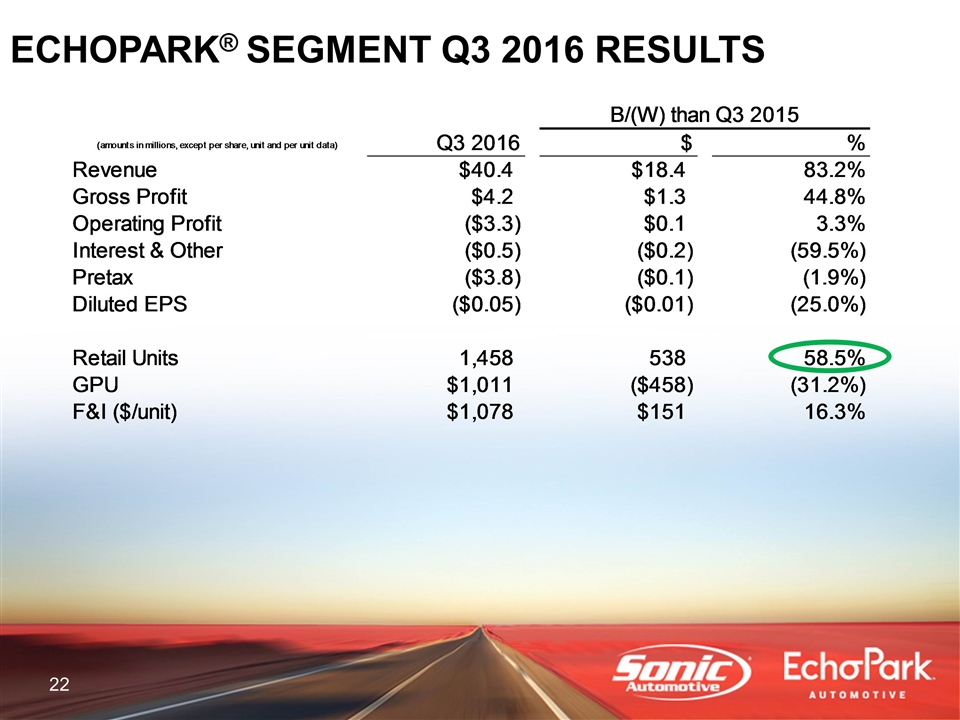
ECHOPARK® SEGMENT Q3 2016 RESULTS B/(W) than Q3 2015 (amounts in millions, except per share, unit and per unit data) Q3 2016 $ % Revenue $40.401229439999994 $18.350878429999995 0.83222613652171484 Gross Profit $4.1799412599999997 $1.2924492399999994 0.4476027054093813 Operating Profit $-3.2729912000000301 $0.11292872999997007 3.3352451427% Interest & Other $-0.49123960999999999 $-0.18321077999999993 -0.59478452065671883 Pretax $-3.7642308100000199 $-7.028205000002026E-2 -1.902626554% Diluted EPS $-0.05 $-0.01 -0.25 Retail Units 1,458 538 0.58478260869565213 GPU $1,011.348559670775 $-,458.27397293792058 -0.31183107414966499 F&I ($/unit) $1,078.299108367627 $151.41207575893145 0.16335547961307295 Diluted EPS Keyed $0 $0 0.0000000000% 0.16666666666666669 0.04 0.05 -1.0000000000000002E-2 -0.25000000000000006
Q3 2016 FINANCIAL REVIEW TOTAL ENTERPRISE
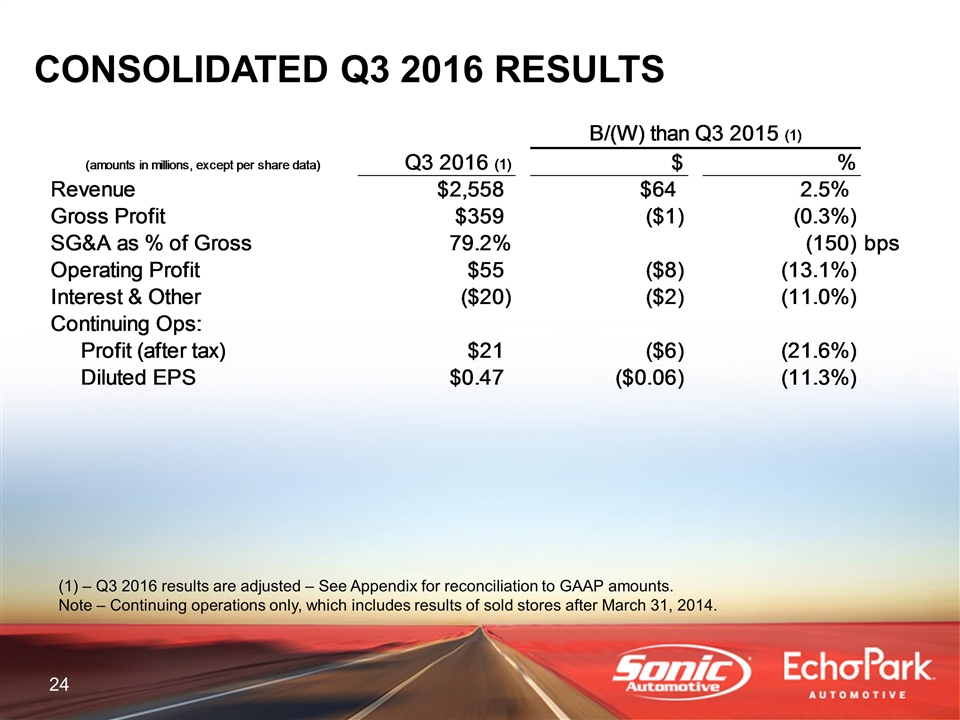
– Q3 2016 results are adjusted – See Appendix for reconciliation to GAAP amounts. Note – Continuing operations only, which includes results of sold stores after March 31, 2014. CONSOLIDATED Q3 2016 RESULTS B/(W) than Q3 2015 (1) (amounts in millions, except per share data) Q3 2016 (1) $ % Revenue $2,557.9276361300103 $63.519880170040295 2.54649144745% Gross Profit $359.084868425004 $-1.1656794049999444 -0.323574637713% SG&A as % of Gross 0.79224244439604397 -,150 bps Operating Profit $54.674800688363696 $-8.2485566181982062 -0.13108894647835348 Interest & Other $-19.676515739999999 $-1.9513880299999982 -0.11009162032153269 Continuing Ops: Profit (after tax) $21.243958248361 $-5.859323868199299 -0.21618503039597592 Diluted EPS $0.47 $-0.06 -0.113 Diluted EPS Keyed $0 $0 0.0000000000% 5.4054054054054057E-2 0.47 0.53 -6.0000000000000053E-2 -0.11320754716981142
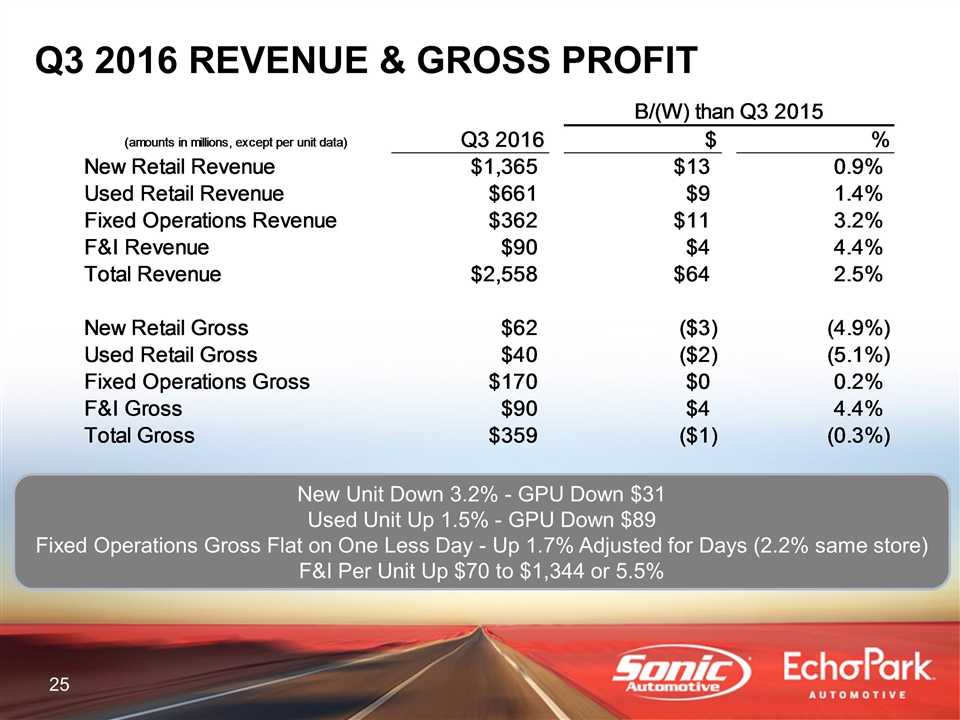
Q3 2016 REVENUE & GROSS PROFIT New Unit Down 3.2% - GPU Down $31 Used Unit Up 1.5% - GPU Down $89 Fixed Operations Gross Flat on One Less Day - Up 1.7% Adjusted for Days (2.2% same store) F&I Per Unit Up $70 to $1,344 or 5.5% B/(W) than Q3 2015 (amounts in millions, except per unit data) Q3 2016 $ % New Retail Revenue $1,364.84211516 $12.662512890010142 .936451997113% Used Retail Revenue $660.97433689999787 $8.9159466600008308 1.367354027408% Fixed Operations Revenue $361.70947245000099 $11.189429070002982 3.192236587131% F&I Revenue $89.578505899999499 $3.7490589899992921 4.368033495463% Total Revenue $2,557.9276361300103 $63.519880170040295 2.54649144745% New Retail Gross $62.352886380003497 $-3.2113759699906006 -4.898058568626% Used Retail Gross $39.621868215001498 $-2.1082942449971962 -5.522071343914% Fixed Operations Gross $170.00395411000002 $0.26668724000002841 .157117670691% F&I Gross $89.578505899999499 $3.7490589899992921 4.368033495463% Total Gross $359.084868425004 $-1.1656794049999444 -0.323574637713%
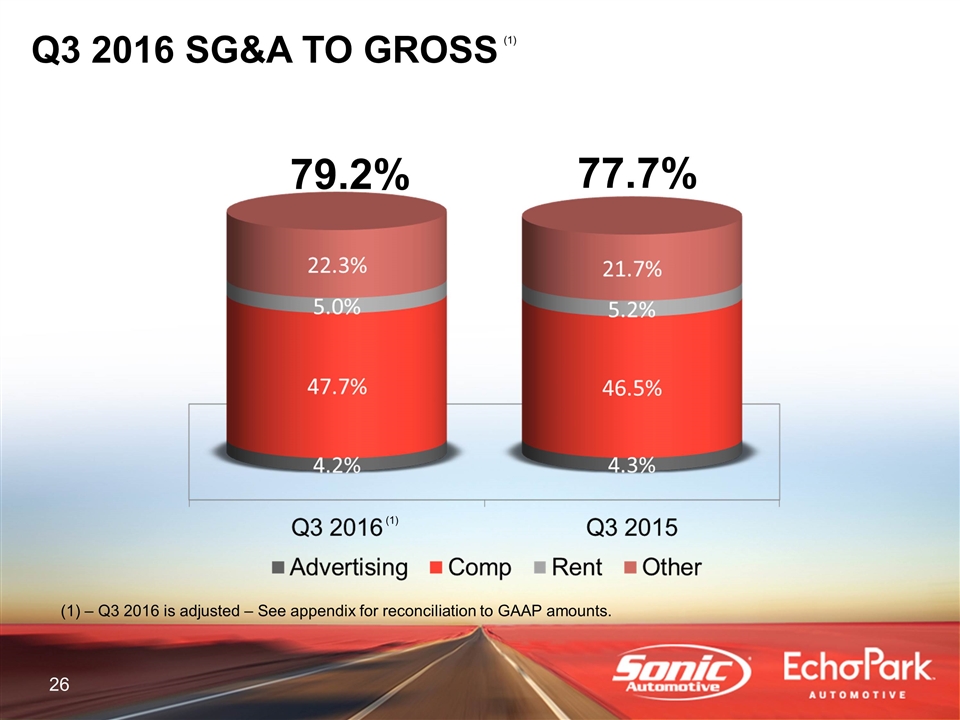
Q3 2016 SG&A TO GROSS 79.2% 77.7% – Q3 2016 is adjusted – See appendix for reconciliation to GAAP amounts. (1) (1)
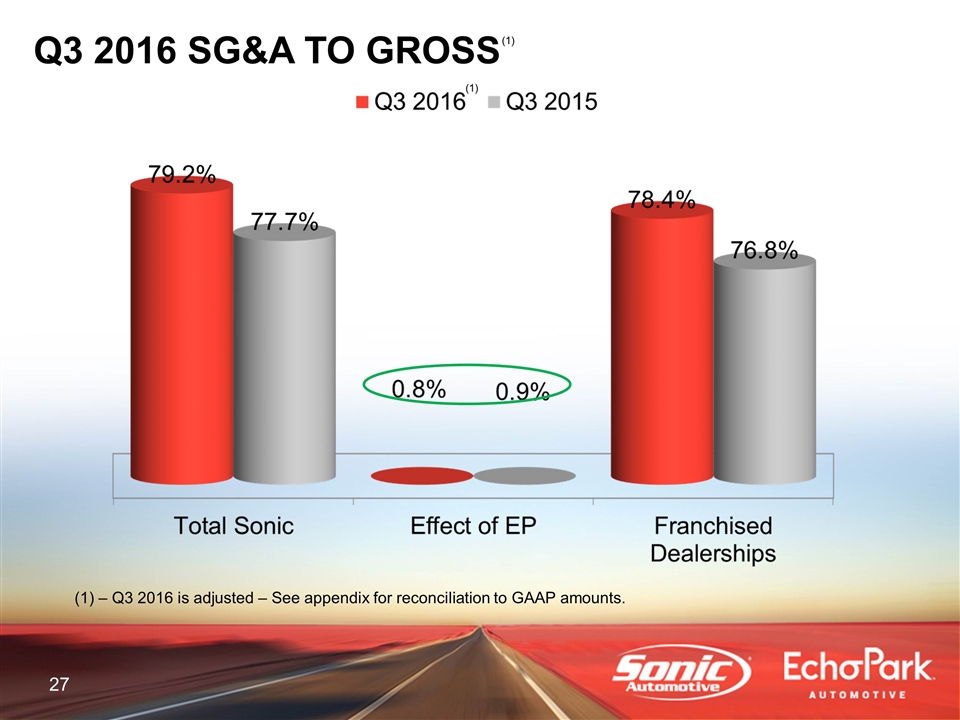
Q3 2016 SG&A TO GROSS – Q3 2016 is adjusted – See appendix for reconciliation to GAAP amounts. (1) (1)
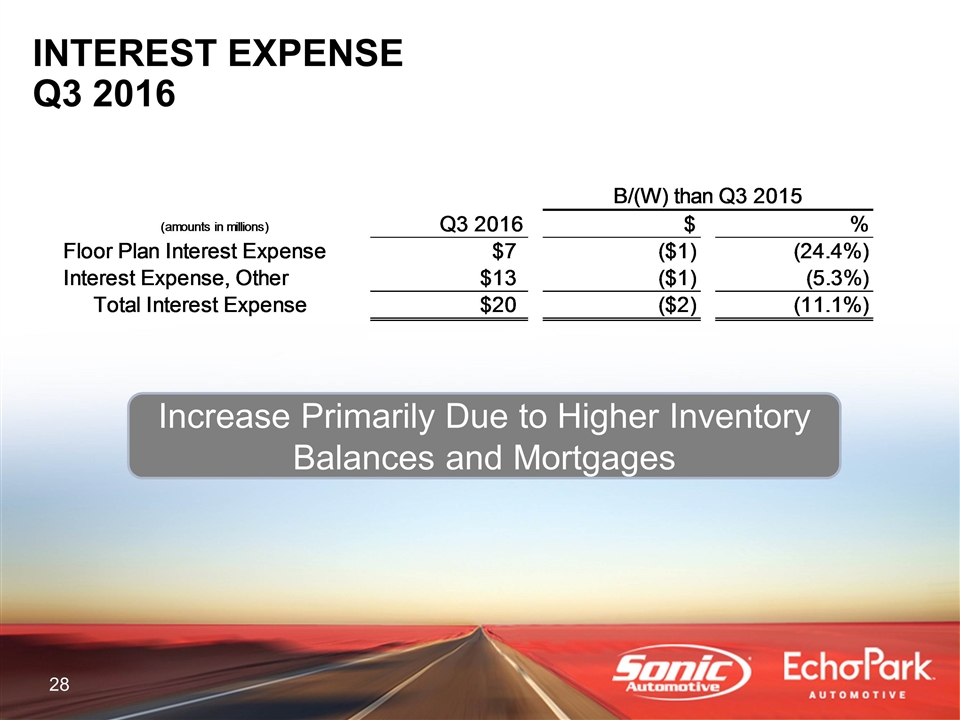
INTEREST EXPENSE Q3 2016 Increase Primarily Due to Higher Inventory Balances and Mortgages B/(W) than Q3 2015 (amounts in millions) Q3 2016 $ % Floor Plan Interest Expense $6.67207357000001 $-1.3079855000000089 -0.24384116795457625 Interest Expense, Other $13.0158422 $-0.65474677999999953 -5.296834606912% Total Interest Expense $19.687915770000007 $-1.9627322800000075 -0.11073128134934797
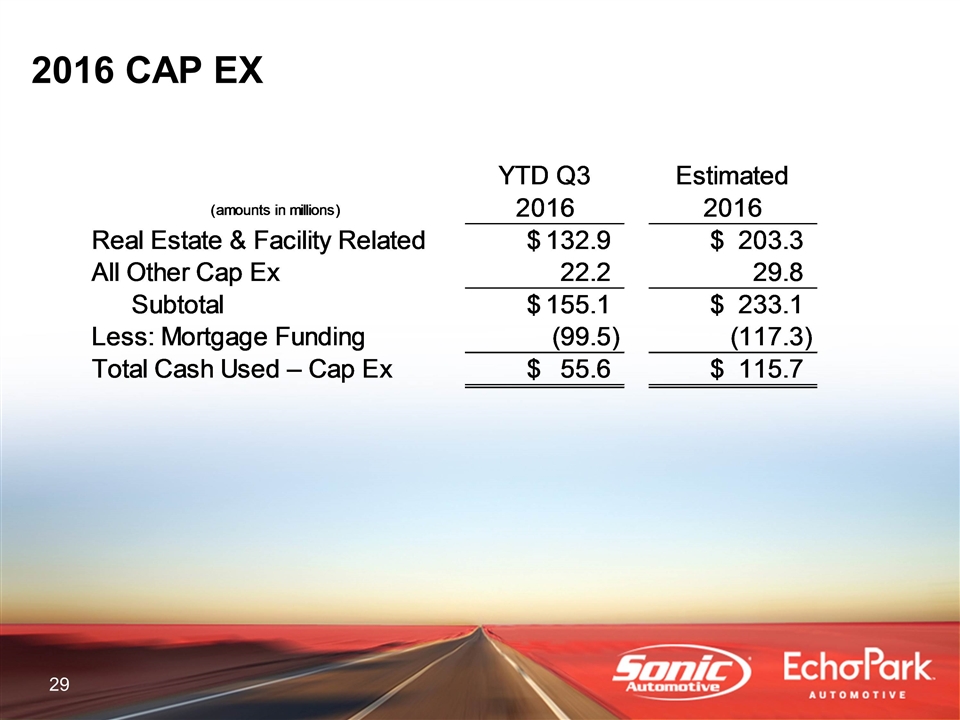
2016 CAP EX (amounts in millions) YTD Q3 2016 Estimated 2016 Real Estate & Facility Related $132.9 $203.25700000000001 All Other Cap Ex 22.2 29.797000000000004 Subtotal $155.1 $233.054 Less: Mortgage Funding -99.5 -,117.33499999999999 Total Cash Used – Cap Ex $55.599999999999994 $115.71900000000001
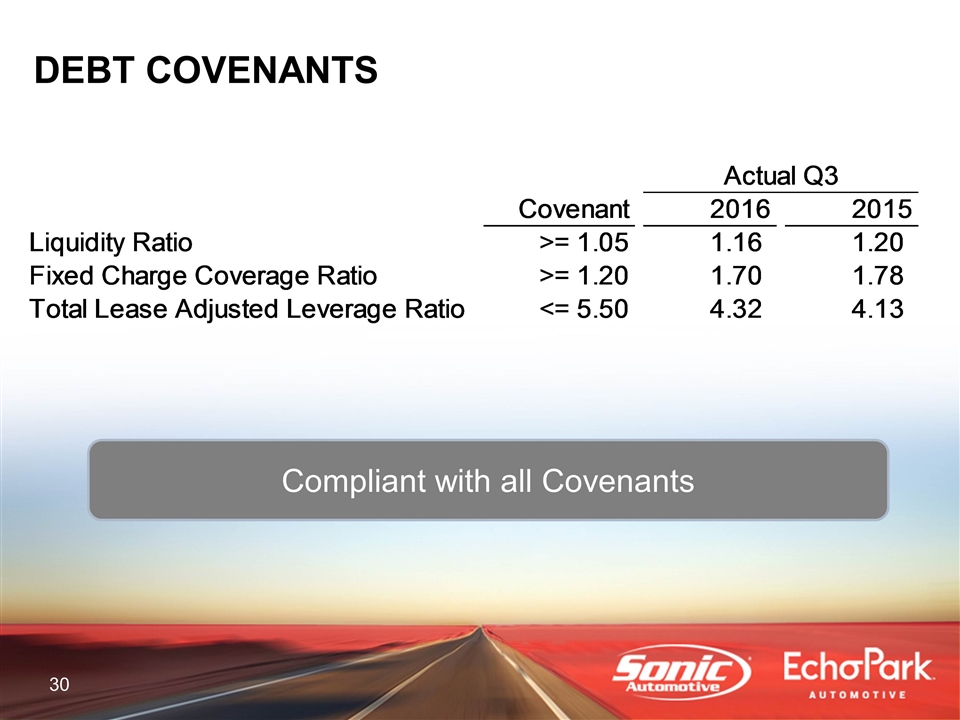
DEBT COVENANTS Compliant with all Covenants Actual Q3 Covenant 2016 2015 Liquidity Ratio >= 1.05 1.1599999999999999 1.2 Fixed Charge Coverage Ratio >= 1.20 1.7 1.78 Total Lease Adjusted Leverage Ratio <= 5.50 4.32 4.13

OPERATIONS REVIEW
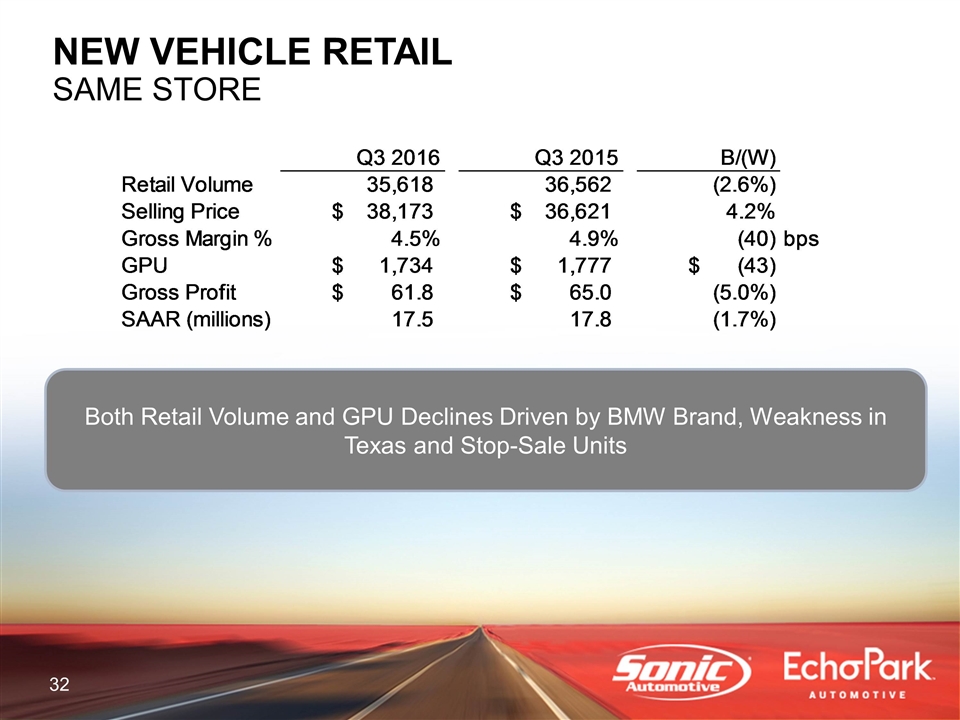
NEW VEHICLE RETAIL SAME STORE Both Retail Volume and GPU Declines Driven by BMW Brand, Weakness in Texas and Stop-Sale Units Q3 2016 Q3 2015 B/(W) Retail Volume 35,618 36,562 -2.5819156501% Selling Price $38,173.282193553823 $36,621.327003719714 4.2378453126% Gross Margin % 4.5% 4.9% -40 bps GPU $1,733.93140238092 $1,777.3286190578469 $-43.397216676926973 Gross Profit $61.759168690003598 $64.982688969993006 -4.9605830893% SAAR (millions) 17.5 17.8 -1.7% SAAR - Keyed 0 0 #DIV/0! 17.5 17.8 -0.30000000000000071 -1.7%
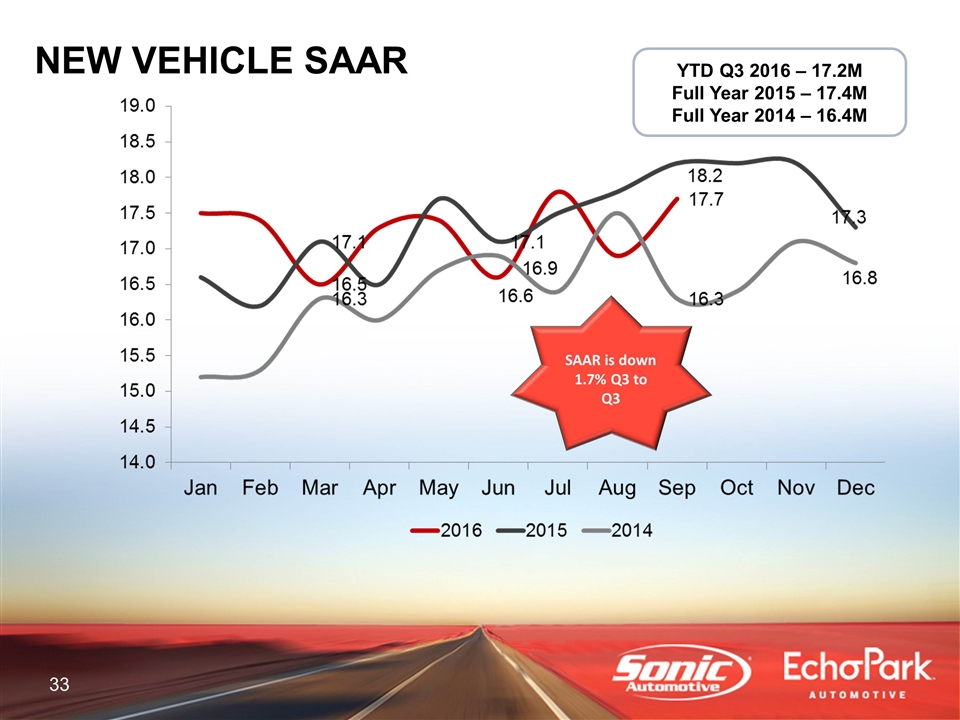
NEW VEHICLE SAAR SAAR is down 1.7% Q3 to Q3 YTD Q3 2016 – 17.2M Full Year 2015 – 17.4M Full Year 2014 – 16.4M
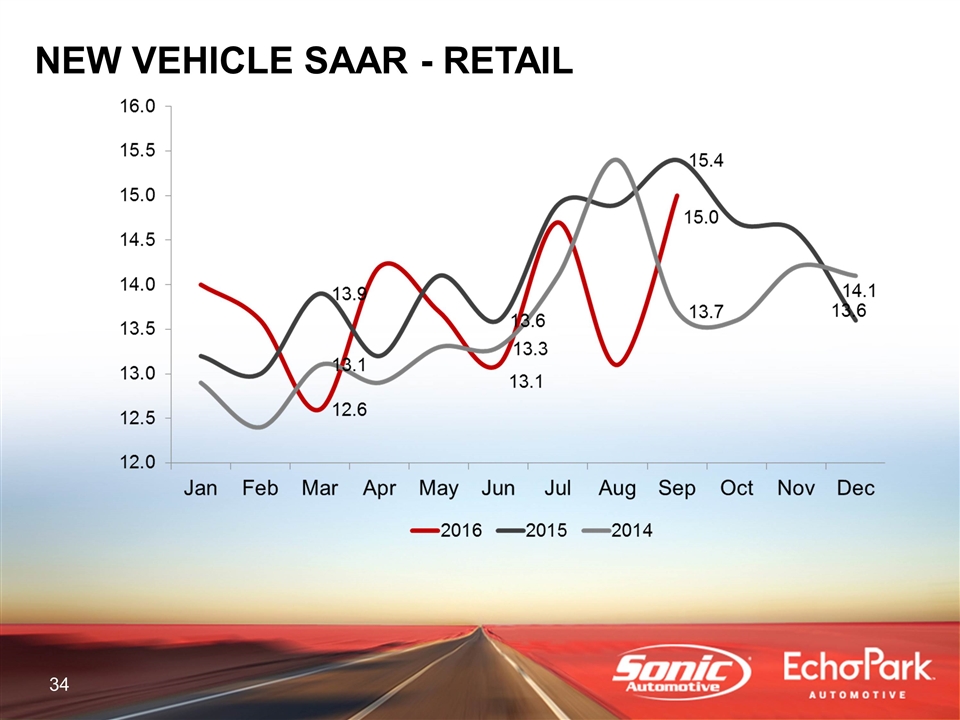
NEW VEHICLE SAAR - RETAIL
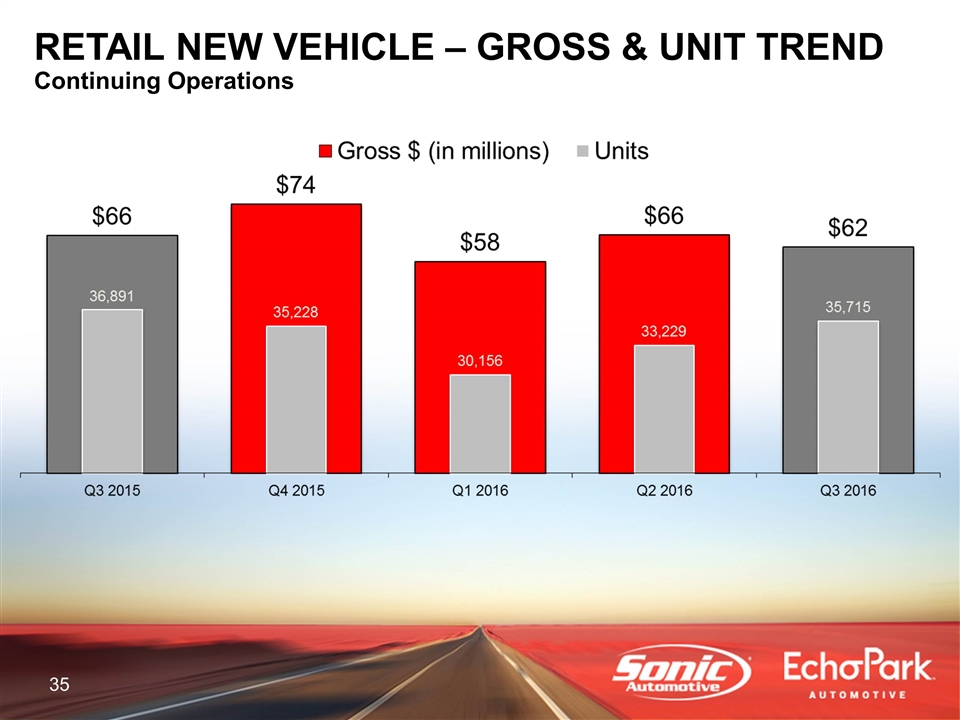
RETAIL NEW VEHICLE – GROSS & UNIT TREND Continuing Operations
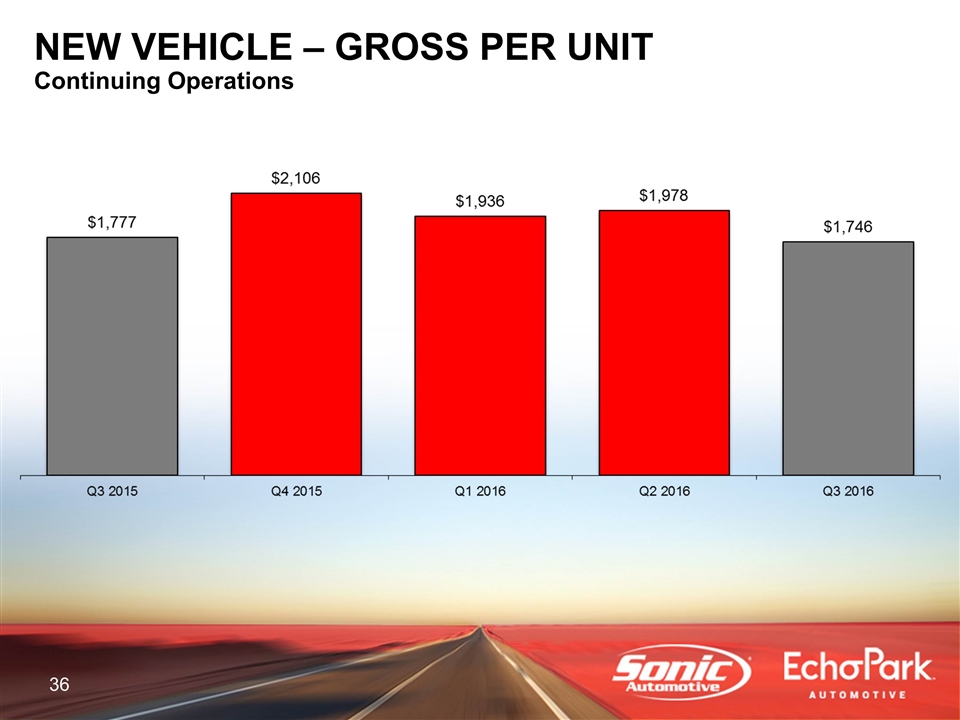
NEW VEHICLE – GROSS PER UNIT Continuing Operations
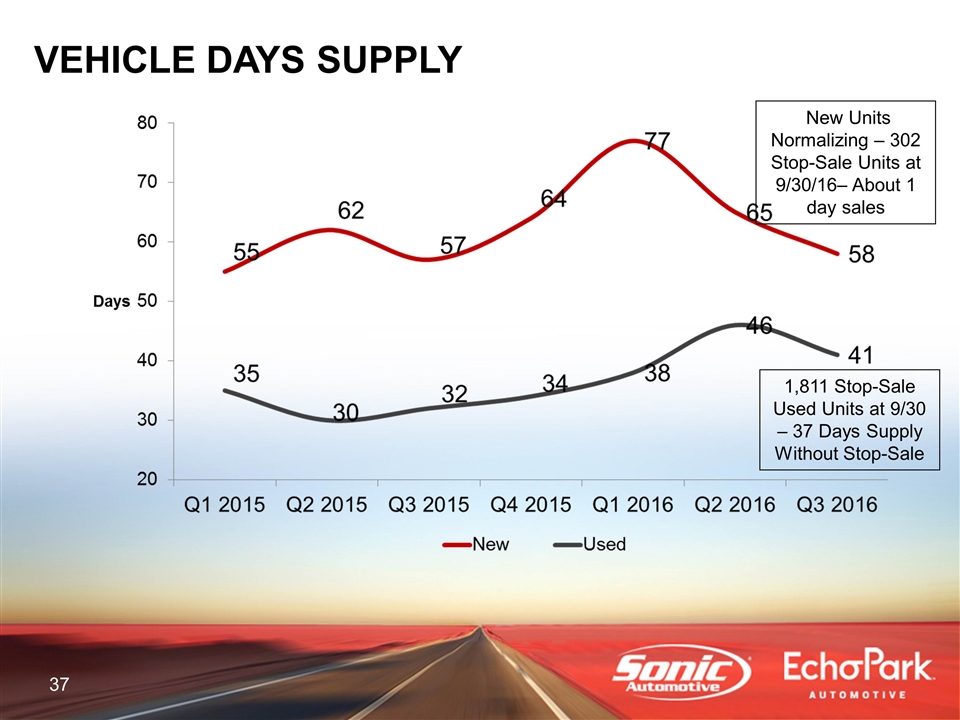
VEHICLE DAYS SUPPLY New Units Normalizing – 302 Stop-Sale Units at 9/30/16– About 1 day sales 1,811 Stop-Sale Used Units at 9/30 – 37 Days Supply Without Stop-Sale
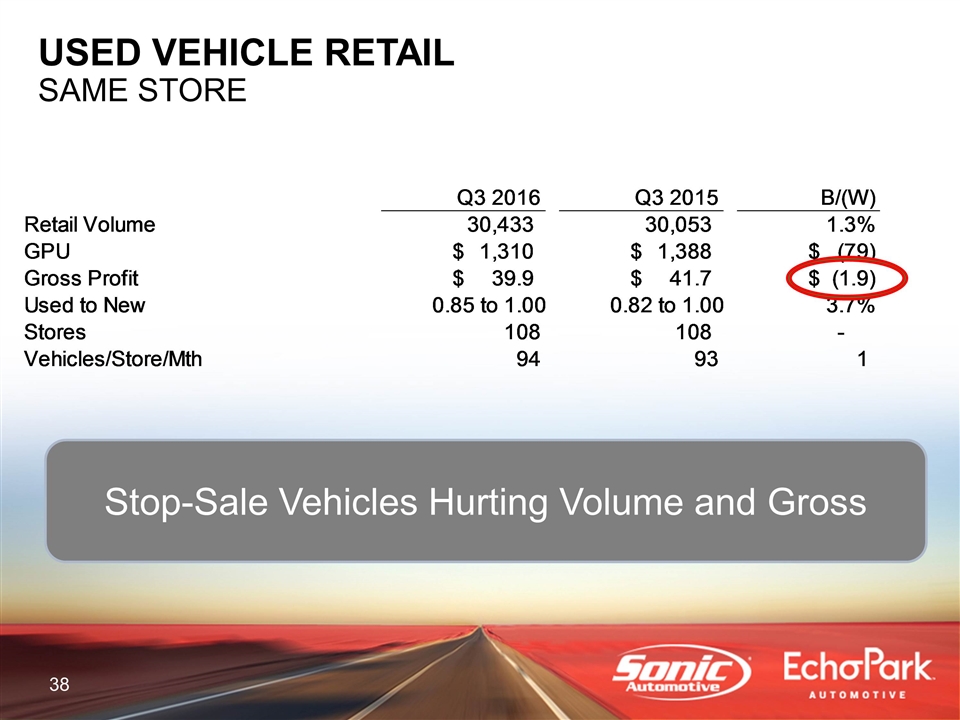
USED VEHICLE RETAIL SAME STORE Stop-Sale Vehicles Hurting Volume and Gross Q3 2016 Q3 2015 B/(W) Retail Volume 30,433 30,053 1.2644328353% GPU $1,309.8398744784247 $1,388.3972608391375 $-78.557386360712826 Gross Profit $39.862356900001899 $41.725502879998601 $-1.8631459799967052 Used to New 0.85 to 1.00 0.82 to 1.00 3.6585365854% Stores 108 108 0 Vehicles/Store/Mth 94 93 1 Vehicles per store/month (Keyed) $0 $0 0.0%
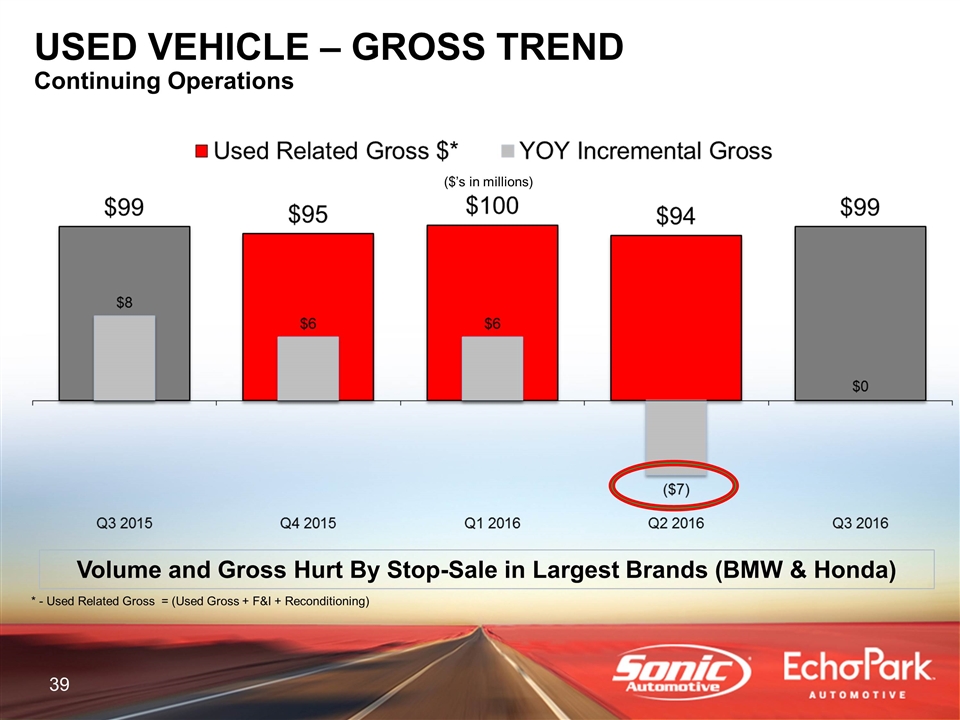
* - Used Related Gross = (Used Gross + F&I + Reconditioning) ($’s in millions) USED VEHICLE – GROSS TREND Continuing Operations Volume and Gross Hurt By Stop-Sale in Largest Brands (BMW & Honda)
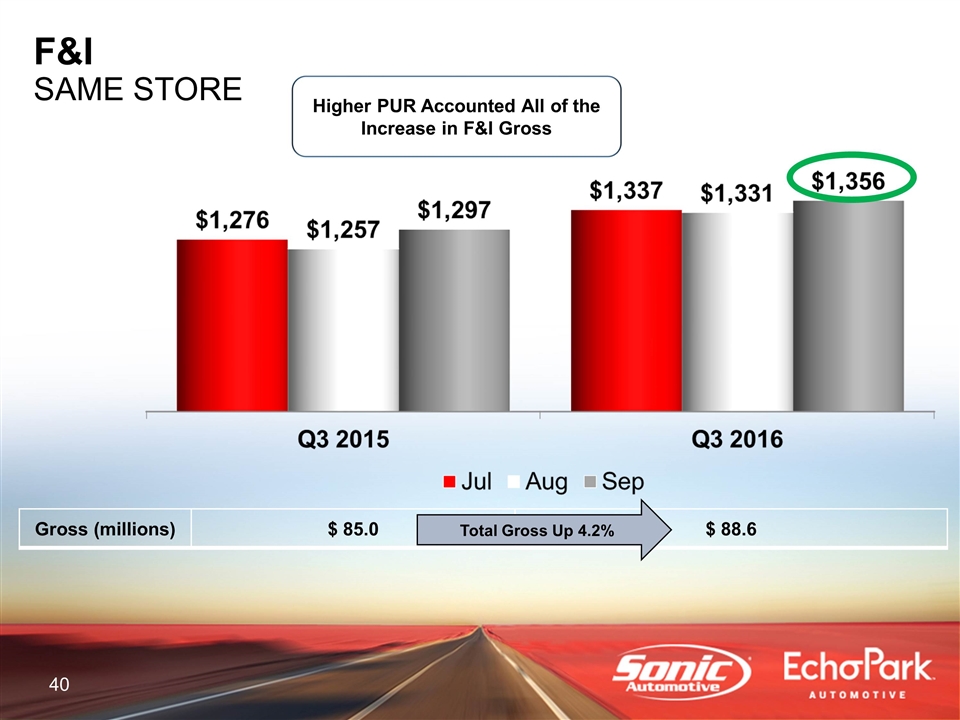
Higher PUR Accounted All of the Increase in F&I Gross Gross (millions) $ 85.0 $ 88.6 F&I SAME STORE Total Gross Up 4.2%
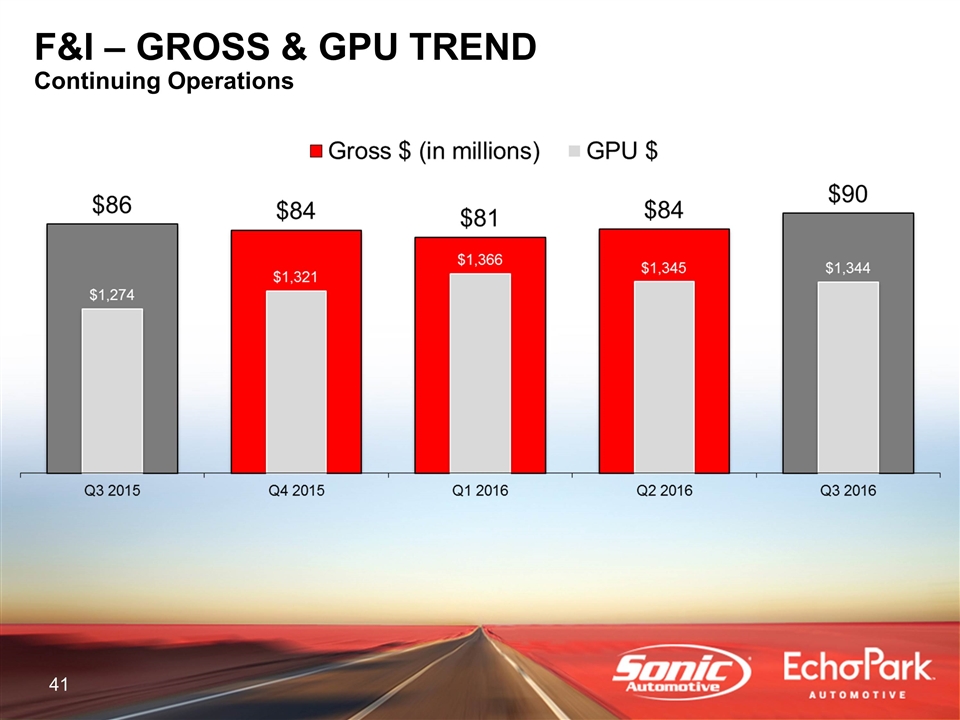
F&I – GROSS & GPU TREND Continuing Operations
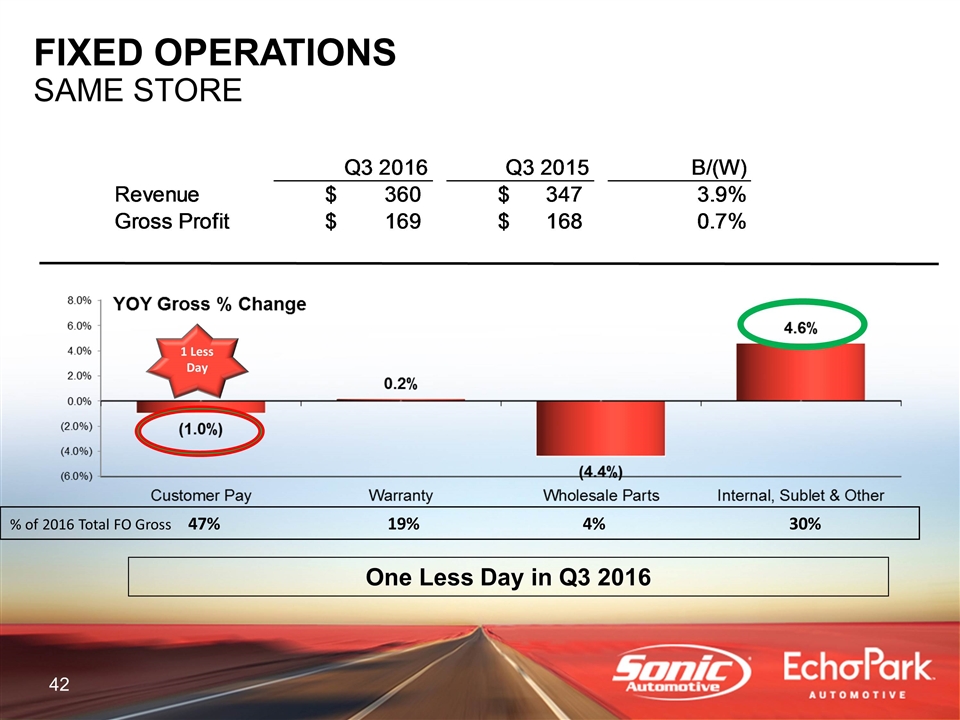
FIXED OPERATIONS SAME STORE % of 2016 Total FO Gross 47% 19% 4% 30% One Less Day in Q3 2016 1 Less Day Q3 2016 Q3 2015 B/(W) Revenue $360.21129877000203 $346.83091076999801 3.8578995079% Gross Profit $168.99863822999998 $167.8645453 .6756000369% SAAR - Keyed $0 $0 0.0%
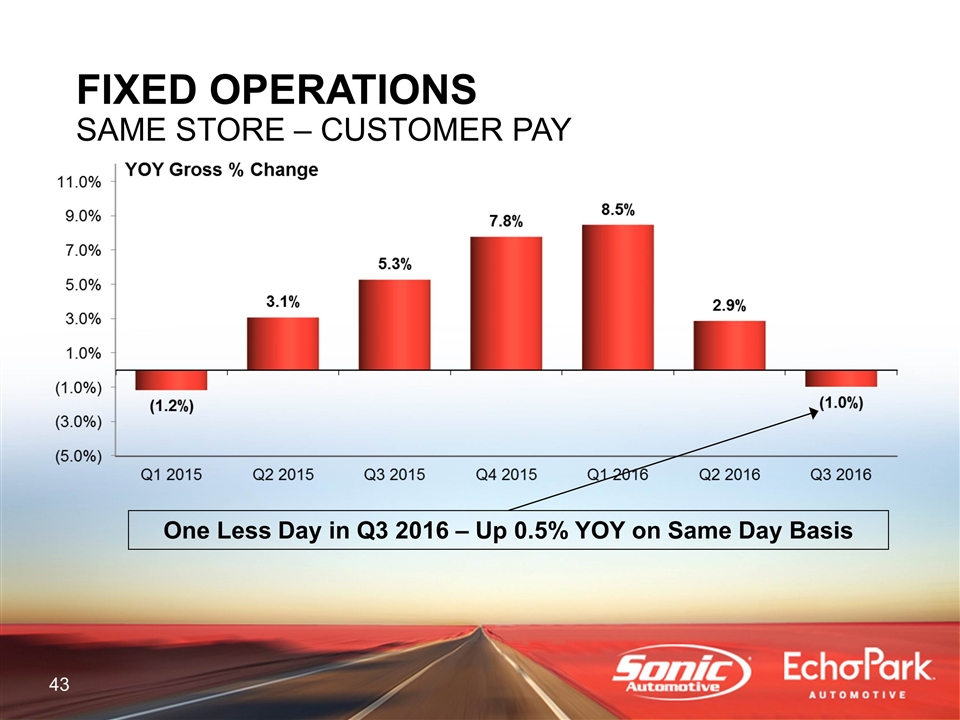
FIXED OPERATIONS SAME STORE – CUSTOMER PAY One Less Day in Q3 2016 – Up 0.5% YOY on Same Day Basis
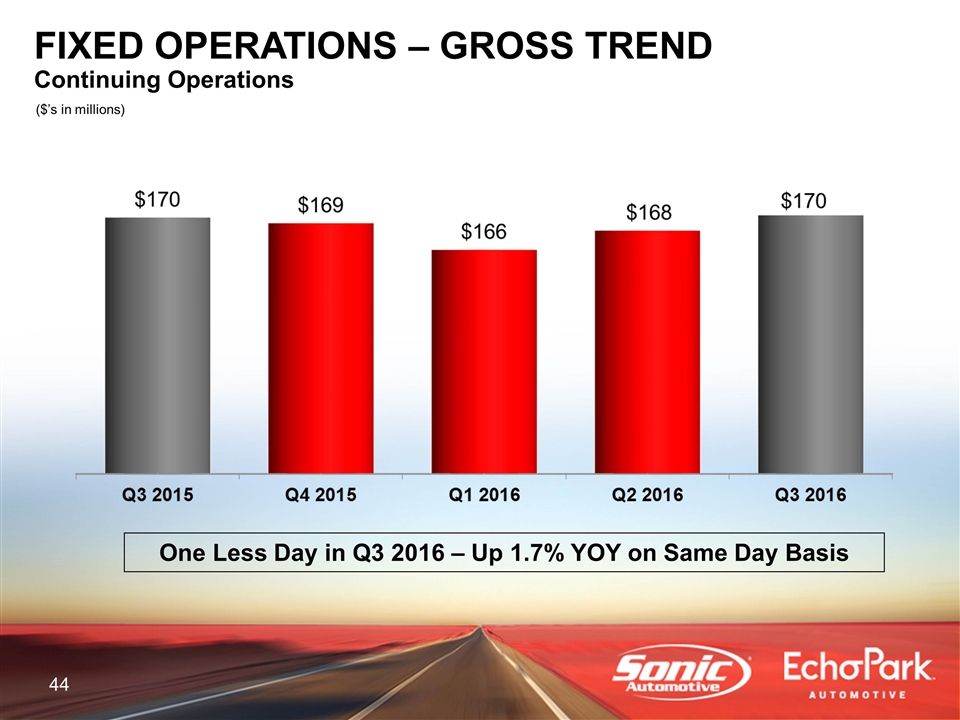
($’s in millions) FIXED OPERATIONS – GROSS TREND Continuing Operations One Less Day in Q3 2016 – Up 1.7% YOY on Same Day Basis
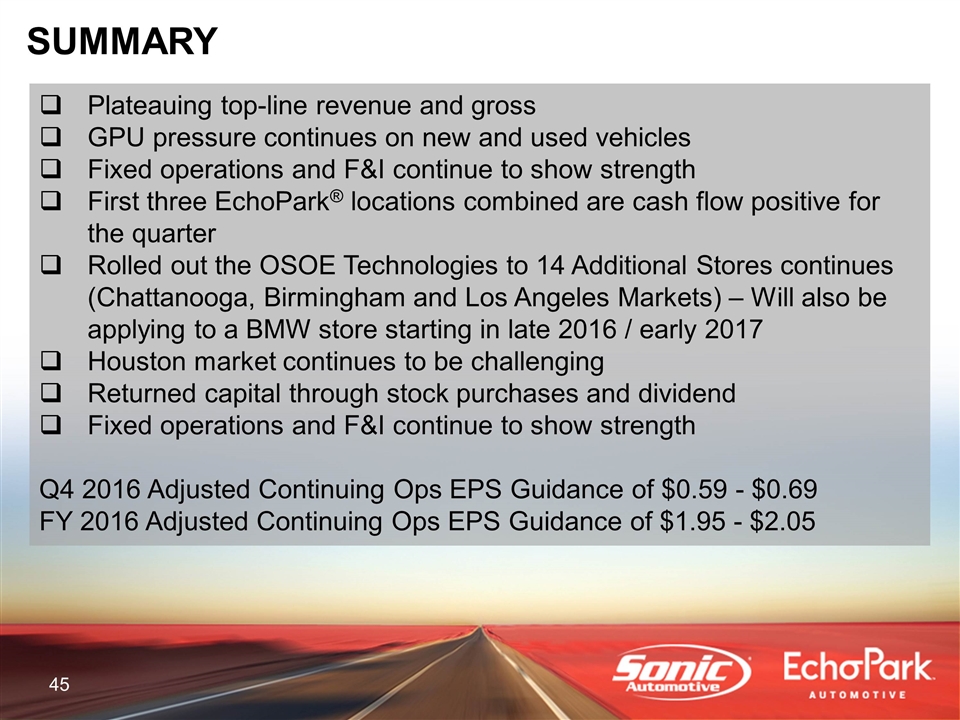
Plateauing top-line revenue and gross GPU pressure continues on new and used vehicles Fixed operations and F&I continue to show strength First three EchoPark® locations combined are cash flow positive for the quarter Rolled out the OSOE Technologies to 14 Additional Stores continues (Chattanooga, Birmingham and Los Angeles Markets) – Will also be applying to a BMW store starting in late 2016 / early 2017 Houston market continues to be challenging Returned capital through stock purchases and dividend Fixed operations and F&I continue to show strength Q4 2016 Adjusted Continuing Ops EPS Guidance of $0.59 - $0.69 FY 2016 Adjusted Continuing Ops EPS Guidance of $1.95 - $2.05 SUMMARY
APPENDIX
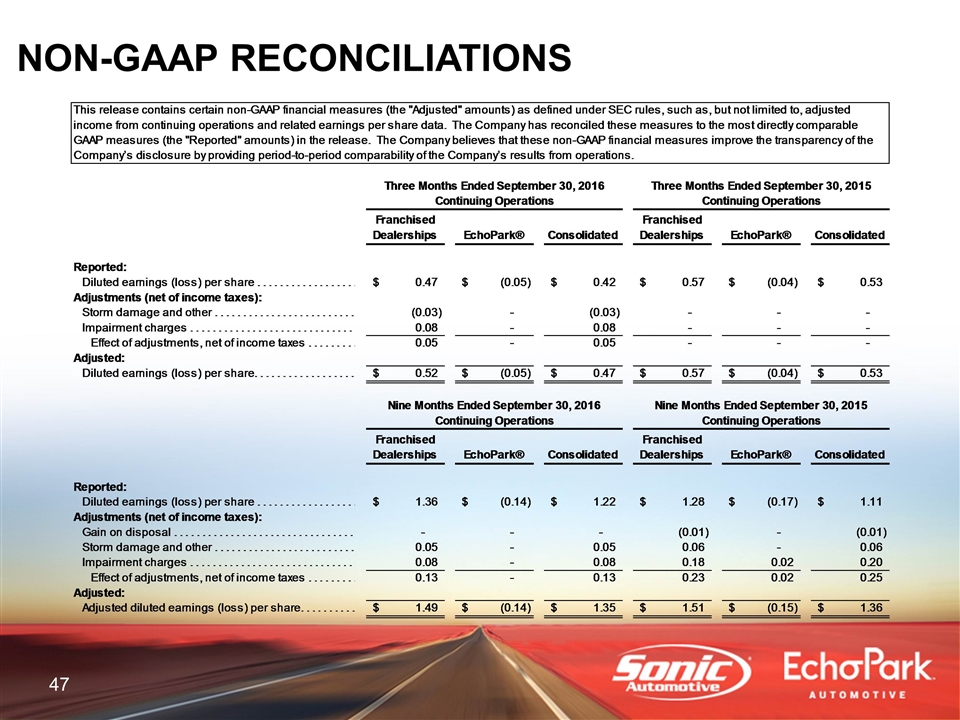
NON-GAAP RECONCILIATIONS
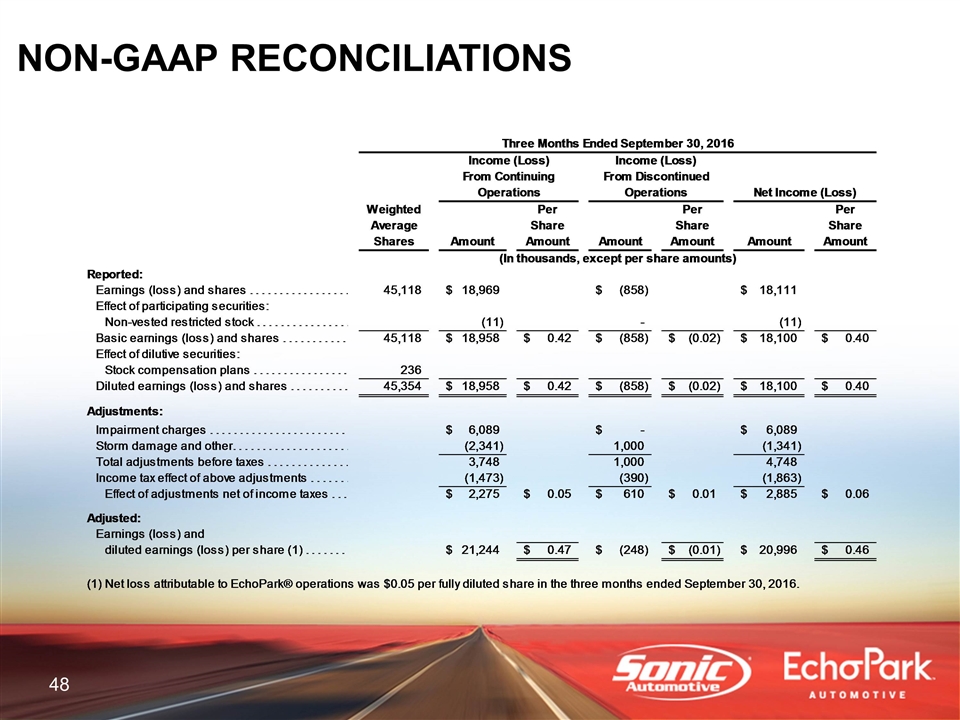
NON-GAAP RECONCILIATIONS
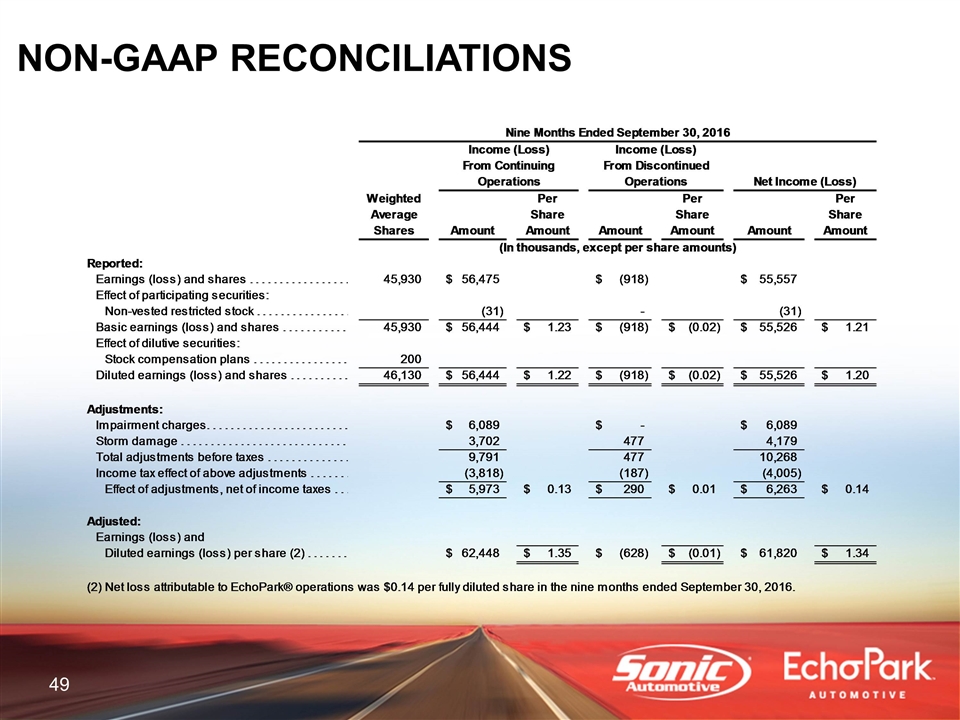
NON-GAAP RECONCILIATIONS
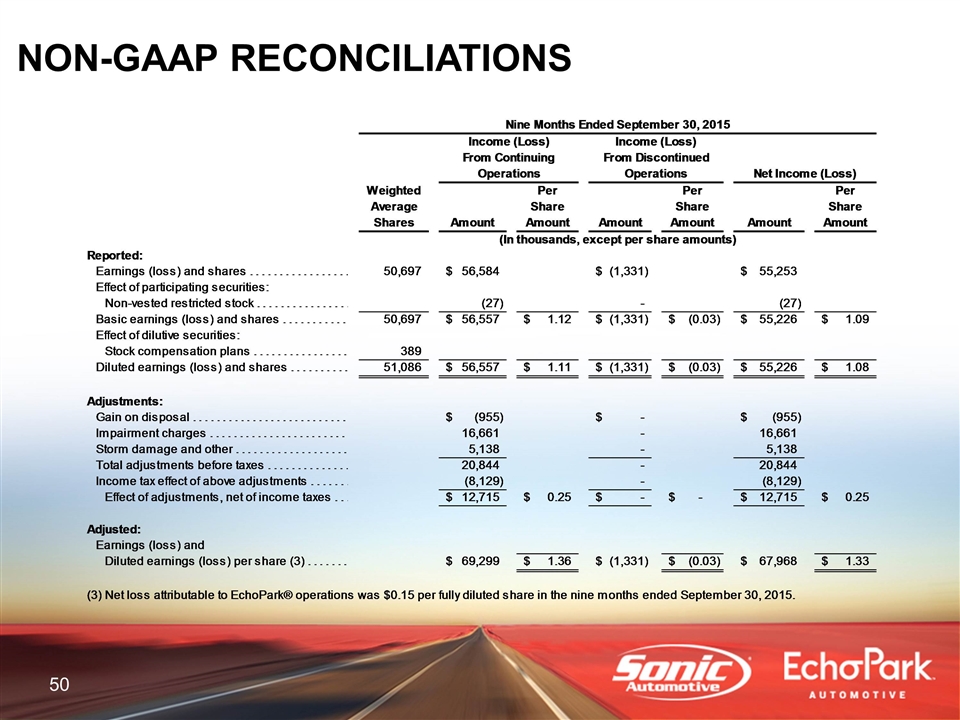
NON-GAAP RECONCILIATIONS
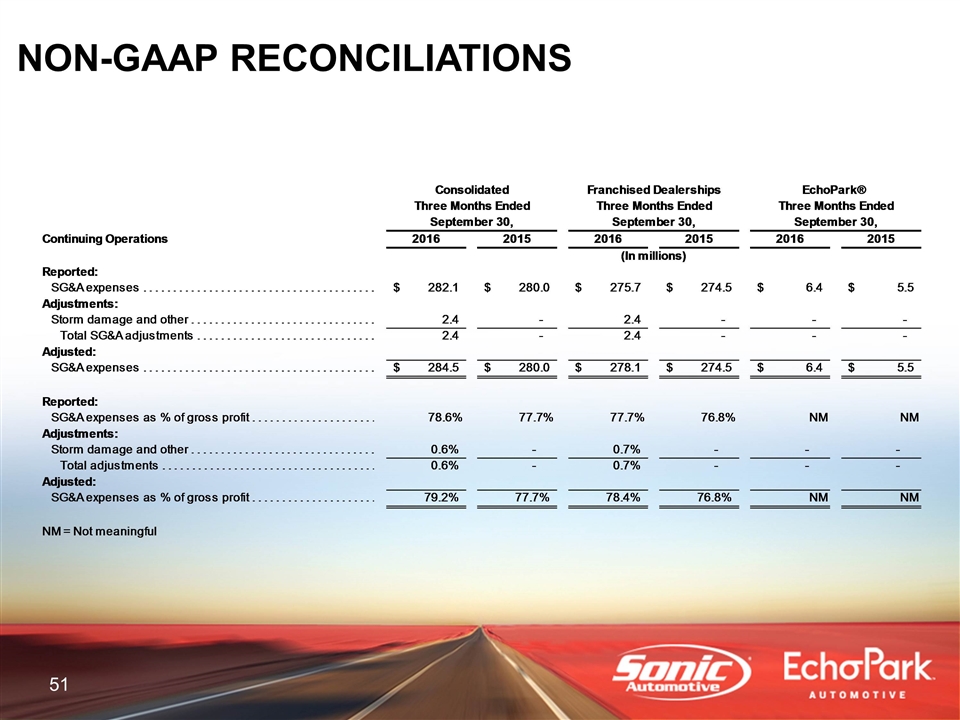
NON-GAAP RECONCILIATIONS
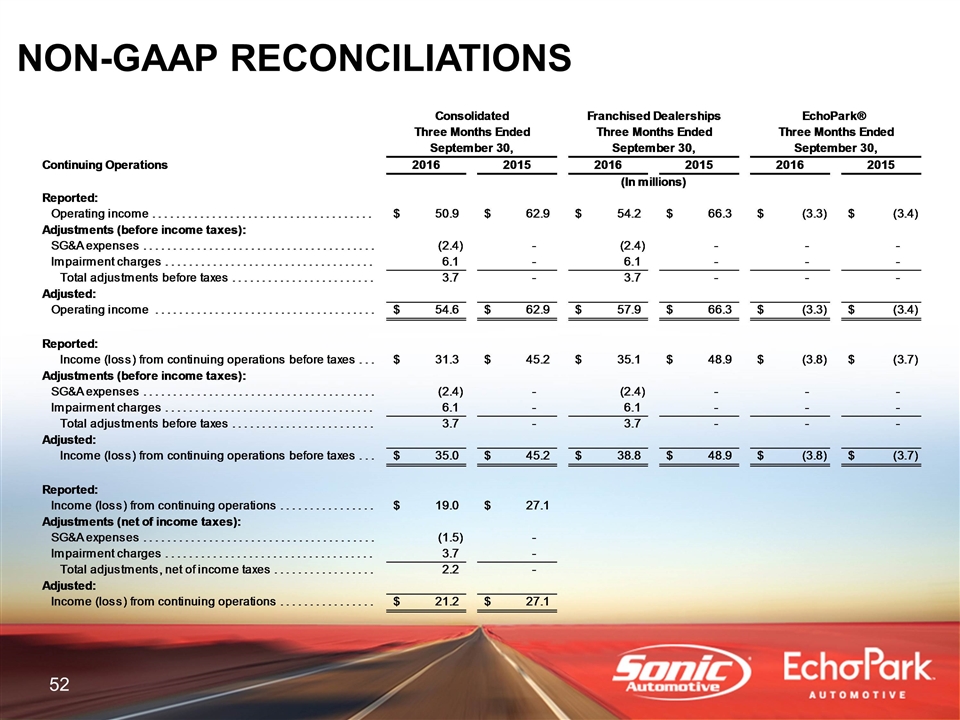
NON-GAAP RECONCILIATIONS
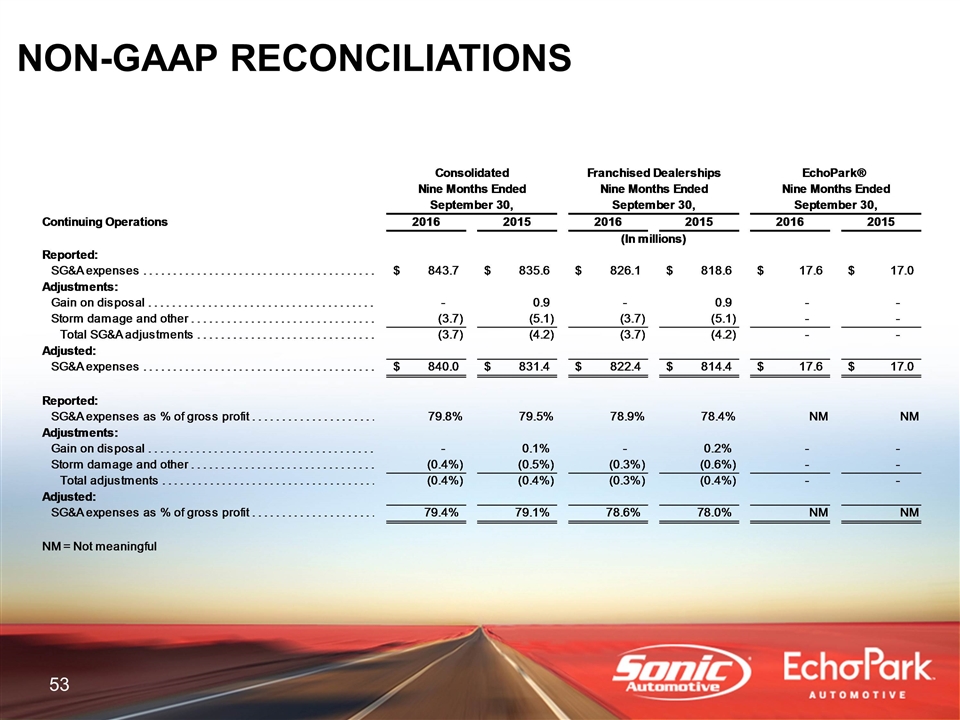
NON-GAAP RECONCILIATIONS
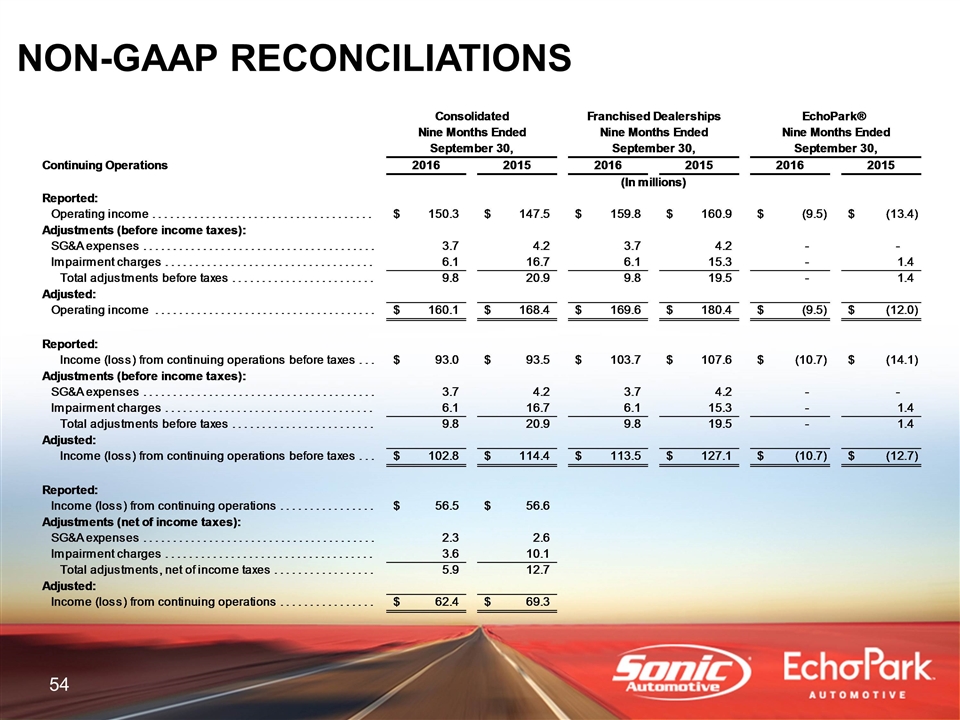
NON-GAAP RECONCILIATIONS