

Q1 2017 Investor Presentation April 26, 2017 Exhibit 99.2
FORWARD-LOOKING STATEMENTS This presentation contains “forward-looking statements” within the meaning of the Private Securities Litigation Reform Act of 1995. These statements relate to future events, are not historical facts and are based on our current expectations and assumptions regarding our business, the economy and other future conditions. These statements can generally be identified by lead-in words such as “believe”, “expect”, “anticipate”, “intend”, “plan”, “foresee”, “may” ,”will” and other similar words. Statements that describe our Company’s objectives, plans or goals are also forward-looking statements. Examples of such forward-looking information we may be discussing in this presentation include, without limitation, anticipated 2017 industry new vehicle sales volume, the implementation of growth and operating strategies, including acquisitions of dealerships and properties, the development of open points and stand-alone pre-owned stores, the return of capital to shareholders, anticipated future success and impacts from the implementation of our strategic initiatives and earnings per share expectations. You are cautioned that these forward-looking statements are not guarantees of future performance, involve risks and uncertainties and actual results may differ materially from those projected in the forward-looking statements as a result of various factors. These risks and uncertainties include, among other things, (a) economic conditions in the markets in which we operate, (b) the success of our operational strategies, (c) our relationships with the automobile manufacturers, (d) new and pre-owned vehicle sales volume, and (e) earnings expectations for the year ending December 31, 2017. These risks and uncertainties, as well as additional factors that could affect our forward-looking statements, are described in our Form 10-K for the year ended December 31, 2016. These forward-looking statements, risks, uncertainties and additional factors speak only as of the date of this presentation. We undertake no obligation to update any such statements.
CONTENT COMPANY OVERVIEW STRATEGIC FOCUS FINANCIAL REVIEW OPERATIONS REVIEW SUMMARY & OUTLOOK
COMPANY OVERVIEW
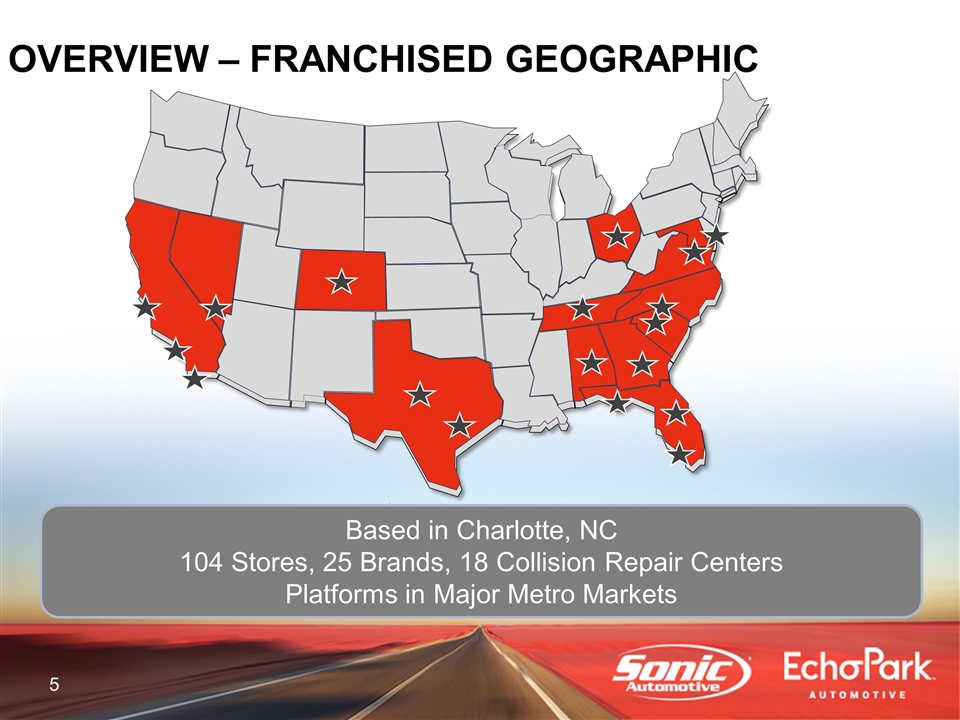
OVERVIEW – FRANCHISED GEOGRAPHIC Based in Charlotte, NC 104 Stores, 25 Brands, 18 Collision Repair Centers Platforms in Major Metro Markets
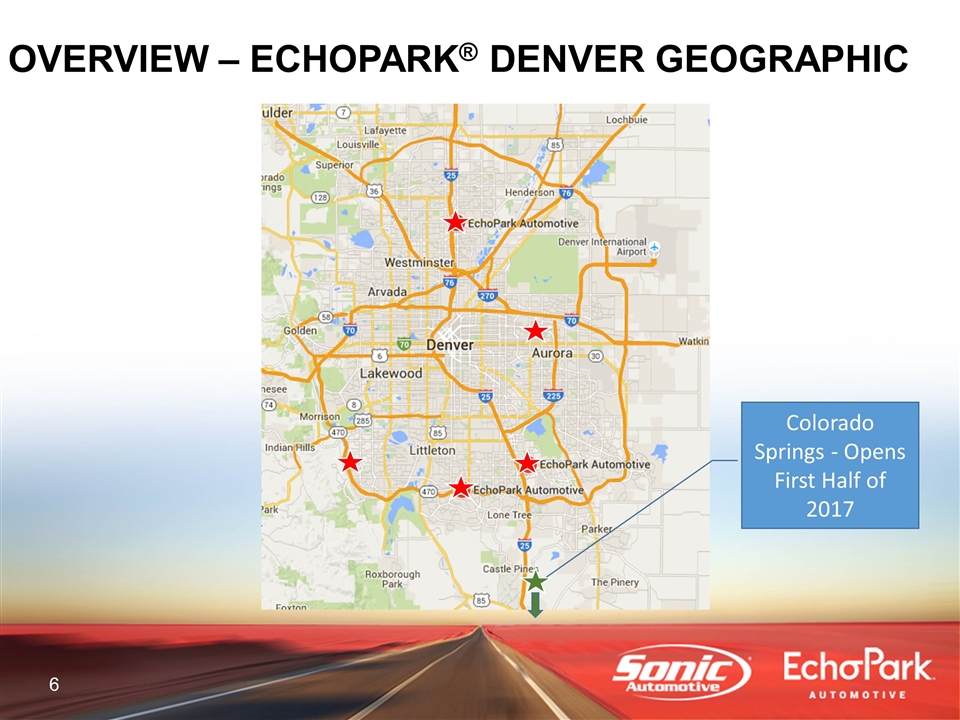
OVERVIEW – ECHOPARK® DENVER GEOGRAPHIC Colorado Springs - Opens First Half of 2017
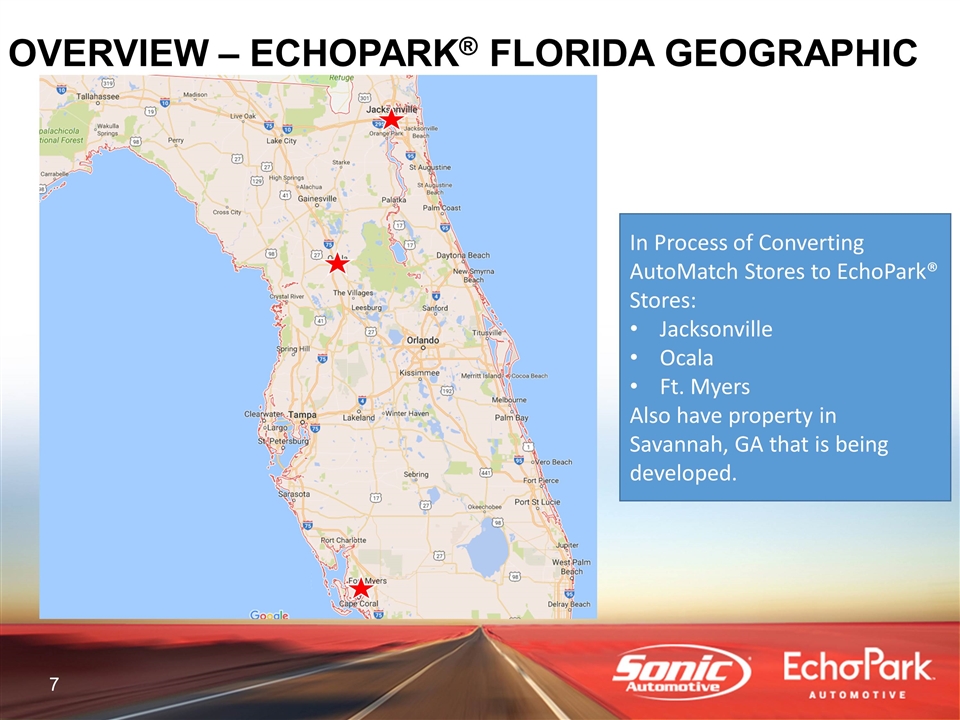
OVERVIEW – ECHOPARK® FLORIDA GEOGRAPHIC In Process of Converting AutoMatch Stores to EchoPark® Stores: Jacksonville Ocala Ft. Myers Also have property in Savannah, GA that is being developed.
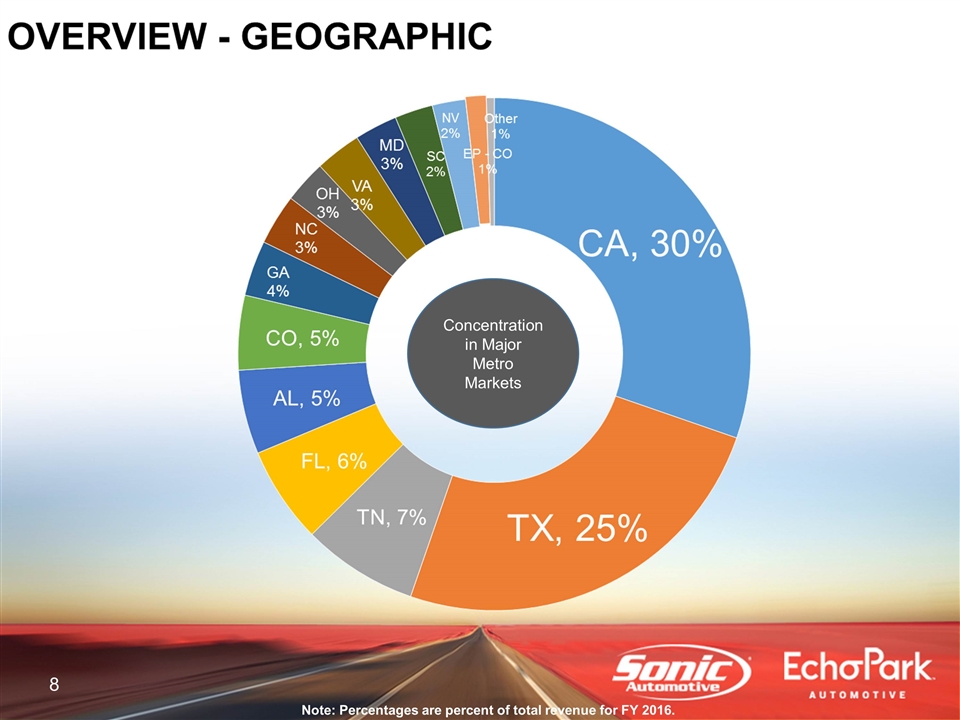
Note: Percentages are percent of total revenue for FY 2016. Concentration in Major Metro Markets
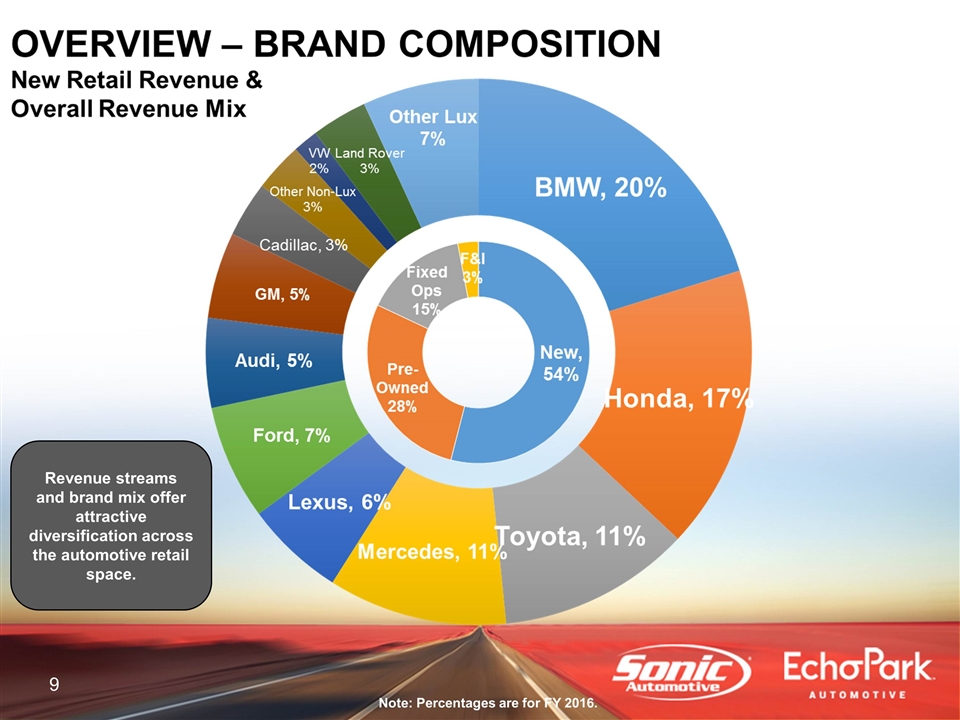
Revenue streams and brand mix offer attractive diversification across the automotive retail space. Note: Percentages are for FY 2016.

STRATEGIC FOCUS
STRATEGIC FOCUS Growth EchoPark® One Sonic-One Experience Acquisitions & Open Points Own Our Properties Return Capital to Shareholders Share Repurchases Dividends
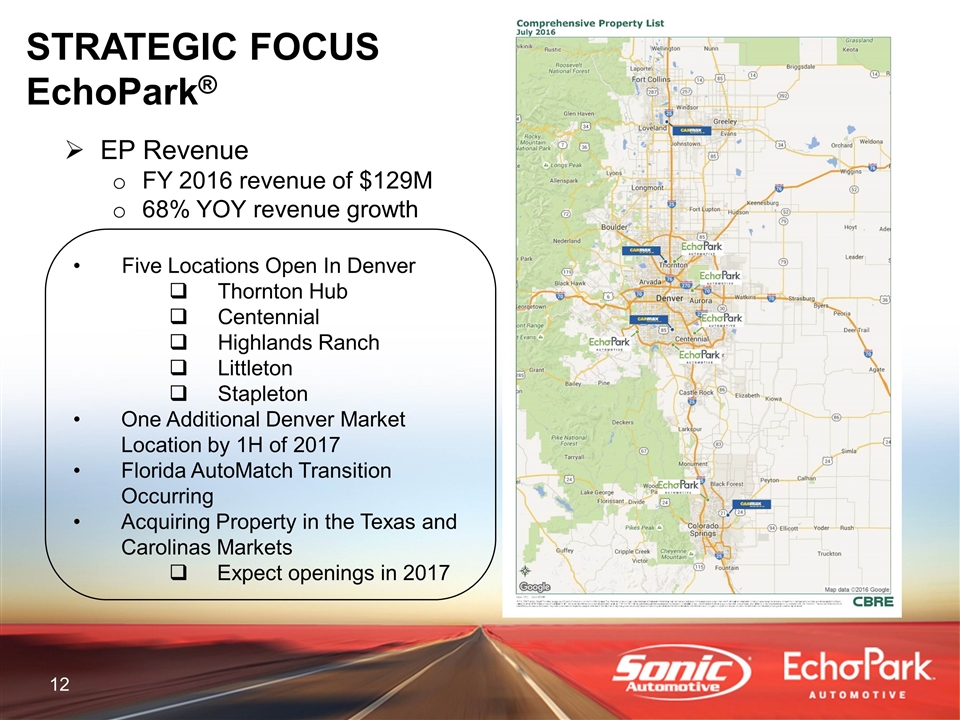
STRATEGIC FOCUS EchoPark® Five Locations Open In Denver Thornton Hub Centennial Highlands Ranch Littleton Stapleton One Additional Denver Market Location by 1H of 2017 Florida AutoMatch Transition Occurring Acquiring Property in the Texas and Carolinas Markets Expect openings in 2017 EP Revenue FY 2016 revenue of $129M 68% YOY revenue growth
STRATEGIC FOCUS ONE SONIC-ONE EXPERIENCE (OSOE) Goals 1 Associate, 1 Price, 1 Hour Improve Transparency; Increase Trust Operational Efficiencies Grow Market Share Feed Fixed Operations Technology Being Introduced into Additional Markets (Charlotte was Pilot) CRM, Desking & Appraisal
STRATEGIC FOCUS ACQUISITIONS & OPEN POINTS Open Points Mercedes-Benz in Dallas Market Estimated Annual Revenues >$100M Operational in Q3 2016 Nissan in TN Market Estimated Annual Revenues >$30M Operational in Q4 2016 Audi in Pensacola Market Estimated Annual Revenues >$50M Operational in 1H of 2017 Exploring Acquisition and Open Point Opportunities in Other Markets
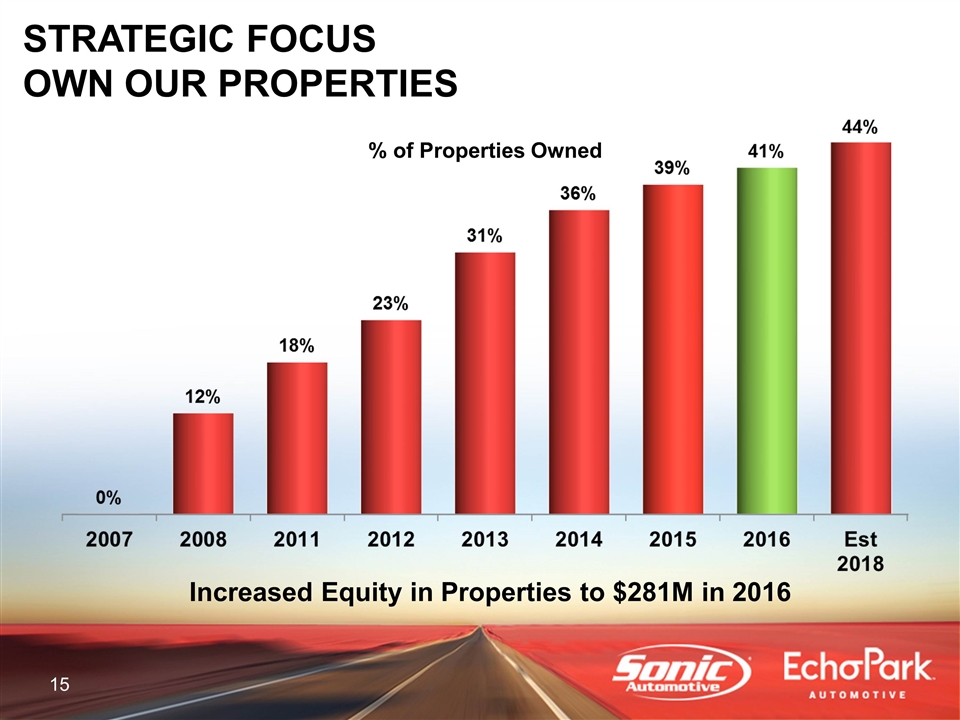
STRATEGIC FOCUS OWN OUR PROPERTIES % of Properties Owned Increased Equity in Properties to $281M in 2016
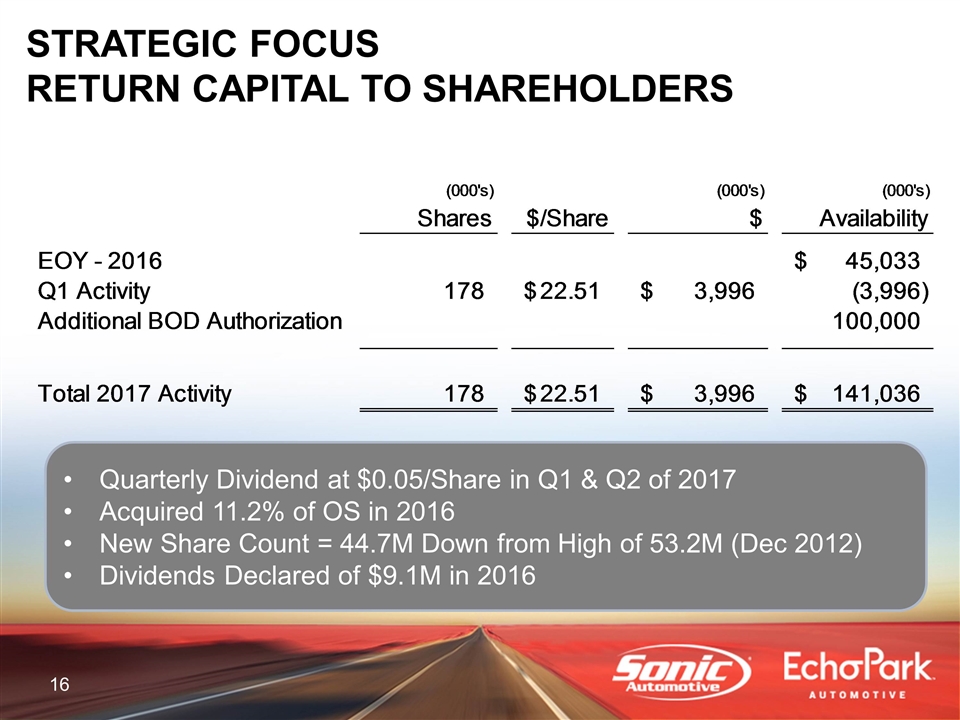
Quarterly Dividend at $0.05/Share in Q1 & Q2 of 2017 Acquired 11.2% of OS in 2016 New Share Count = 44.7M Down from High of 53.2M (Dec 2012) Dividends Declared of $9.1M in 2016 STRATEGIC FOCUS RETURN CAPITAL TO SHAREHOLDERS (000's) (000's) (000's) Shares $/Share $ Availability EOY - 2016 $45,032.523000000001 Q1 Activity 177.53200000000001 $22.509677128630329 $3,996.1880000000001 -3,996.1880000000001 Additional BOD Authorization ,100,000 Total 2017 Activity 177.53200000000001 $22.509677128630329 $3,996.1880000000001 $,141,036.33499999999
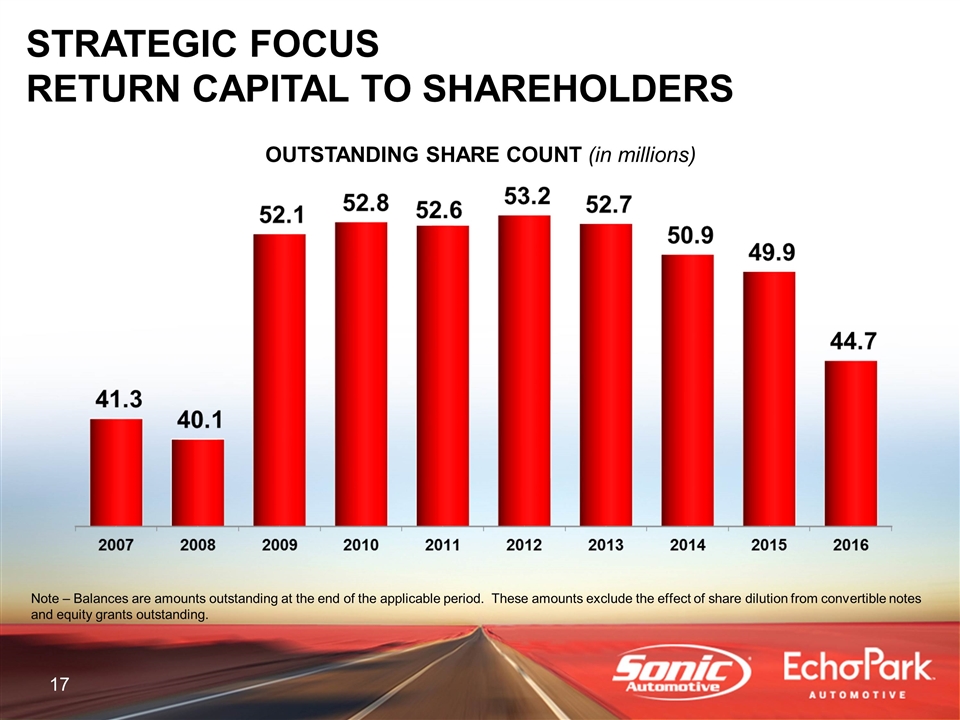
OUTSTANDING SHARE COUNT (in millions) Note – Balances are amounts outstanding at the end of the applicable period. These amounts exclude the effect of share dilution from convertible notes and equity grants outstanding. STRATEGIC FOCUS RETURN CAPITAL TO SHAREHOLDERS
Q1 2017 FINANCIAL REVIEW
Q1 2017 FINANCIAL REVIEW FRANCHISED SEGMENT
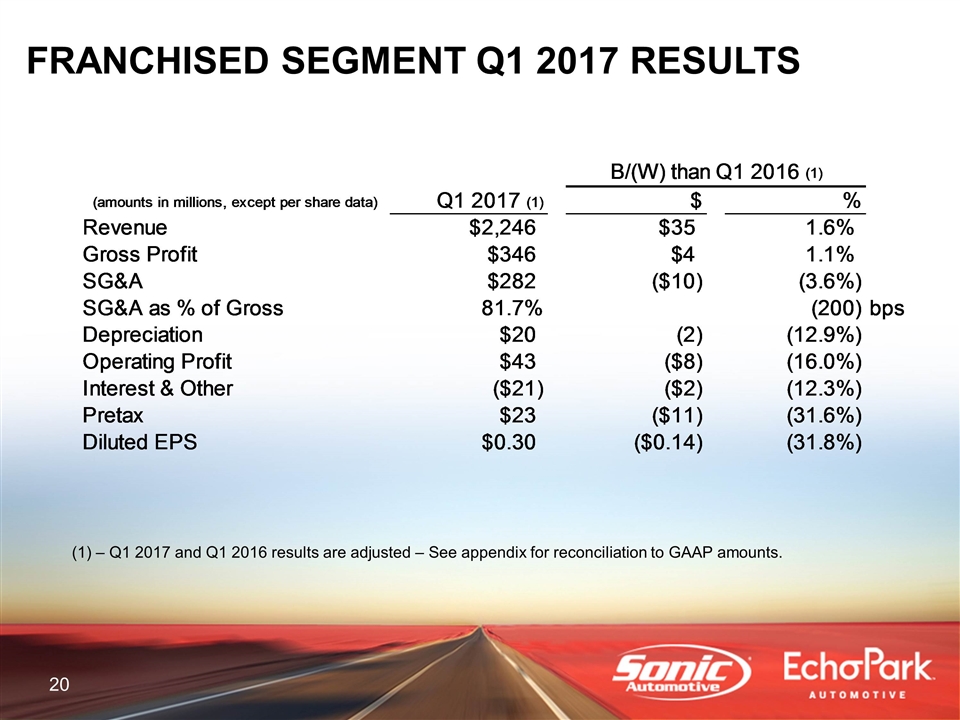
FRANCHISED SEGMENT Q1 2017 RESULTS – Q1 2017 and Q1 2016 results are adjusted – See appendix for reconciliation to GAAP amounts. B/(W) than Q1 2016 (1) (amounts in millions, except per share data) Q1 2017 (1) $ % Revenue $2,246.251349599998 $35.439564619999842 1.603175425349% Gross Profit $345.68172950749602 $3.7789587374990226 1.105272919839% SG&A $282.39013689999996 $-9.7644136638409691 -3.581618619085% SG&A as % of Gross 0.8169079034125708 -,200 bps Depreciation $19.969354840000001 -2.274144070000002 -0.12851748982021322 Operating Profit $43.322237947497804 $-8.259599166344902 -0.16012611470420707 Interest & Other $-20.586056670000001 $-2.2562398700000013 -0.12309123951527989 Pretax $22.736181277497899 $-10.515839036344202 -0.31624662011789656 Diluted EPS $0.3 $-0.14000000000000001 -0.31818181818181823 Diluted EPS Keyed $0.3 $-0.14000000000000001 -0.31818181818181823 CY 0.3 PY 0.44 change -0.14000000000000001 % -0.31818181818181823
Q1 2017 FINANCIAL REVIEW ECHOPARK® SEGMENT
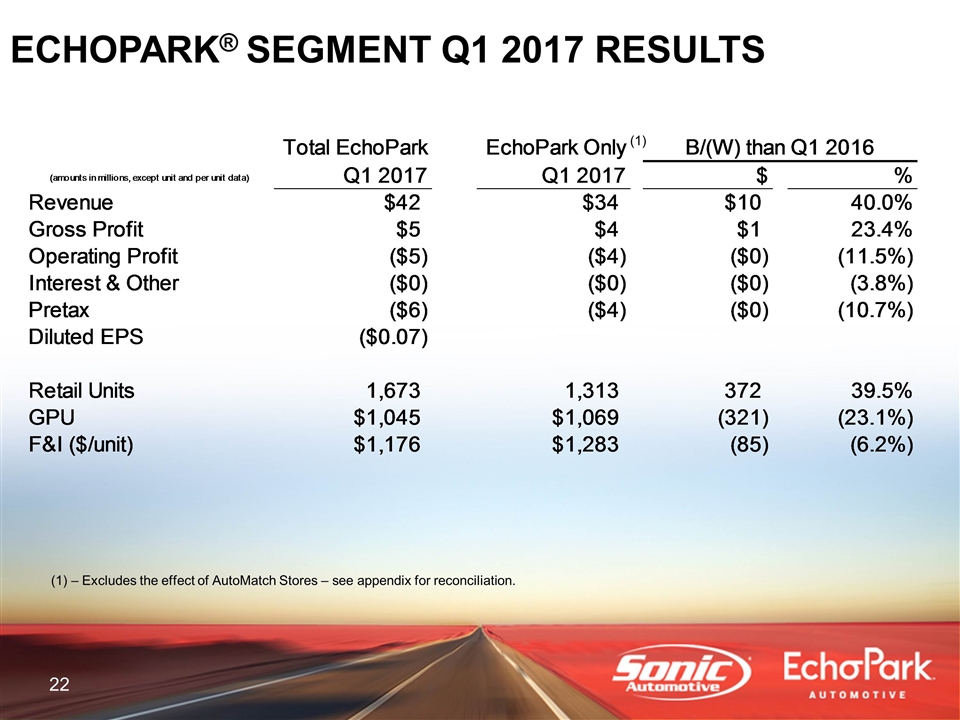
ECHOPARK® SEGMENT Q1 2017 RESULTS 22 (1) – Excludes the effect of AutoMatch Stores – see appendix for reconciliation. (1) Total EchoPark EchoPark Only B/(W) than Q1 2016 (amounts in millions, except unit and per unit data) Q1 2017 Q1 2017 $ % Revenue $41.797235549999996 $33.665376829999992 $9.6245779499999955 0.40034351595557277 Gross Profit $4.6646679900000096 $4.0060857900000091 $0.75878502000000936 0.23366638132506876 Operating Profit $-5.1308441299999892 $-3.6051956699999894 $-0.37049048999998924 -0.11453609197237233 Interest & Other $-0.44245117999999994 $-0.35398884999999997 $-1.2889389999999935E-2 -3.7787776035% Pretax $-5.57329530999999 $-3.9591845199999907 $-0.3833798799999904 -0.10721499595123025 Diluted EPS $-7.0000000000000007E-2 Retail Units 1,673 1,313 372 0.39532412327311373 GPU $1,045.3807710699343 $1,069.2296191926876 -,321.22288877755682 -0.2310203958324846 F&I ($/unit) $1,175.7141542139868 $1,283.155559786748 -85.375566674463471 -6.238481904% Diluted EPS Keyed $-7.0000000000000007E-2 $-0.02 -0.4 CY -7.0000000000000007E-2 PY -0.05 Change -2.0000000000000004E-2 % Change 0.40000000000000008
Q1 2017 FINANCIAL REVIEW TOTAL ENTERPRISE
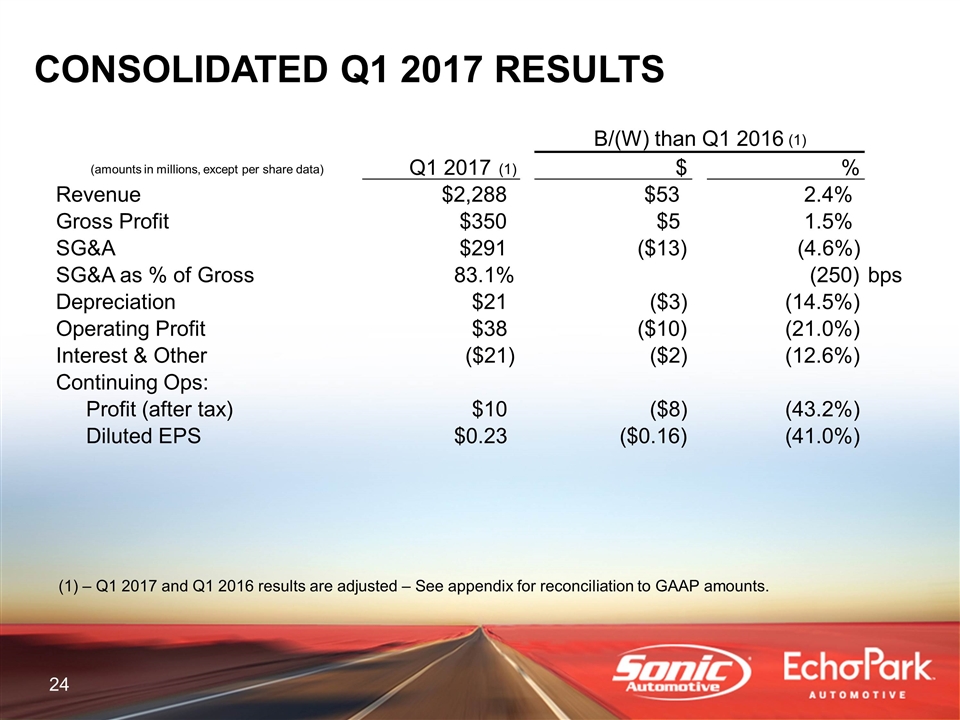
– Q1 2017 and Q1 2016 results are adjusted – See appendix for reconciliation to GAAP amounts. CONSOLIDATED Q1 2017 RESULTS B/(W) than Q1 2016 (1) (amounts in millions, except per share data) Q1 2017 (1) $ % Revenue $2,288 $53 2.4% Gross Profit $350 $5 1.5% SG&A $291 ($13) (4.6%) SG&A as % of Gross 83.1% (250) bps Depreciation $21 ($3) (14.5%) Operating Profit $38 ($10) (21.0%) Interest & Other ($21) ($2) (12.6%) Continuing Ops: Profit (after tax) $10 ($8) (43.2%) Diluted EPS $0.23 ($0.16) (41.0%)
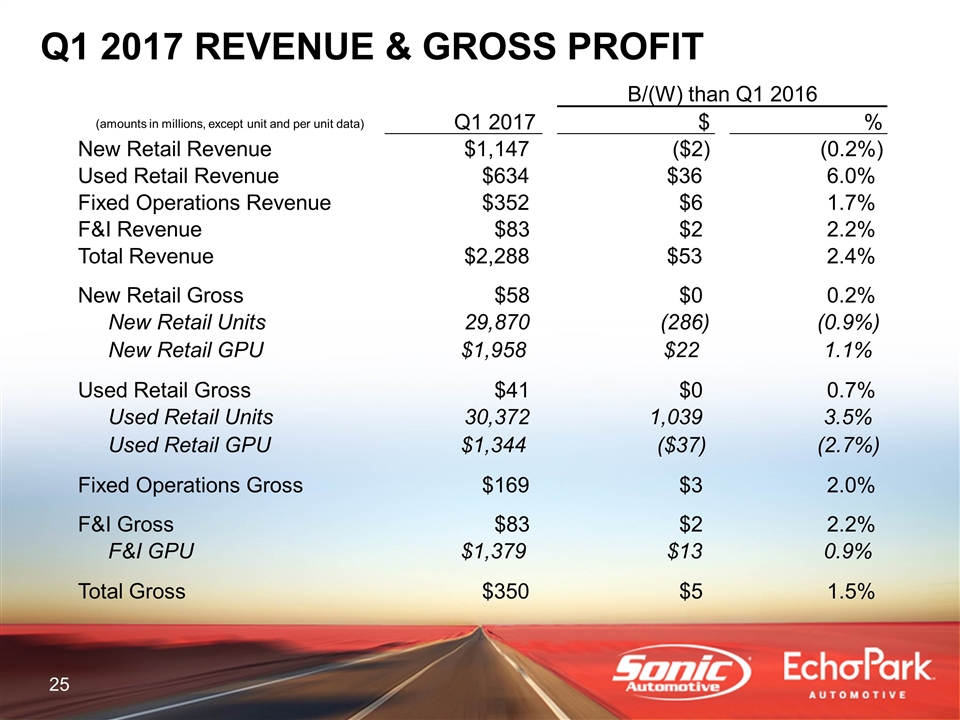
Q1 2017 REVENUE & GROSS PROFIT B/(W) than Q1 2016 (amounts in millions, except unit and per unit data) Q1 2017 $ % New Retail Revenue $1,147 ($2) (0.2%) Used Retail Revenue $634 $36 6.0% Fixed Operations Revenue $352 $6 1.7% F&I Revenue $83 $2 2.2% Total Revenue $2,288 $53 2.4% New Retail Gross $58 $0 0.2% New Retail Units 29,870 (286) (0.9%) New Retail GPU $1,958 $22 1.1% Used Retail Gross $41 $0 0.7% Used Retail Units 30,372 1,039 3.5% Used Retail GPU $1,344 ($37) (2.7%) Fixed Operations Gross $169 $3 2.0% F&I Gross $83 $2 2.2% F&I GPU $1,379 $13 0.9% Total Gross $350 $5 1.5%
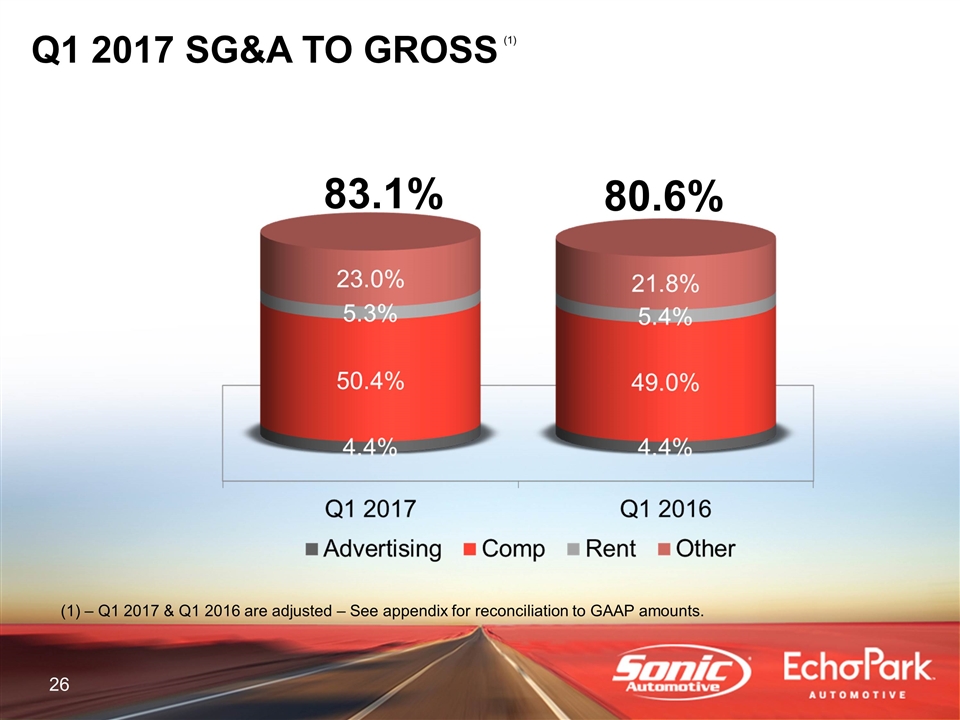
Q1 2017 SG&A TO GROSS – Q1 2017 & Q1 2016 are adjusted – See appendix for reconciliation to GAAP amounts. (1) 83.1% 80.6%
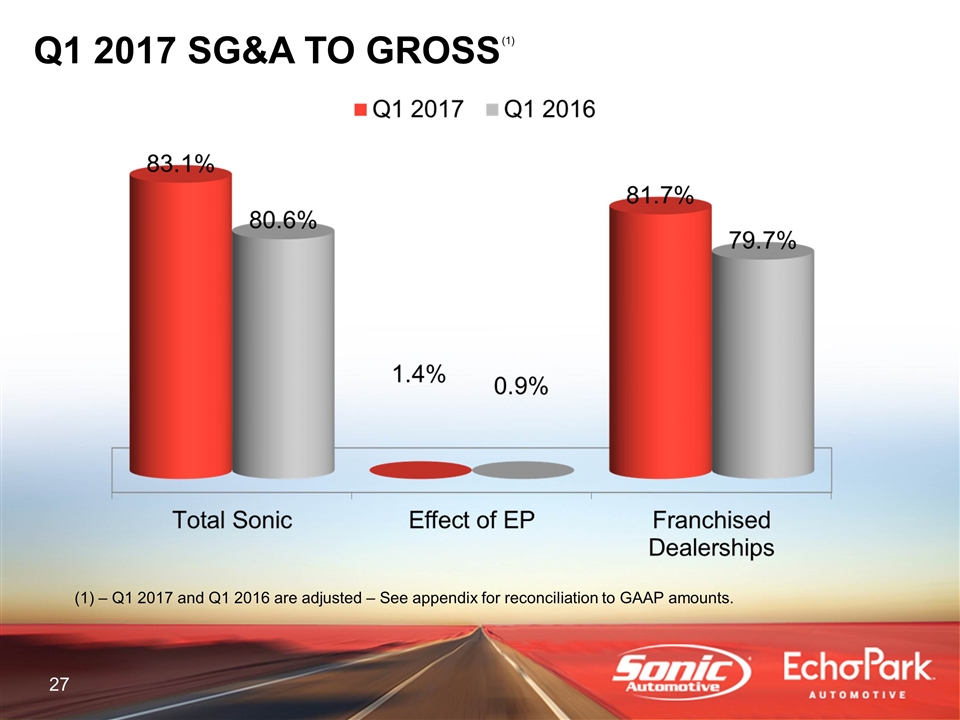
Q1 2017 SG&A TO GROSS – Q1 2017 and Q1 2016 are adjusted – See appendix for reconciliation to GAAP amounts. (1)
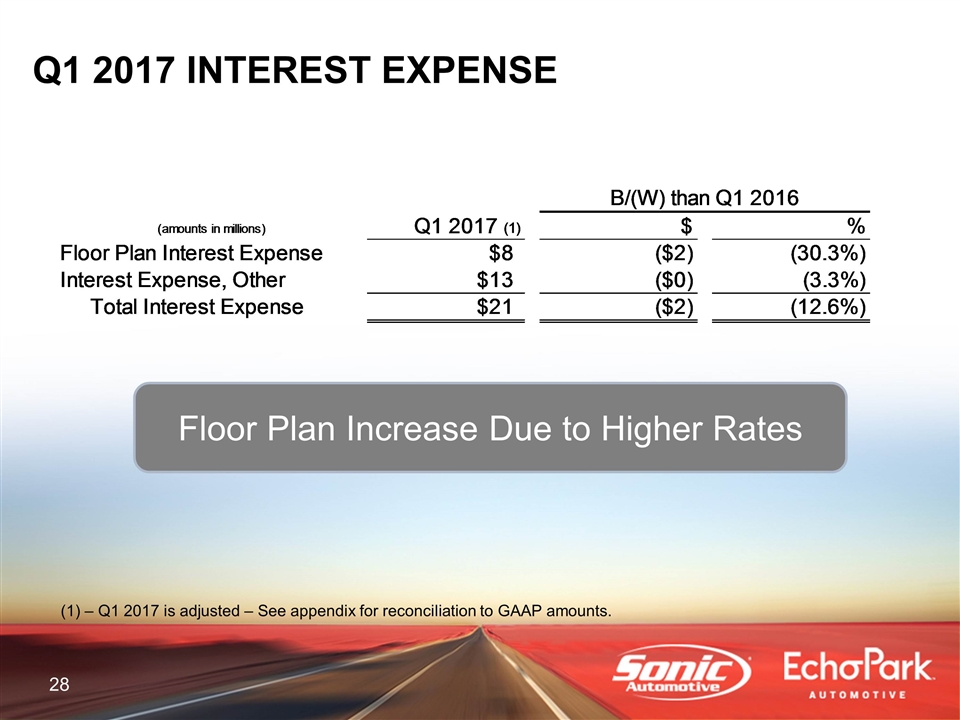
Q1 2017 INTEREST EXPENSE Floor Plan Increase Due to Higher Rates – Q1 2017 is adjusted – See appendix for reconciliation to GAAP amounts. B/(W) than Q1 2016 (amounts in millions) Q1 2017 (1) $ % Floor Plan Interest Expense $8.3863741399999991 $-1.95091313 -0.3031504855624943 Interest Expense, Other $12.74758289 $-0.40858017000000107 -3.311290055377% Total Interest Expense $21.133957029999998 $-2.3594932999999982 -0.12567566956544959
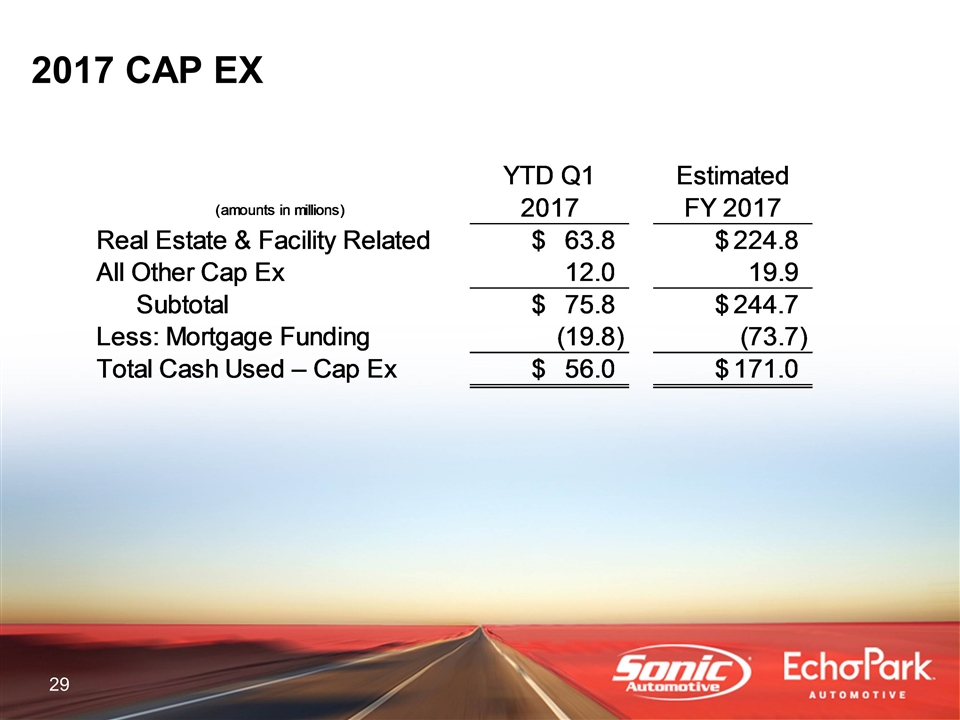
2017 CAP EX (amounts in millions) YTD Q1 2017 Estimated FY 2017 Real Estate & Facility Related $63.8 $224.8 All Other Cap Ex 12 19.899999999999999 Subtotal $75.8 $244.70000000000002 Less: Mortgage Funding -19.8 -73.7 Total Cash Used – Cap Ex $56 $171
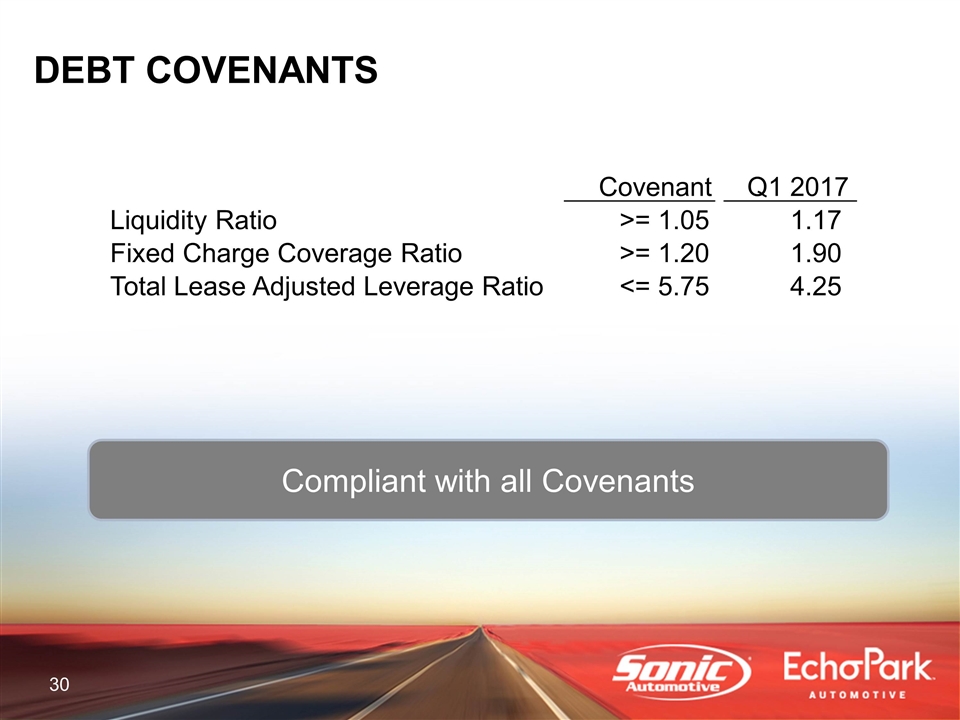
DEBT COVENANTS Compliant with all Covenants Covenant Q1 2017 Liquidity Ratio >= 1.05 1.17 Fixed Charge Coverage Ratio >= 1.20 1.90 Total Lease Adjusted Leverage Ratio <= 5.75 4.25
OPERATIONS REVIEW
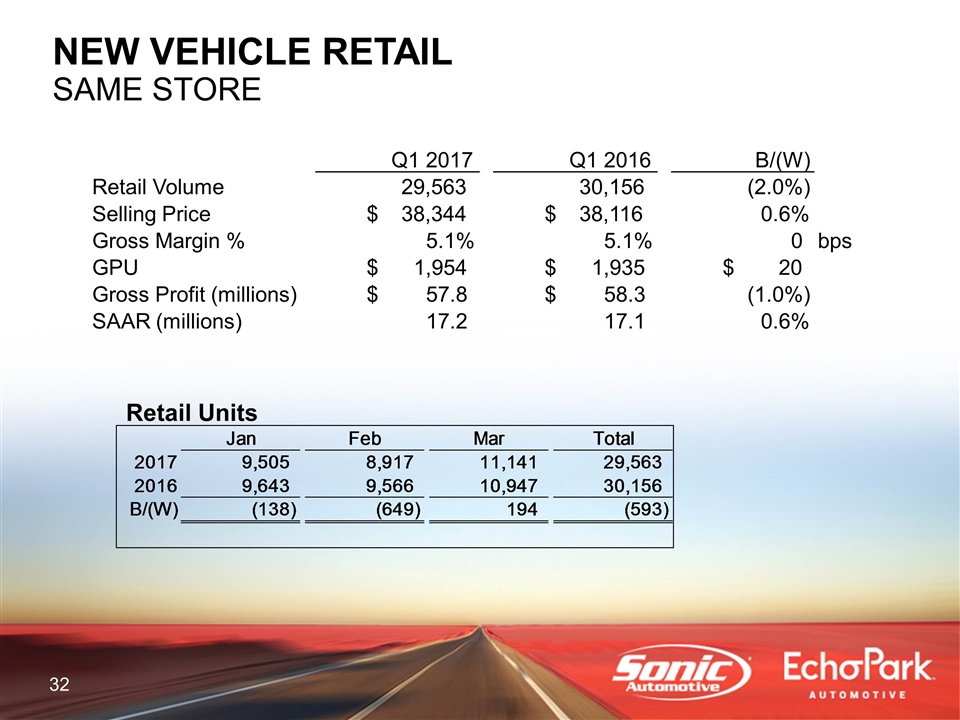
NEW VEHICLE RETAIL SAME STORE Retail Units Q1 2017 Q1 2016 B/(W) Retail Volume 29,563 30,156 (2.0%) Selling Price 38,344 $ 38,116 $ 0.6% Gross Margin % 5.1% 5.1% 0 bps GPU 1,954 $ 1,935 $ 20 $ Gross Profit (millions) 57.8 $ 58.3 $ (1.0%) SAAR (millions) 17.2 17.1 0.6% Jan Feb Mar Total 2017 9,505 8,917 11,141 29,563 2016 9,643 9,566 10,947 30,156 B/(W) -,138 -,649 194 -,593 SAAR - Keyed 18 17.899999999999999 .6% 0.10000000000000142 5.5865921787710297E-3
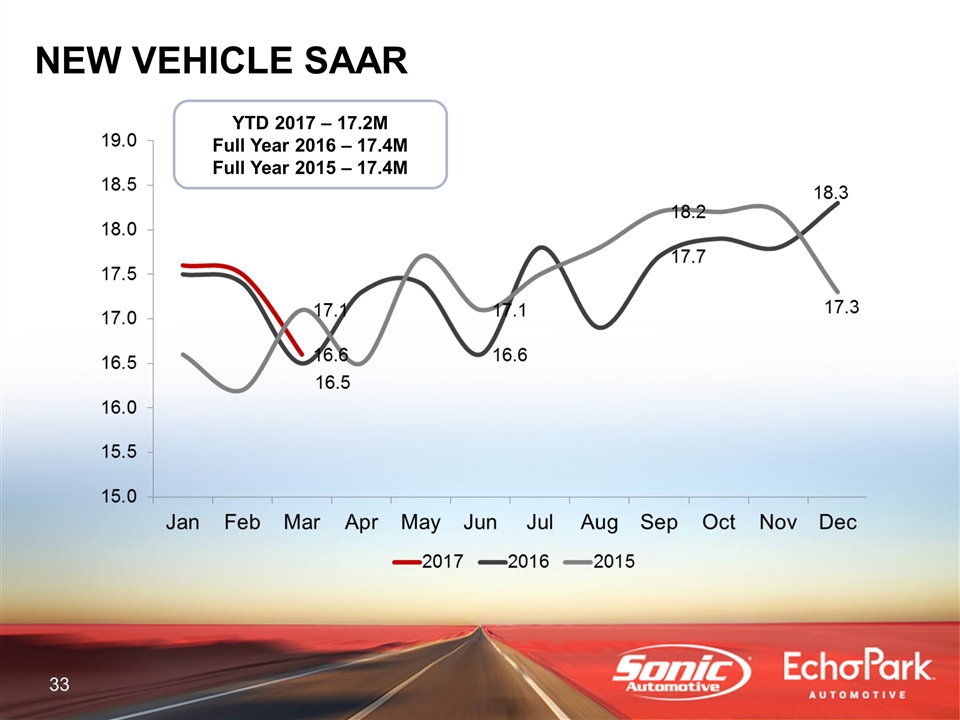
NEW VEHICLE SAAR YTD 2017 – 17.2M Full Year 2016 – 17.4M Full Year 2015 – 17.4M
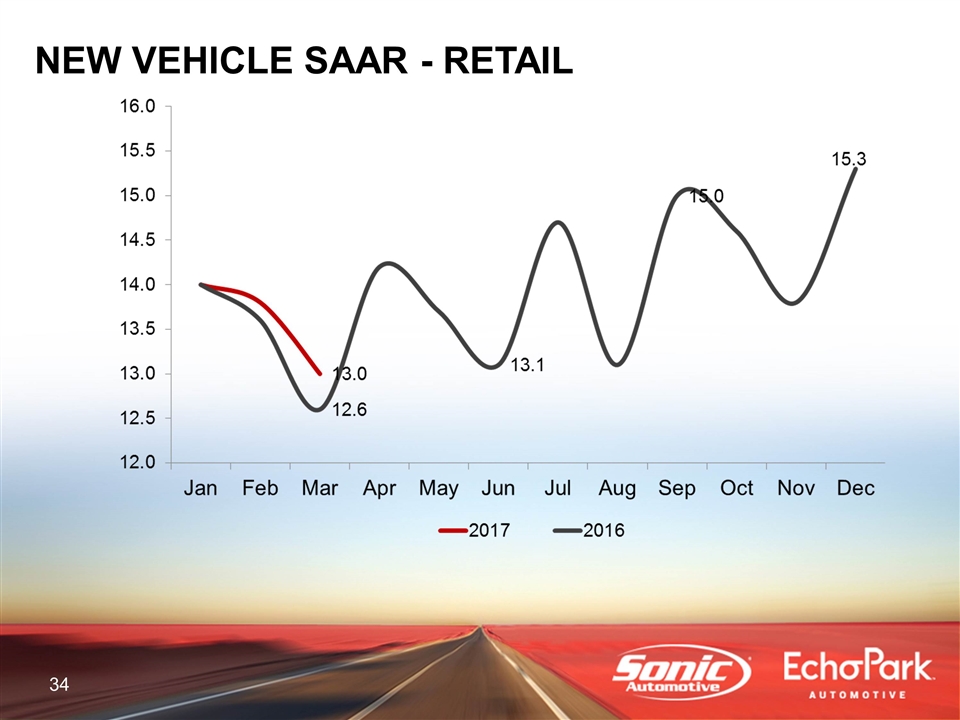
NEW VEHICLE SAAR - RETAIL
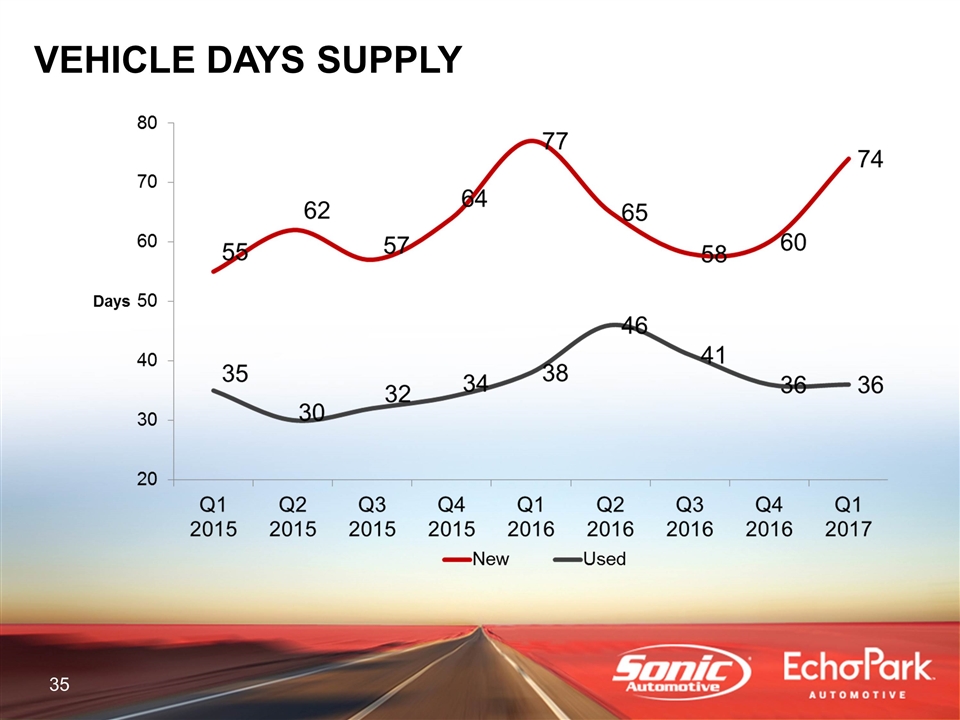
VEHICLE DAYS SUPPLY
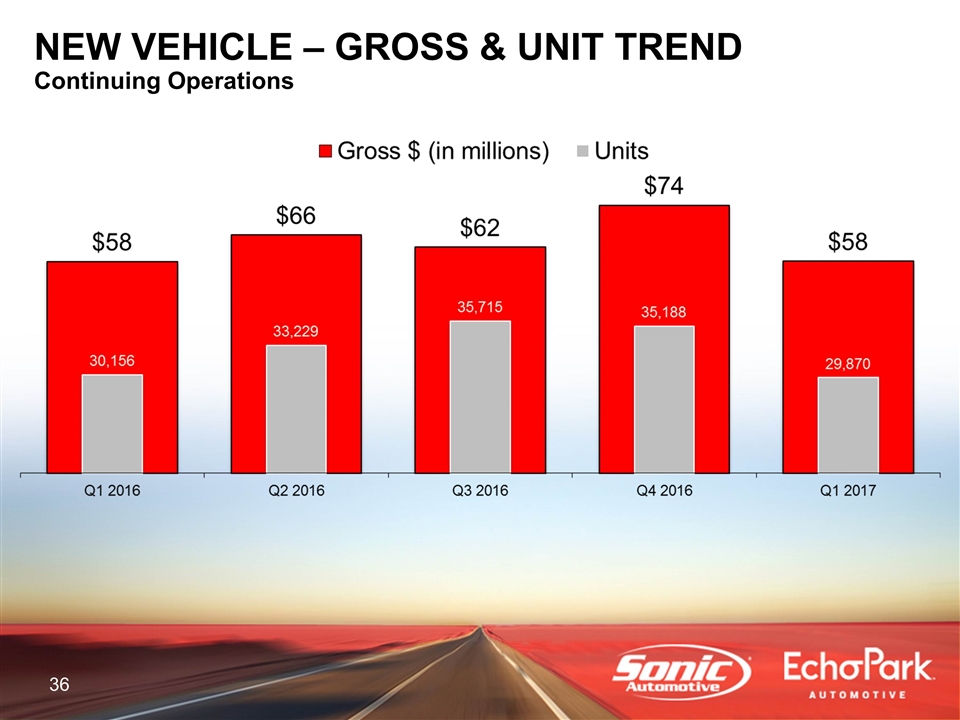
NEW VEHICLE NEW VEHICLE – GROSS & UNIT TREND Continuing Operations
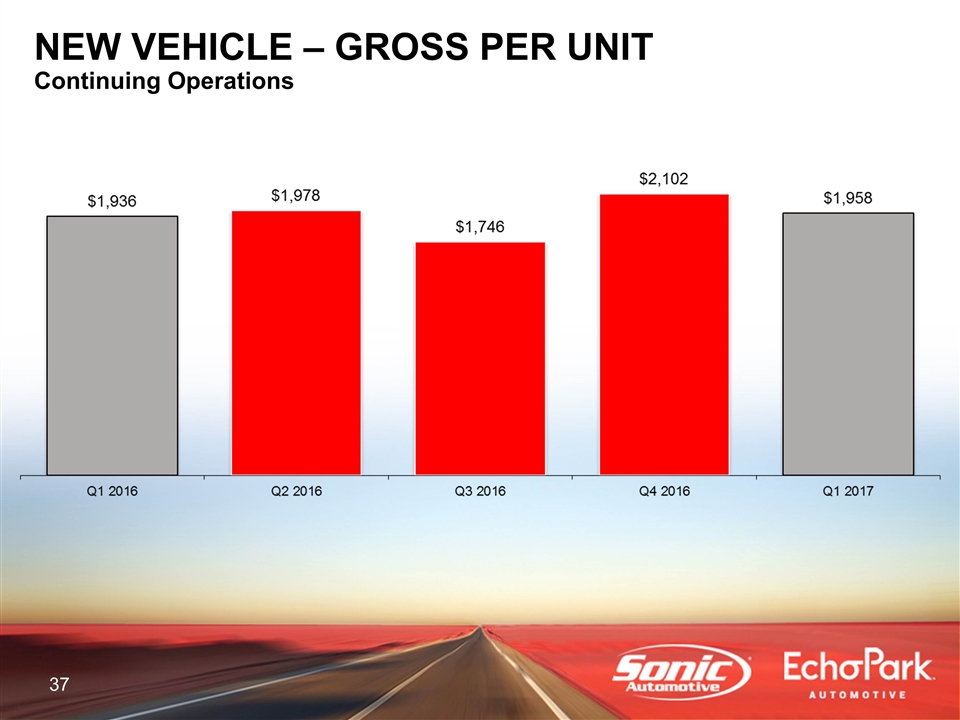
NEW VEHICLE NEW VEHICLE – GROSS PER UNIT Continuing Operations
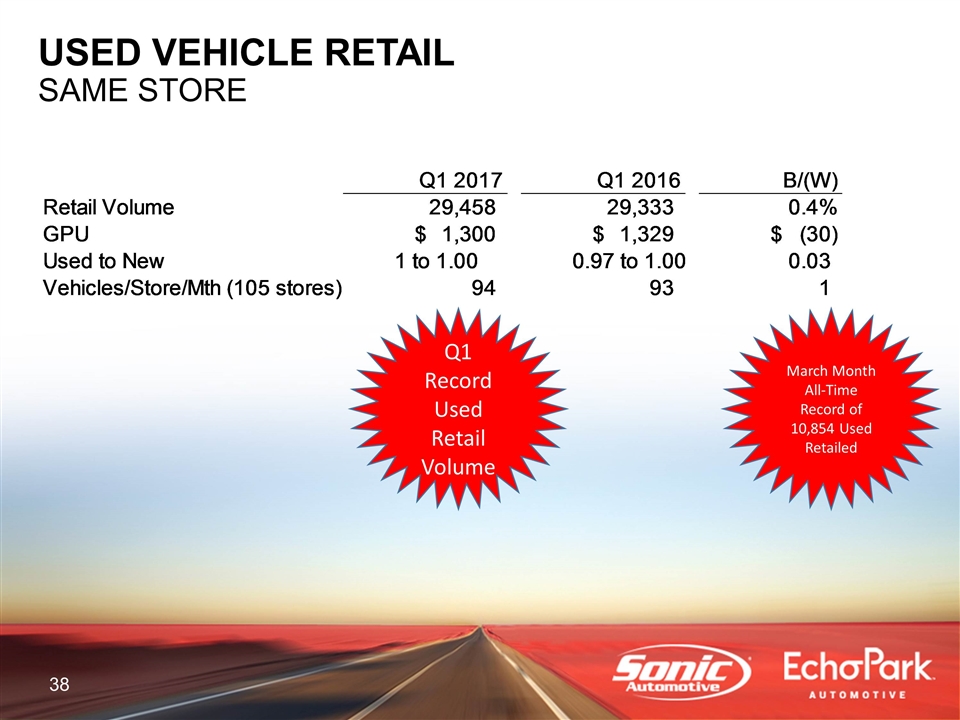
USED VEHICLE RETAIL SAME STORE Q1 Record Used Retail Volume March Month All-Time Record of 10,854 Used Retailed Q1 2017 Q1 2016 B/(W) Retail Volume 29,458 29,333 .4261412062% GPU $1,299.6950353045147 $1,329.2717543381109 $-29.576719033596191 Used to New 1 to 1.00 0.97 to 1.00 0.03 Vehicles/Store/Mth (105 stores) 94 93 1 Vehicles per store/month (Keyed) $0 $0 0.0%
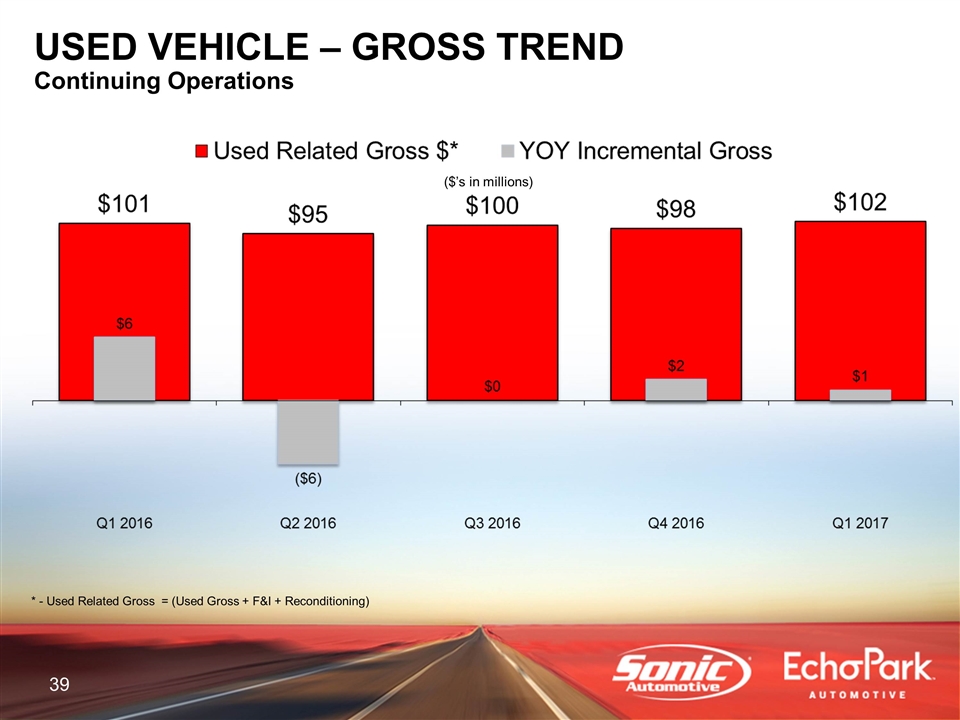
* - Used Related Gross = (Used Gross + F&I + Reconditioning) ($’s in millions) USED VEHICLE – GROSS TREND Continuing Operations
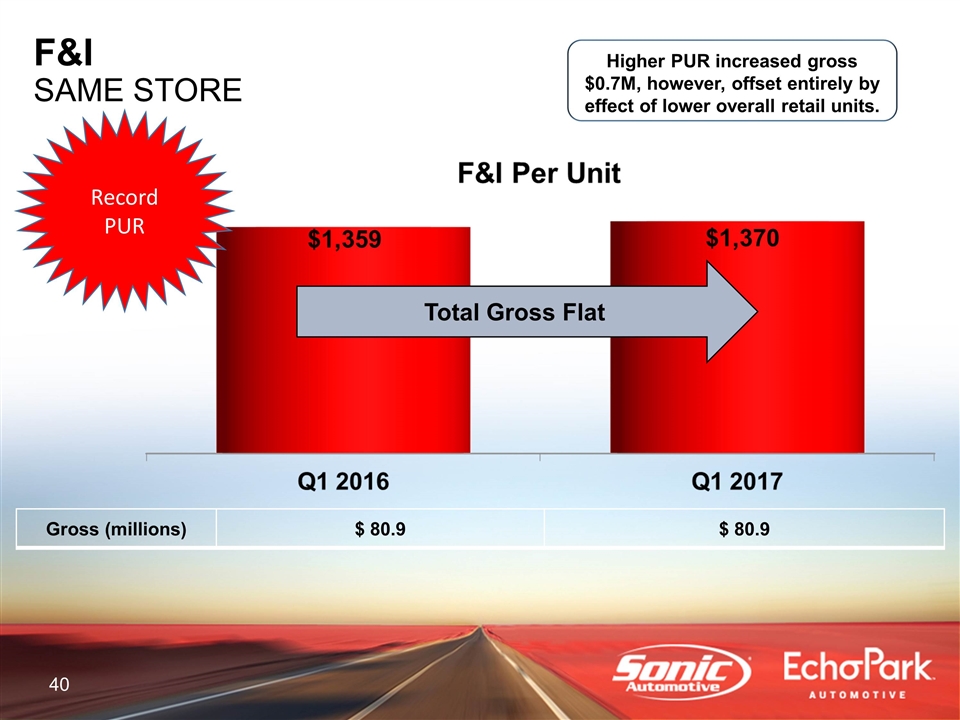
Total Gross Flat Higher PUR increased gross $0.7M, however, offset entirely by effect of lower overall retail units. Gross (millions) $ 80.9 $ 80.9 F&I SAME STORE Record PUR
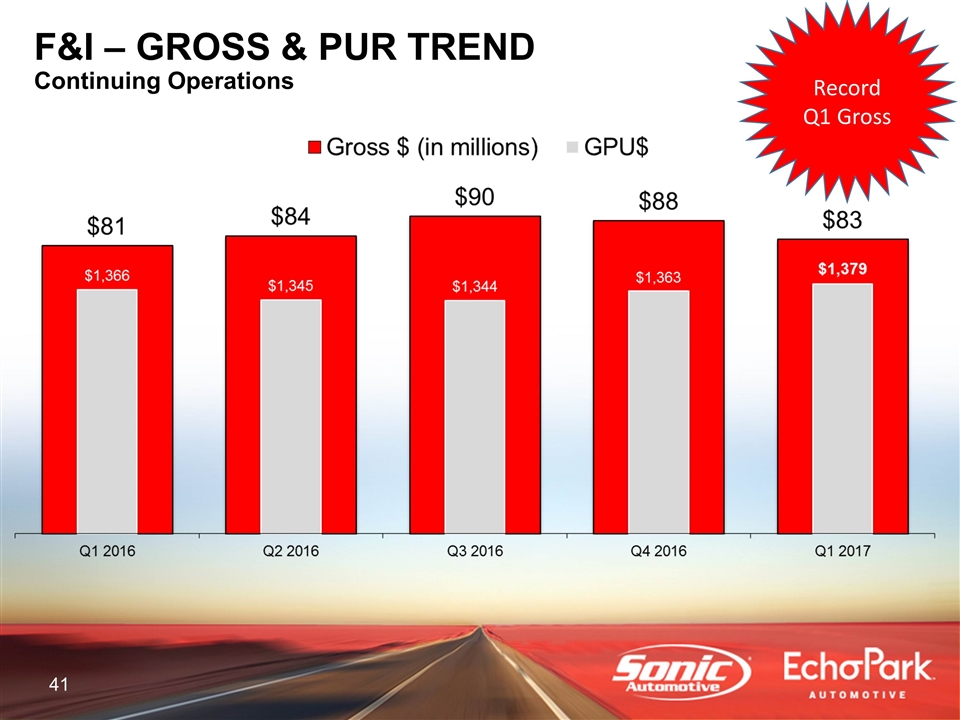
F&I F&I – GROSS & PUR TREND Continuing Operations Record Q1 Gross
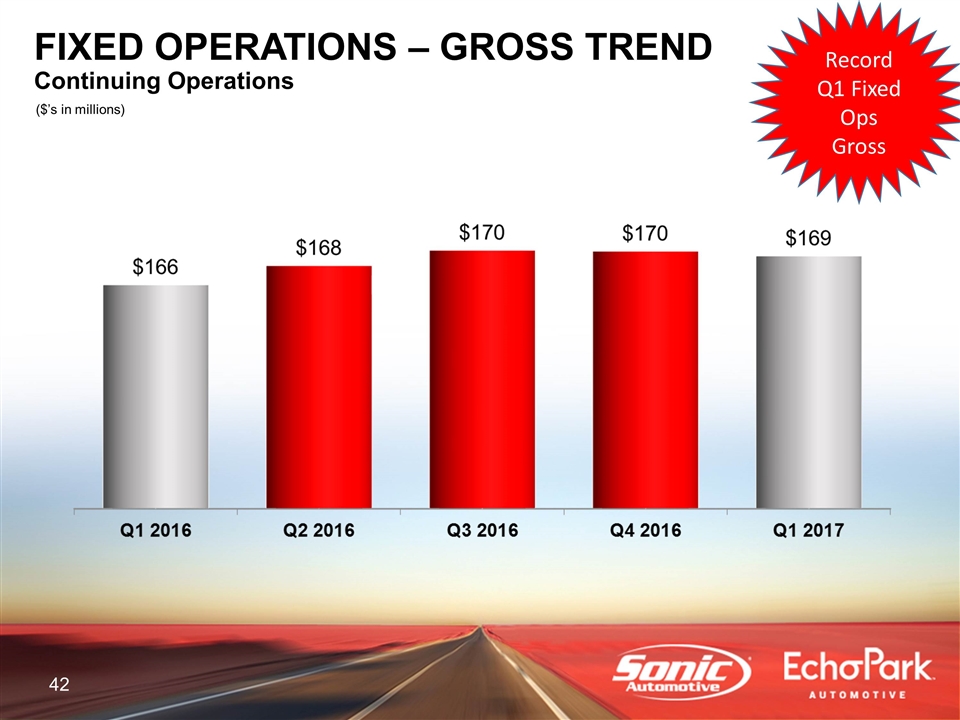
FIXED OPERATIONS ($’s in millions) FIXED OPERATIONS – GROSS TREND Continuing Operations Record Q1 Fixed Ops Gross
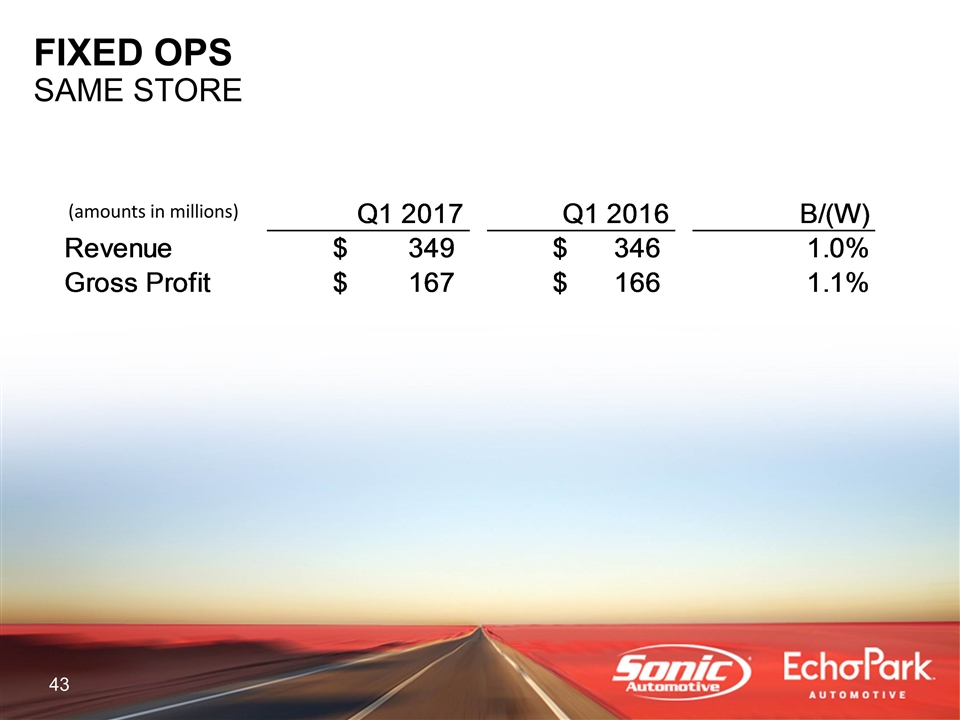
FIXED OPS SAME STORE (amounts in millions) Q1 2017 Q1 2016 B/(W) Revenue $349.44485698 $346.05449943000002 .9797178062% Gross Profit $167.47825774 $165.64933493999999 1.1040930534% SAAR - Keyed 17.8M 16.8M 0.06
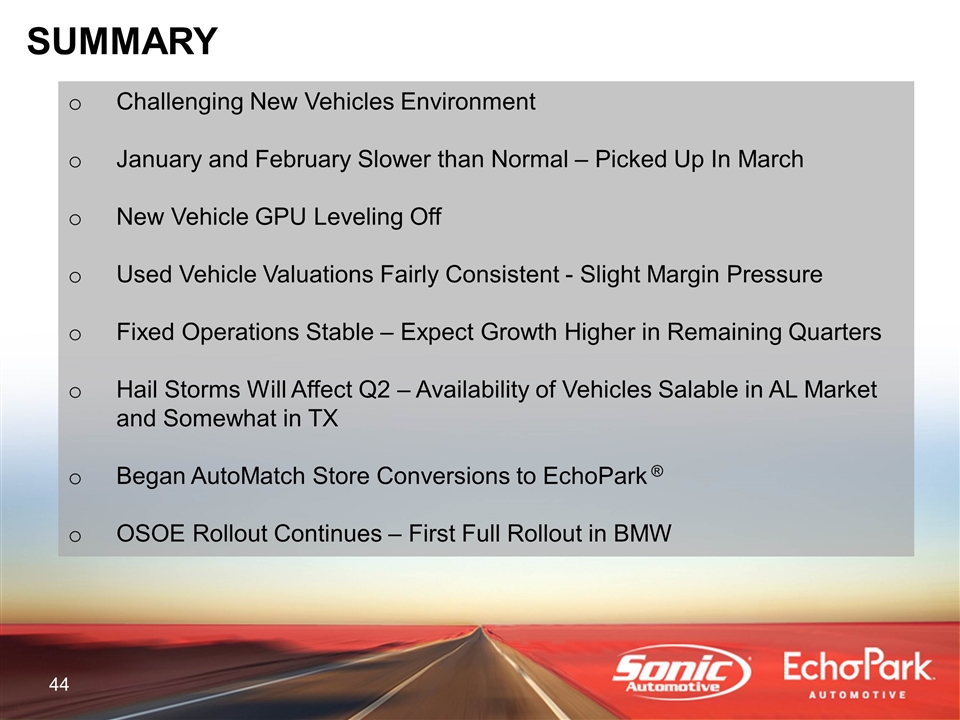
SUMMARY Challenging New Vehicles Environment January and February Slower than Normal – Picked Up In March New Vehicle GPU Leveling Off Used Vehicle Valuations Fairly Consistent - Slight Margin Pressure Fixed Operations Stable – Expect Growth Higher in Remaining Quarters Hail Storms Will Affect Q2 – Availability of Vehicles Salable in AL Market and Somewhat in TX Began AutoMatch Store Conversions to EchoPark ® OSOE Rollout Continues – First Full Rollout in BMW
APPENDIX
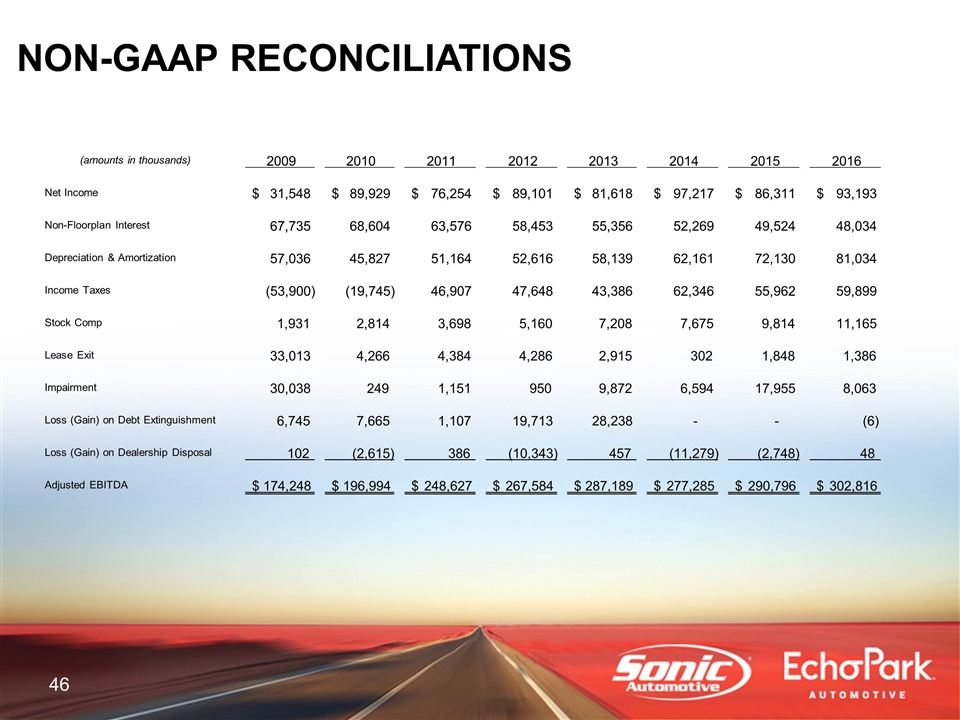
NON-GAAP RECONCILIATIONS (amounts in thousands) 2009 2010 2011 2012 2013 2014 2015 2016 Net Income 31,548 $ 89,929 $ 76,254 $ 89,101 $ 81,618 $ 97,217 $ 86,311 $ 93,193 $ Non-Floorplan Interest 67,735 68,604 63,576 58,453 55,356 52,269 49,524 48,034 Depreciation & Amortization 57,036 45,827 51,164 52,616 58,139 62,161 72,130 81,034 Income Taxes (53,900) (19,745) 46,907 47,648 43,386 62,346 55,962 59,899 Stock Comp 1,931 2,814 3,698 5,160 7,208 7,675 9,814 11,165 Lease Exit 33,013 4,266 4,384 4,286 2,915 302 1,848 1,386 Impairment 30,038 249 1,151 950 9,872 6,594 17,955 8,063 Loss (Gain) on Debt Extinguishment 6,745 7,665 1,107 19,713 28,238 - - (6) Loss (Gain) on Dealership Disposal 102 (2,615) 386 (10,343) 457 (11,279) (2,748) 48 Adjusted EBITDA 174,248 $ 196,994 $ 248,627 $ 267,584 $ 287,189 $ 277,285 $ 290,796 $ 302,816 $
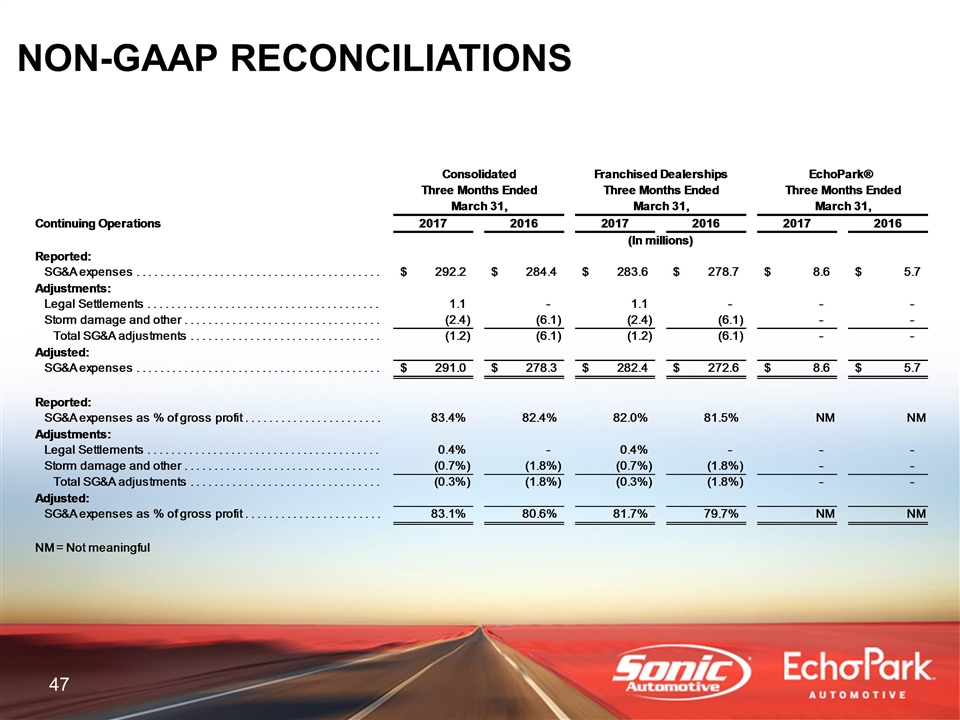
NON-GAAP RECONCILIATIONS
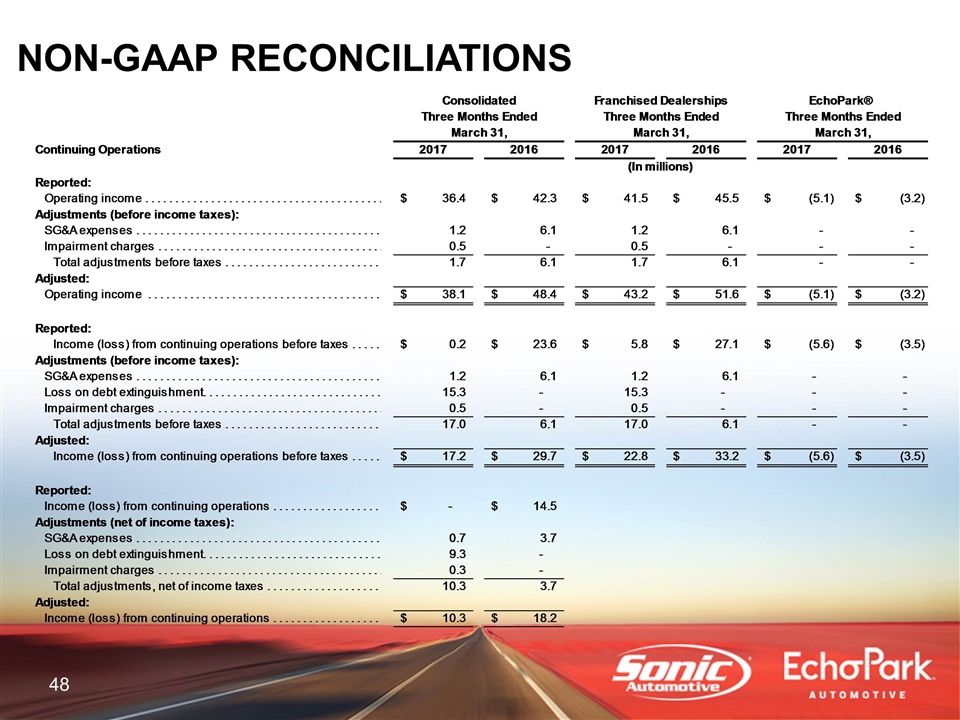
NON-GAAP RECONCILIATIONS
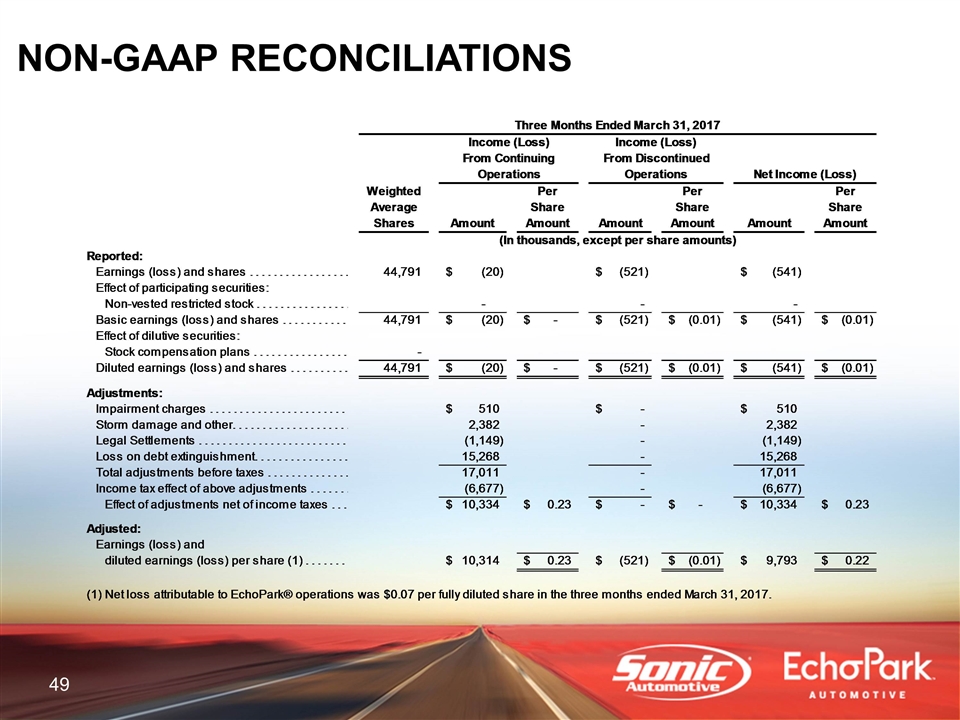
NON-GAAP RECONCILIATIONS
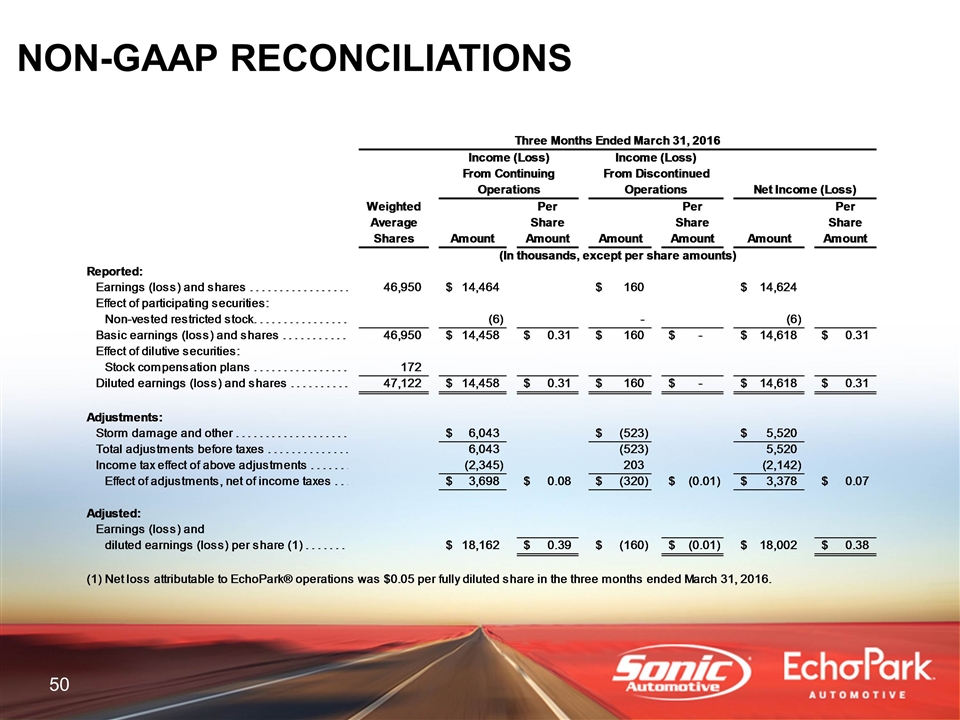
NON-GAAP RECONCILIATIONS
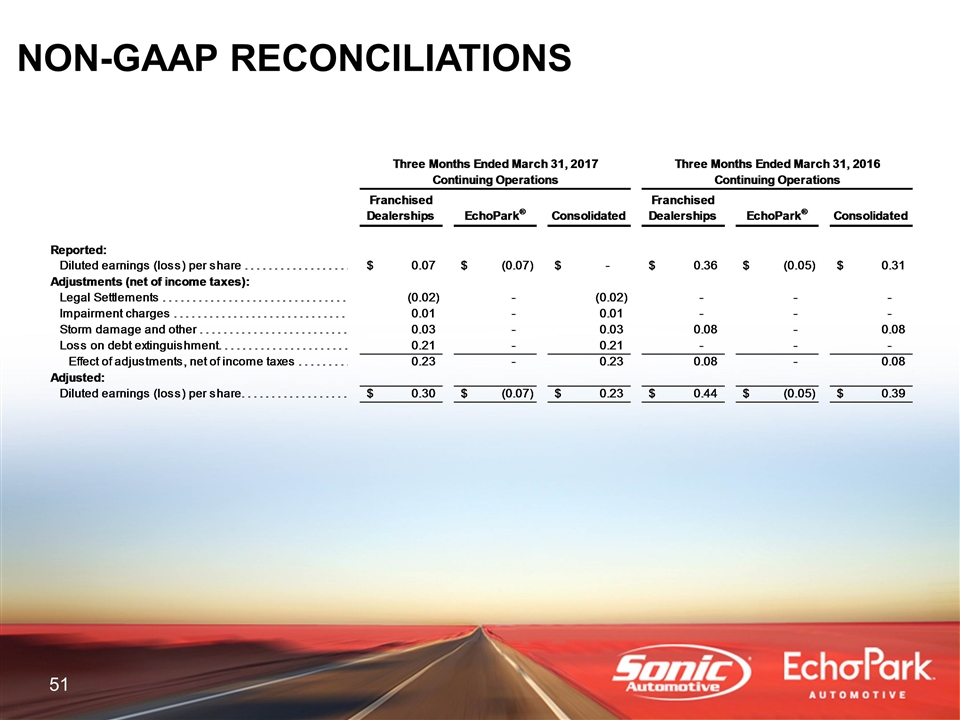
NON-GAAP RECONCILIATIONS
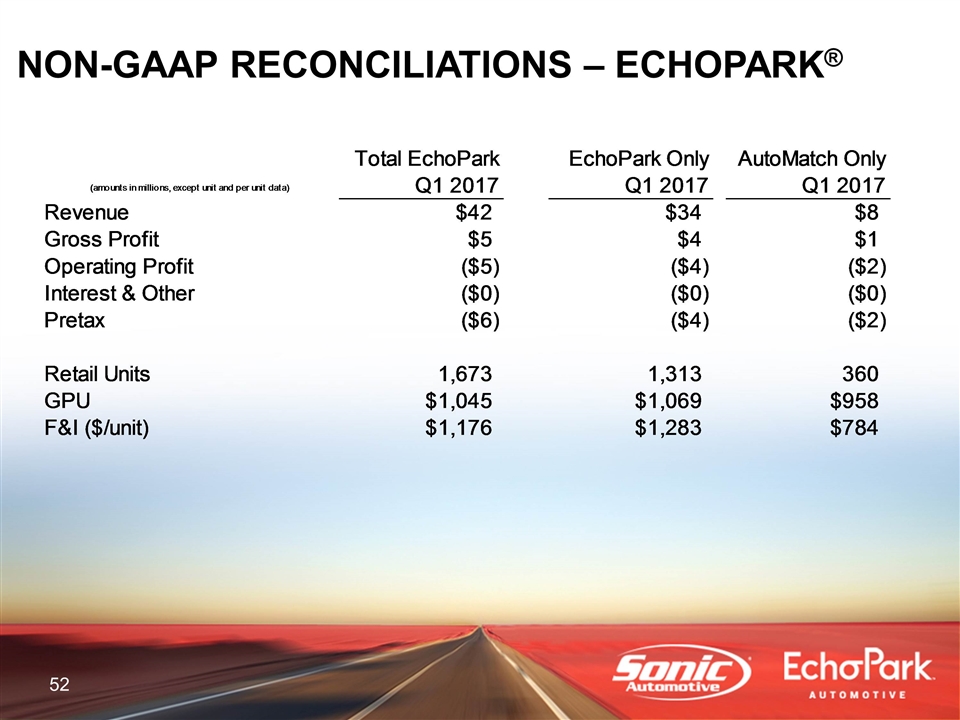
5 NON-GAAP RECONCILIATIONS – ECHOPARK® Total EchoPark EchoPark Only AutoMatch Only (amounts in millions, except unit and per unit data) Q1 2017 Q1 2017 Q1 2017 Revenue $41.797235549999996 $33.665376829999992 $8.1318587200000003 Gross Profit $4.6646679900000096 $4.0060857900000091 $0.65858220000000101 Operating Profit $-5.1308441299999892 $-3.6051956699999894 $-1.52564846 Interest & Other $-0.44245117999999994 $-0.35398884999999997 $-8.8462330000000006E-2 Pretax $-5.57329530999999 $-3.9591845199999907 $-1.61411079 Retail Units 1,673 1,313 360 GPU $1,045.3807710699343 $1,069.2296191926876 $958.39872222222505 F&I ($/unit) $1,175.7141542139868 $1,283.155559786748 $783.85147222222236 Diluted EPS Keyed $-7.0000000000000007E-2 CY -7.0000000000000007E-2 PY -0.05 Change -2.0000000000000004E-2 % Change 0.40000000000000008