

Q2 2017 Investor Presentation July 28, 2017 Exhibit 99.2
FORWARD-LOOKING STATEMENTS This presentation contains “forward-looking statements” within the meaning of the Private Securities Litigation Reform Act of 1995. These statements relate to future events, are not historical facts and are based on our current expectations and assumptions regarding our business, the economy and other future conditions. These statements can generally be identified by lead-in words such as “believe”, “expect”, “anticipate”, “intend”, “plan”, “foresee”, “may”, “will” and other similar words. Statements that describe our Company’s objectives, plans or goals are also forward-looking statements. Examples of such forward-looking information we may be discussing in this presentation include, without limitation, earnings expectations, anticipated 2017 industry new vehicle sales volume, the implementation of growth and operating strategies, including acquisitions of dealerships and properties, the development of open points and stand-alone pre-owned stores, the return of capital to shareholders, anticipated future success and impacts from the implementation of our strategic initiatives and earnings per share expectations. You are cautioned that these forward-looking statements are not guarantees of future performance, involve risks and uncertainties and actual results may differ materially from those projected in the forward-looking statements as a result of various factors. These risks and uncertainties include, among other things, (a) economic conditions in the markets in which we operate, (b) the success of our operational strategies, (c) our relationships with the automobile manufacturers, (d) new and pre-owned vehicle sales volume, and (e) earnings expectations for the year ending December 31, 2017. These risks and uncertainties, as well as additional factors that could affect our forward-looking statements, are described in our Form 10-K for the year ended December 31, 2016. These forward-looking statements, risks, uncertainties and additional factors speak only as of the date of this presentation. We undertake no obligation to update any such statements.
CONTENT COMPANY OVERVIEW STRATEGIC FOCUS FINANCIAL REVIEW OPERATIONS REVIEW SUMMARY & OUTLOOK

COMPANY OVERVIEW
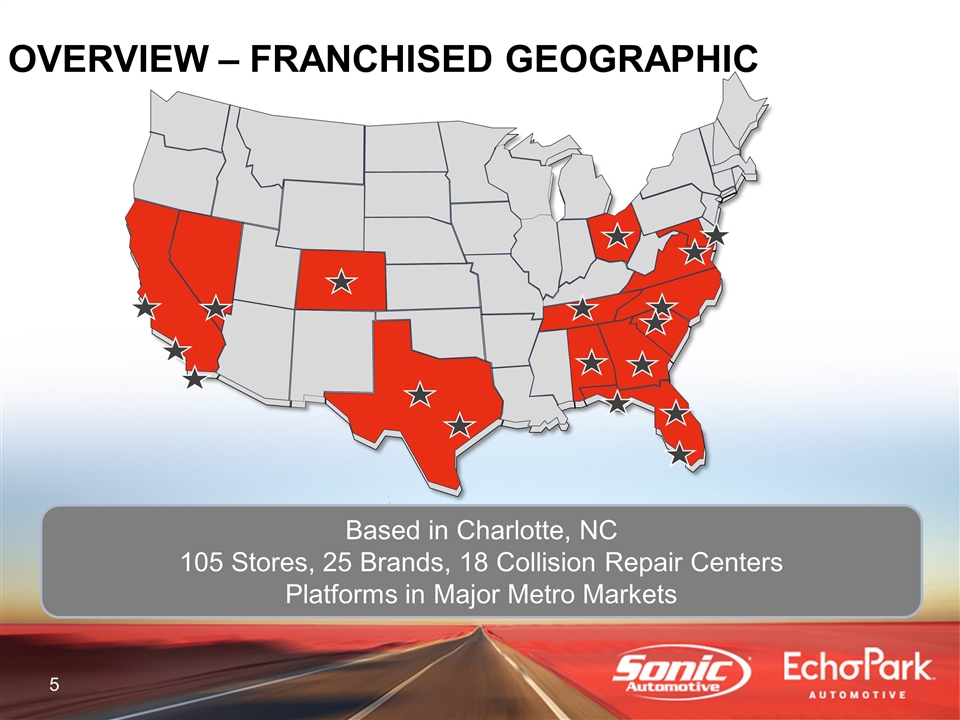
OVERVIEW – FRANCHISED GEOGRAPHIC Based in Charlotte, NC 105 Stores, 25 Brands, 18 Collision Repair Centers Platforms in Major Metro Markets
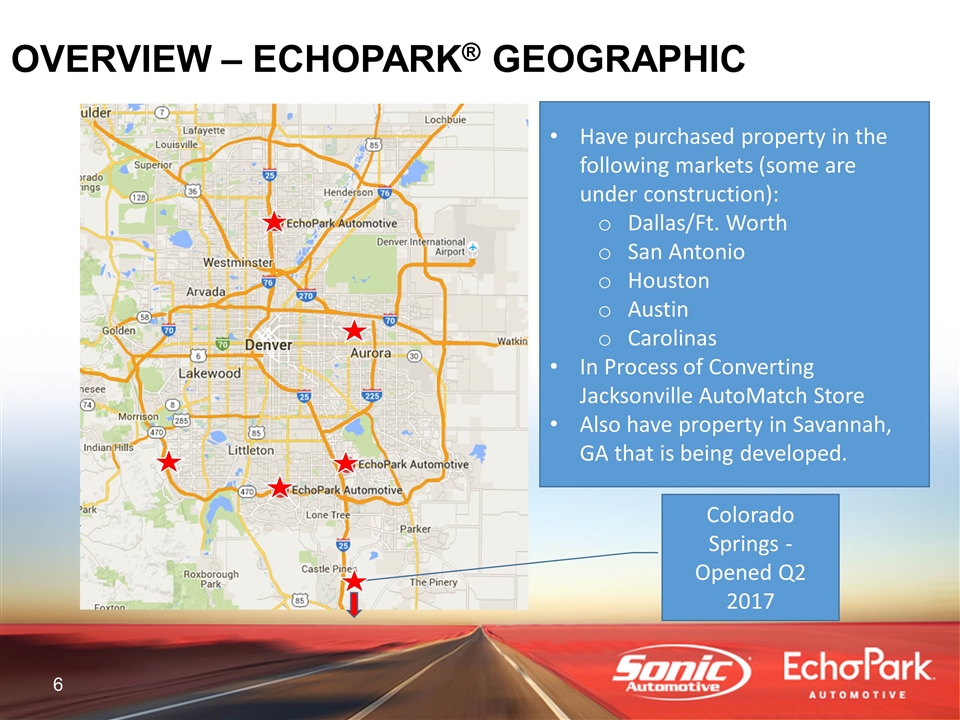
OVERVIEW – ECHOPARK® GEOGRAPHIC Colorado Springs - Opened Q2 2017 Have purchased property in the following markets (some are under construction): Dallas/Ft. Worth San Antonio Houston Austin Carolinas In Process of Converting Jacksonville AutoMatch Store Also have property in Savannah, GA that is being developed.
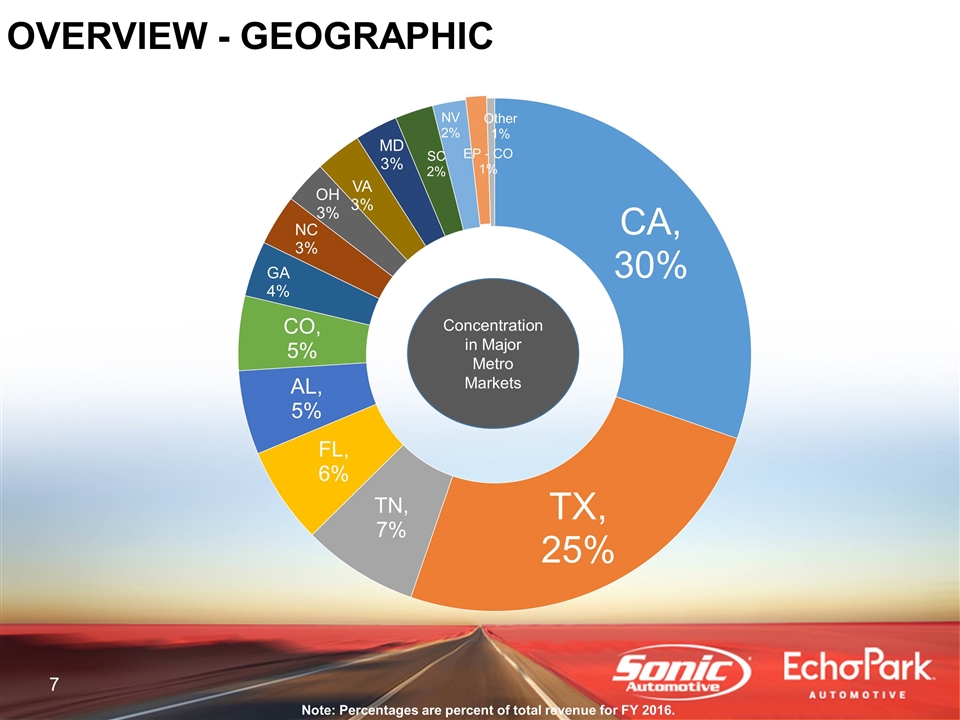
Note: Percentages are percent of total revenue for FY 2016. Concentration in Major Metro Markets
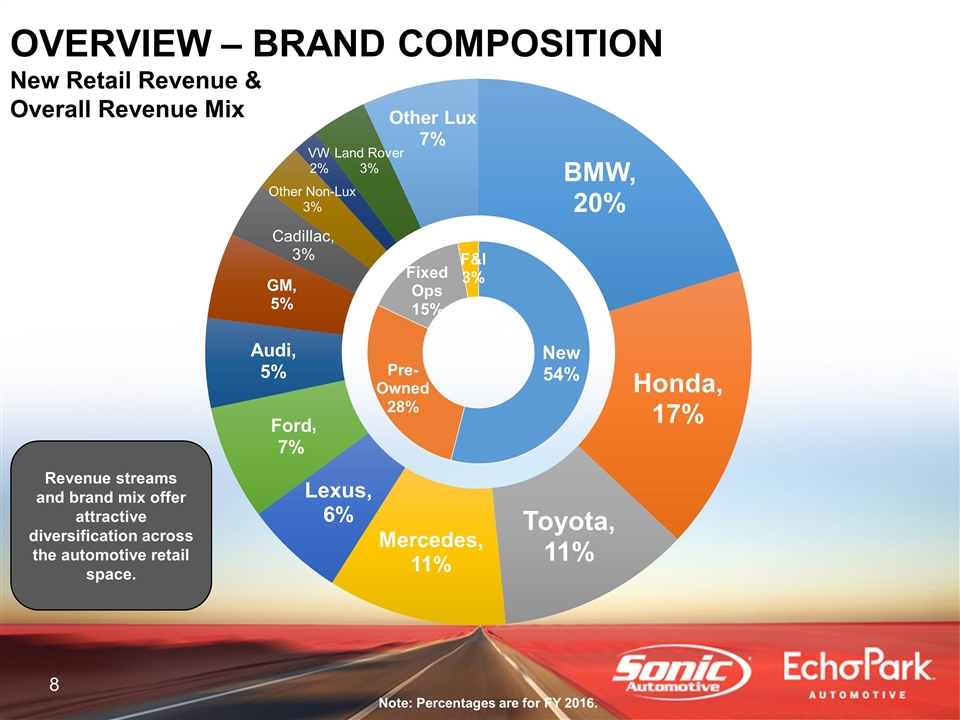
Revenue streams and brand mix offer attractive diversification across the automotive retail space. Note: Percentages are for FY 2016. ,

STRATEGIC FOCUS
STRATEGIC FOCUS Growth EchoPark® One Sonic-One Experience Acquisitions & Open Points Own Our Properties Return Capital to Shareholders Share Repurchases Dividends
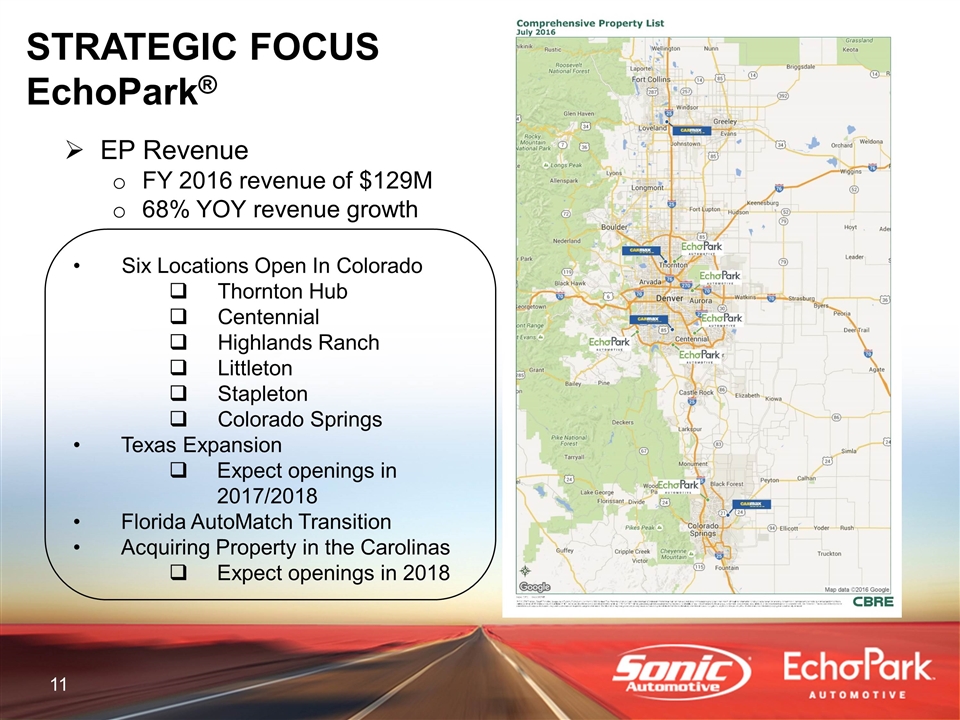
STRATEGIC FOCUS EchoPark® Six Locations Open In Colorado Thornton Hub Centennial Highlands Ranch Littleton Stapleton Colorado Springs Texas Expansion Expect openings in 2017/2018 Florida AutoMatch Transition Acquiring Property in the Carolinas Expect openings in 2018 EP Revenue FY 2016 revenue of $129M 68% YOY revenue growth
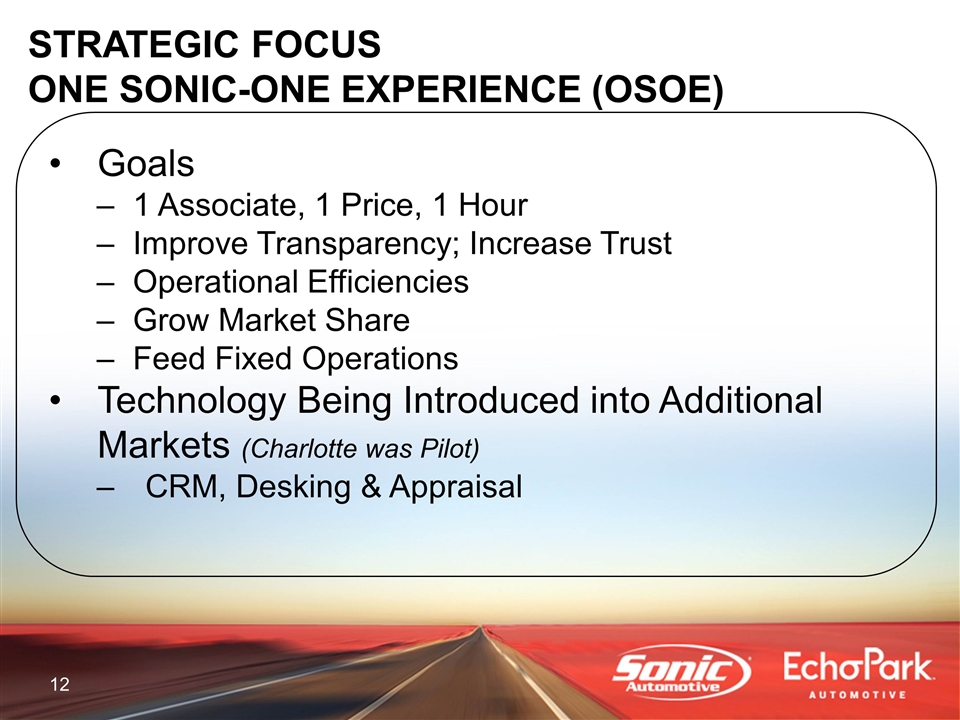
STRATEGIC FOCUS ONE SONIC-ONE EXPERIENCE (OSOE) Goals 1 Associate, 1 Price, 1 Hour Improve Transparency; Increase Trust Operational Efficiencies Grow Market Share Feed Fixed Operations Technology Being Introduced into Additional Markets (Charlotte was Pilot) CRM, Desking & Appraisal
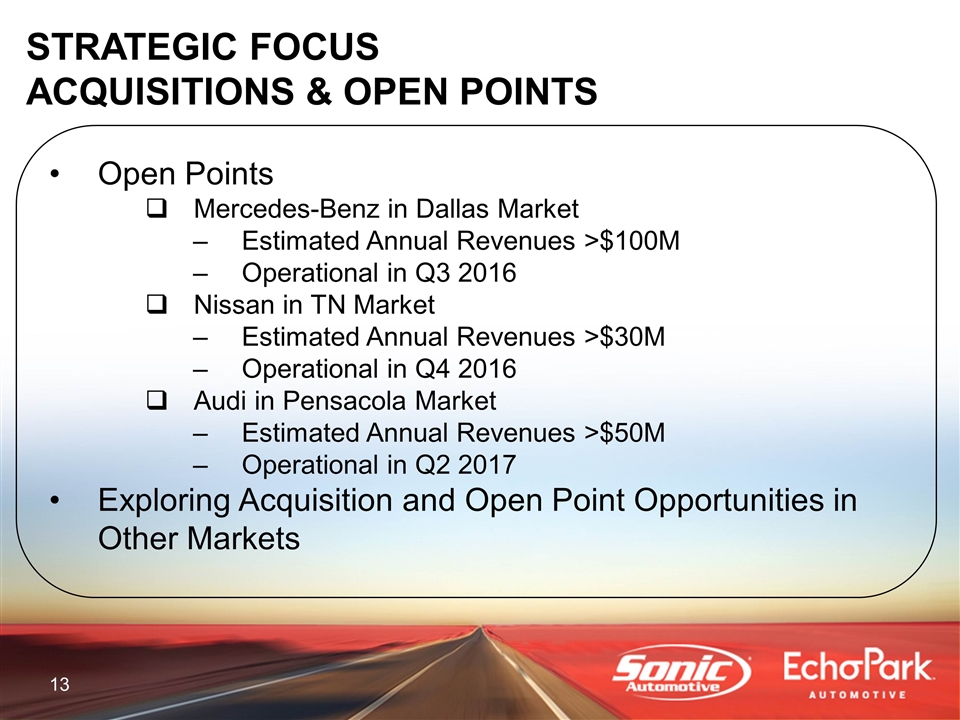
STRATEGIC FOCUS ACQUISITIONS & OPEN POINTS Open Points Mercedes-Benz in Dallas Market Estimated Annual Revenues >$100M Operational in Q3 2016 Nissan in TN Market Estimated Annual Revenues >$30M Operational in Q4 2016 Audi in Pensacola Market Estimated Annual Revenues >$50M Operational in Q2 2017 Exploring Acquisition and Open Point Opportunities in Other Markets
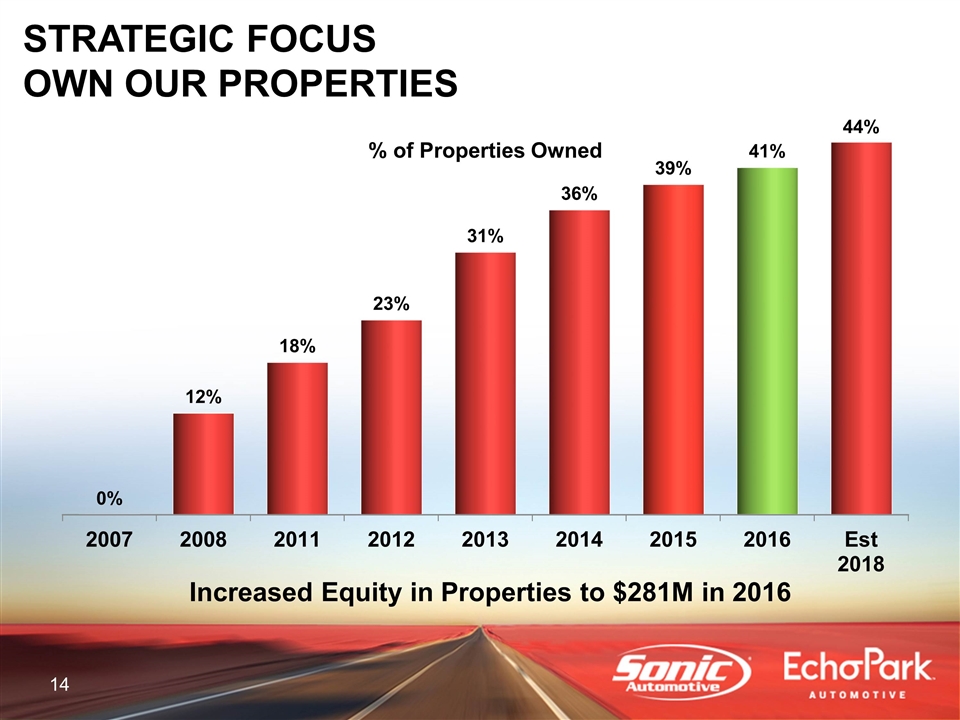
STRATEGIC FOCUS OWN OUR PROPERTIES % of Properties Owned Increased Equity in Properties to $281M in 2016
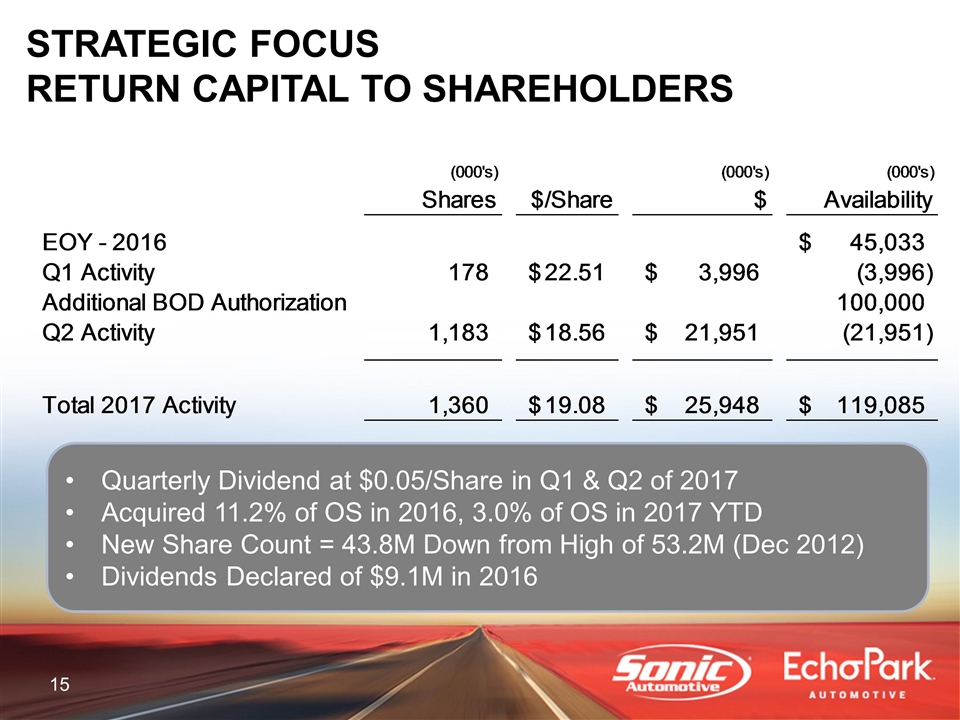
STRATEGIC FOCUS RETURN CAPITAL TO SHAREHOLDERS Quarterly Dividend at $0.05/Share in Q1 & Q2 of 2017 Acquired 11.2% of OS in 2016, 3.0% of OS in 2017 YTD New Share Count = 43.8M Down from High of 53.2M (Dec 2012) Dividends Declared of $9.1M in 2016 (000's) (000's) (000's) Shares $/Share $ Availability EOY - 2016 $45,032.523000000001 Q1 Activity 177.53200000000001 $22.509677128630329 $3,996.1880000000001 -3,996.1880000000001 Additional BOD Authorization ,100,000 Q2 Activity 1,182.6500000000001 $18.561160952099097 $21,951.357 ,-21,951.357 Total 2017 Activity 1,360.182 $19.076524318069197 $25,947.544999999998 $,119,084.97799999999
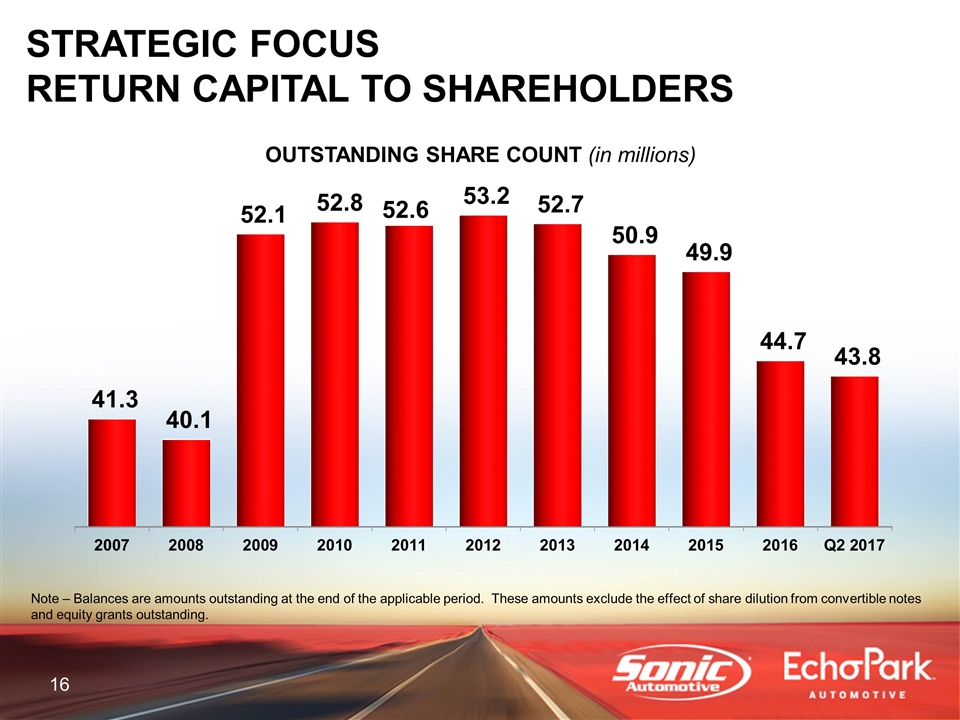
OUTSTANDING SHARE COUNT (in millions) Note – Balances are amounts outstanding at the end of the applicable period. These amounts exclude the effect of share dilution from convertible notes and equity grants outstanding. STRATEGIC FOCUS RETURN CAPITAL TO SHAREHOLDERS
Q2 2017 FINANCIAL REVIEW
Q2 2017 FINANCIAL REVIEW FRANCHISED SEGMENT
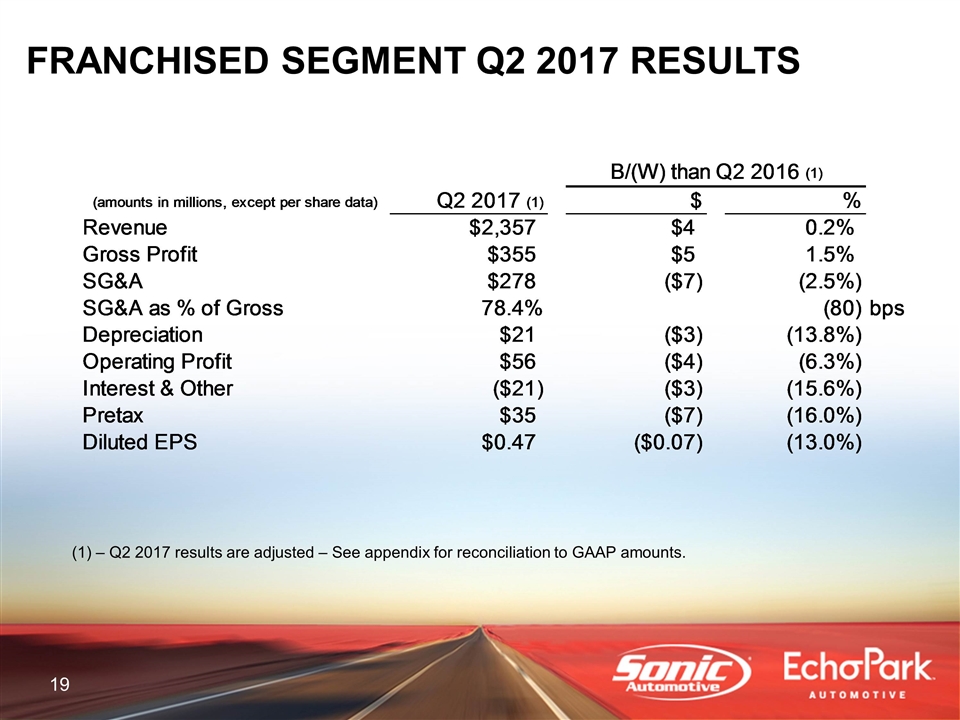
FRANCHISED SEGMENT Q2 2017 RESULTS – Q2 2017 results are adjusted – See appendix for reconciliation to GAAP amounts. B/(W) than Q2 2016 (1) (amounts in millions, except per share data) Q2 2017 (1) $ % Revenue $2,356.6915907800003 $3.8519750200100242 .163716004874% Gross Profit $355.29032416501303 $5.3475639383430247 1.528125323947% SG&A $278.43906854999898 $-6.7488868228159848 -2.484037803616% SG&A as % of Gross 0.78369448761199356 -80 bps Depreciation $20.602791739999997 $-2.5040704199998944 -0.1383562062604255 Operating Profit $56.248464274998902 $-3.7548495644674986 -6.257736988516% Interest & Other $-21.363104960000001 $-2.877822619999999 -0.15568183201469016 Pretax $34.885359314997096 $-6.6326721844706986 -0.15975401397717329 Diluted EPS $0.47 $-7.0000000000000062E-2 -0.12962962962962973 Diluted EPS Keyed $0.47 $-7.0000000000000062E-2 -0.12962962962962973 CY 0.47 PY 0.54 change -7.0000000000000062E-2 % -0.12962962962962973
Q2 2017 FINANCIAL REVIEW ECHOPARK® SEGMENT
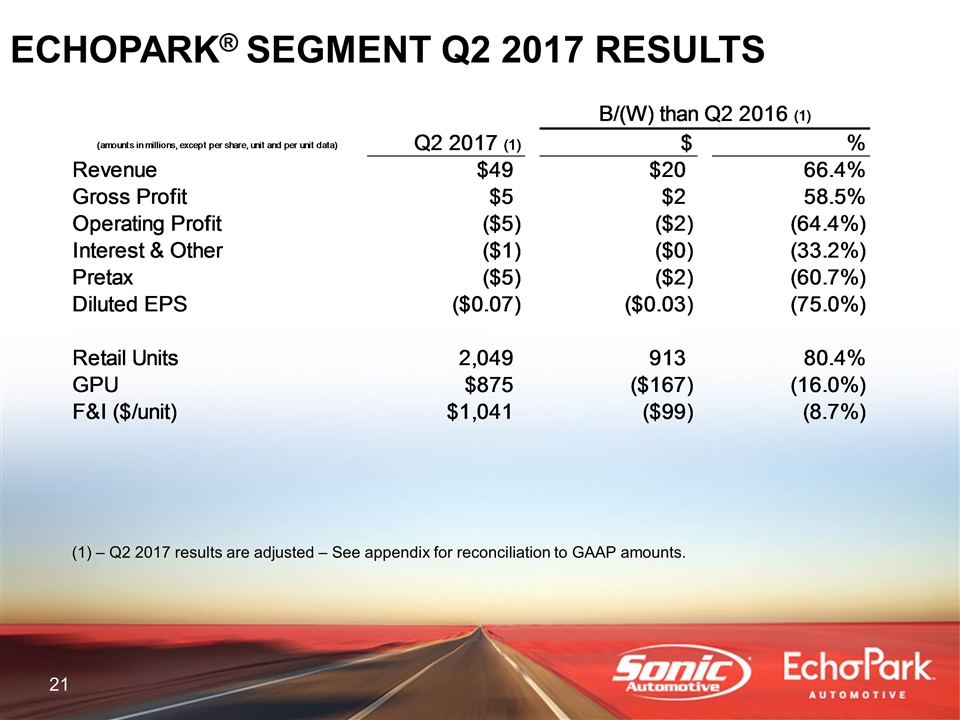
ECHOPARK® SEGMENT Q2 2017 RESULTS – Q2 2017 results are adjusted – See appendix for reconciliation to GAAP amounts. B/(W) than Q2 2016 (1) (amounts in millions, except per share, unit and per unit data) Q2 2017 (1) $ % Revenue $49.054388700000004 $19.581686550000004 0.66440078857852558 Gross Profit $5.3279714299999901 $1.9661351899999904 0.58483966785960706 Operating Profit $-4.86275681000002 $-1.9049007100000299 -0.64401399040339935 Interest & Other $-0.53789202000000003 $-0.13411134 -0.33213907114129376 Pretax $-5.4006488300000193 $-2.0390120500000393 -0.60655334988334209 Diluted EPS $-7.0000000000000007E-2 $-3.0000000000000006E-2 -0.75000000000000011 Retail Units 2,049 913 0.80369718309859151 GPU $874.96403123474374 $-,166.61652334272117 -0.15996508633968501 F&I ($/unit) $1,040.9519131283555 $-99.404662575869907 -8.7169806965% Diluted EPS Keyed $-7.0000000000000007E-2 $-3.0000000000000006E-2 -0.75000000000000011 CY -7.0000000000000007E-2 PY -0.04 Change -3.0000000000000006E-2 % Change -0.75000000000000011
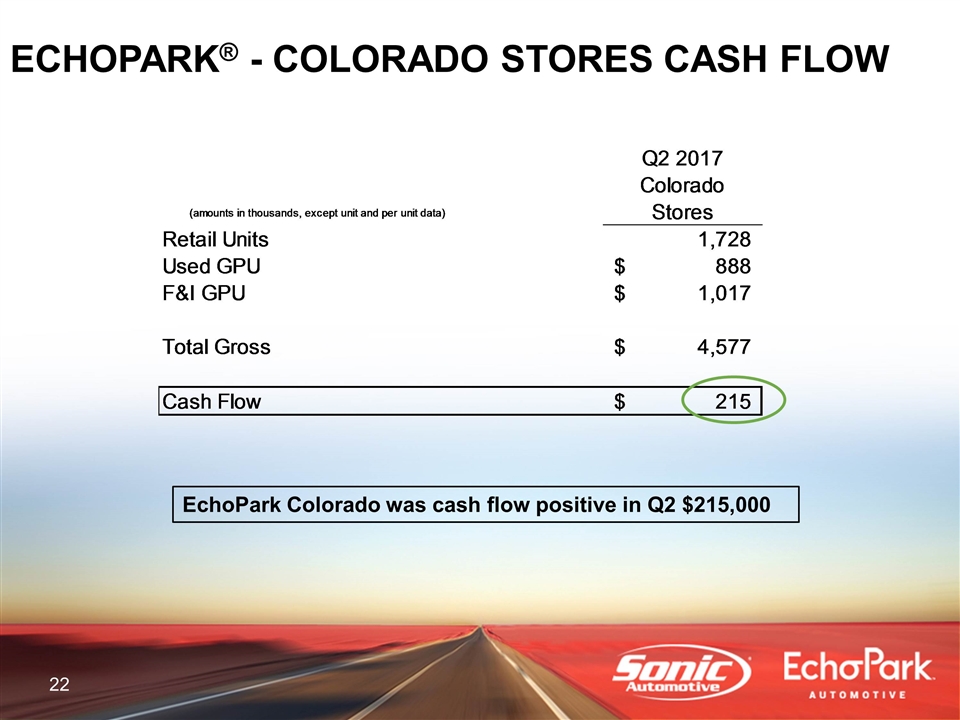
ECHOPARK® - COLORADO STORES CASH FLOW EchoPark Colorado was cash flow positive in Q2 $215,000 Q2 2017 (amounts in thousands, except unit and per unit data) Colorado Stores Retail Units 1,728 Used GPU $888.22682870370318 F&I GPU $1,017.1155671296297 Total Gross $4,576.8231700000006 Cash Flow $215.10794214000117
Q2 2017 FINANCIAL REVIEW TOTAL ENTERPRISE
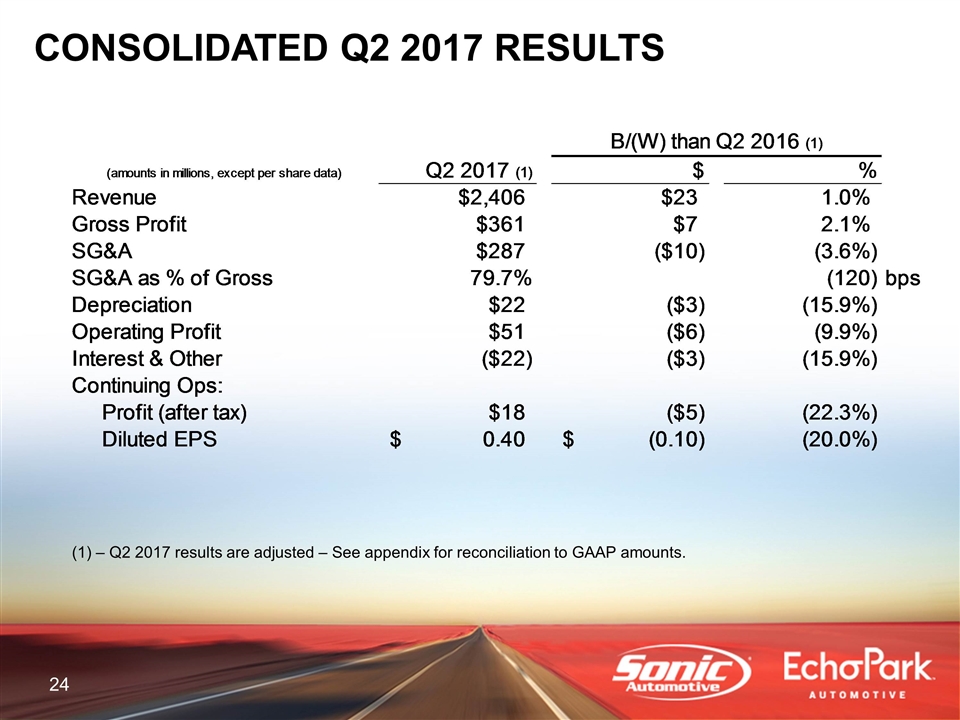
CONSOLIDATED Q2 2017 RESULTS – Q2 2017 results are adjusted – See appendix for reconciliation to GAAP amounts. B/(W) than Q2 2016 (1) (amounts in millions, except per share data) Q2 2017 (1) $ % Revenue $2,405.7459794800002 $23.433661570010241 .983651949992% Gross Profit $360.61829559501399 $7.313699128345994 2.700832090748% SG&A $287.32116615999797 $-10.116666622815014 -3.649531894217% SG&A as % of Gross 0.79674594902602758 -,120 bps Depreciation $21.911422690000002 $-3.0073268399999034 -0.15908334700915555 Operating Profit $51.38570746500001 $-5.6597502744661909 -9.921474029212% Interest & Other $-21.900996979999999 $-3.0119339600000021 -0.1594538573359052 Continuing Ops: Profit (after tax) $17.912448484999299 $-5.1303148744693026 -0.22264321316137559 Diluted EPS $0.4 $-9.9999999999999978E-2 -0.19999999999999996 KEYED CY $0.4 PY $0.5 Change $-9.9999999999999978E-2 % -0.19999999999999996
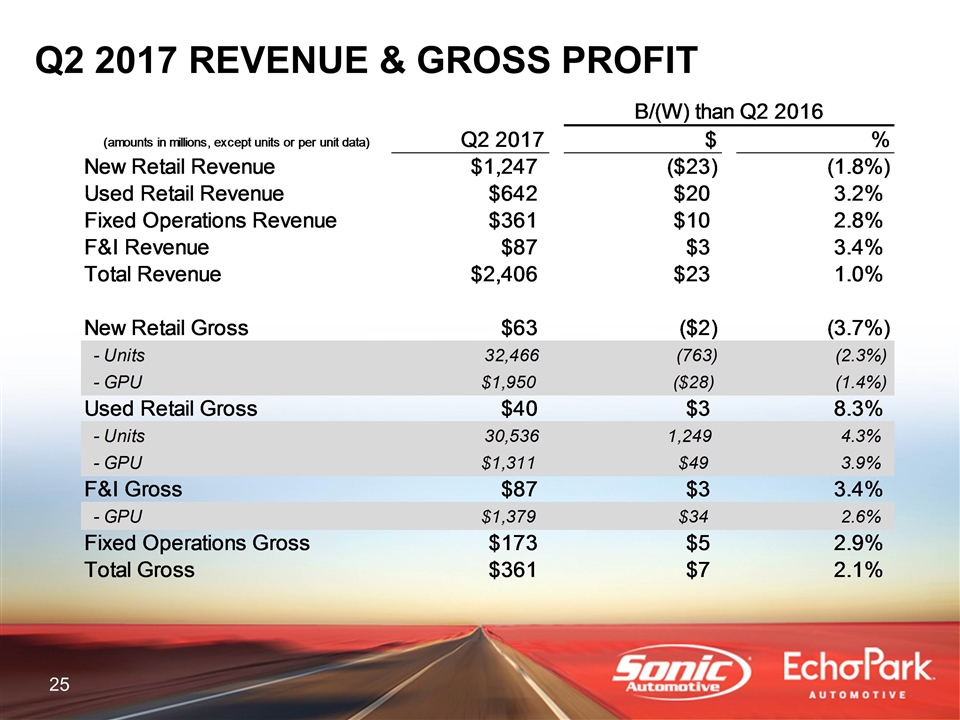
Q2 2017 REVENUE & GROSS PROFIT B/(W) than Q2 2016 (amounts in millions, except units or per unit data) Q2 2017 $ % New Retail Revenue $1,247.3184919600001 $-22.524264700000174 -1.773783768255% Used Retail Revenue $641.89062597000202 $19.705123120001982 3.167081687011% Fixed Operations Revenue $361.11303230999897 $9.7839959200000166 2.784852632886% F&I Revenue $86.907928490000216 $2.8198443699997151 3.353441096334% Total Revenue $2,405.7459794800002 $23.433661570010241 .983651949992% New Retail Gross $63.292775249999799 $-2.4315657599989065 -3.699642663026% - Units 32,466 -,763 -2.296187065515% - GPU $1,949.5094945481364 $-28.411628868117759 -1.436438922248% Used Retail Gross $40.034966765 $3.0666111383334935 8.295232737161% - Units 30,536 1,249 4.264690818452% - GPU $1,311.743635381189 $48.795686081687563 3.865682511568% F&I Gross $86.907928490000216 $2.8198443699997151 3.353441096334% - GPU $1,379.4471364401163 $34.382127162483357 2.556168432405% Fixed Operations Gross $173.06991961 $4.8485301100000218 2.882231637969% Total Gross $360.61829559501399 $7.313699128345994 2.700832090748%
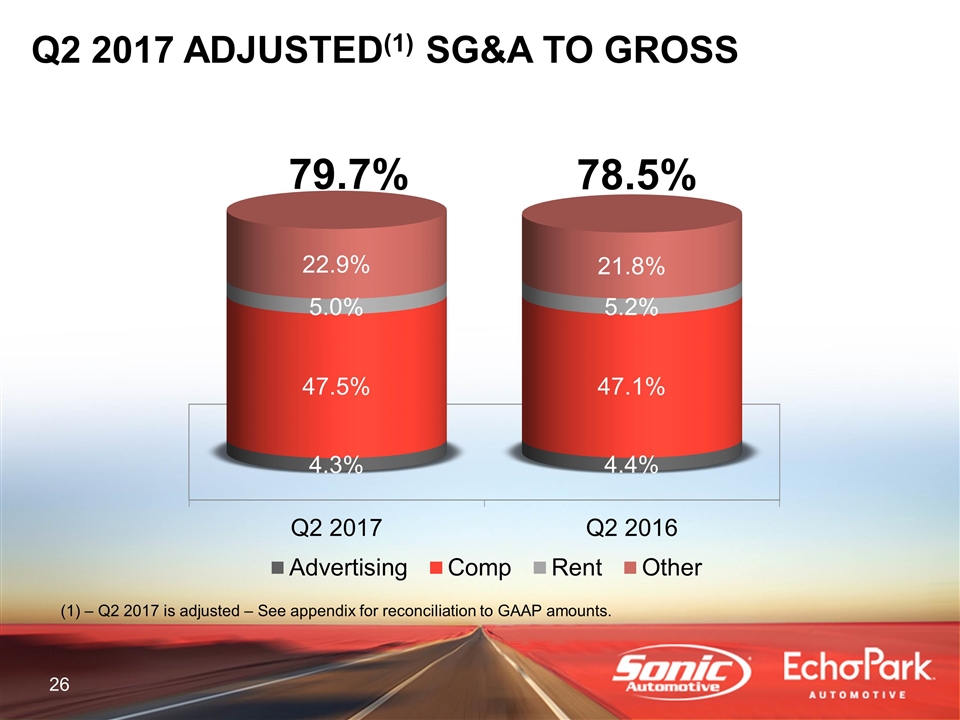
Q2 2017 ADJUSTED(1) SG&A TO GROSS 79.7% 78.5% – Q2 2017 is adjusted – See appendix for reconciliation to GAAP amounts.
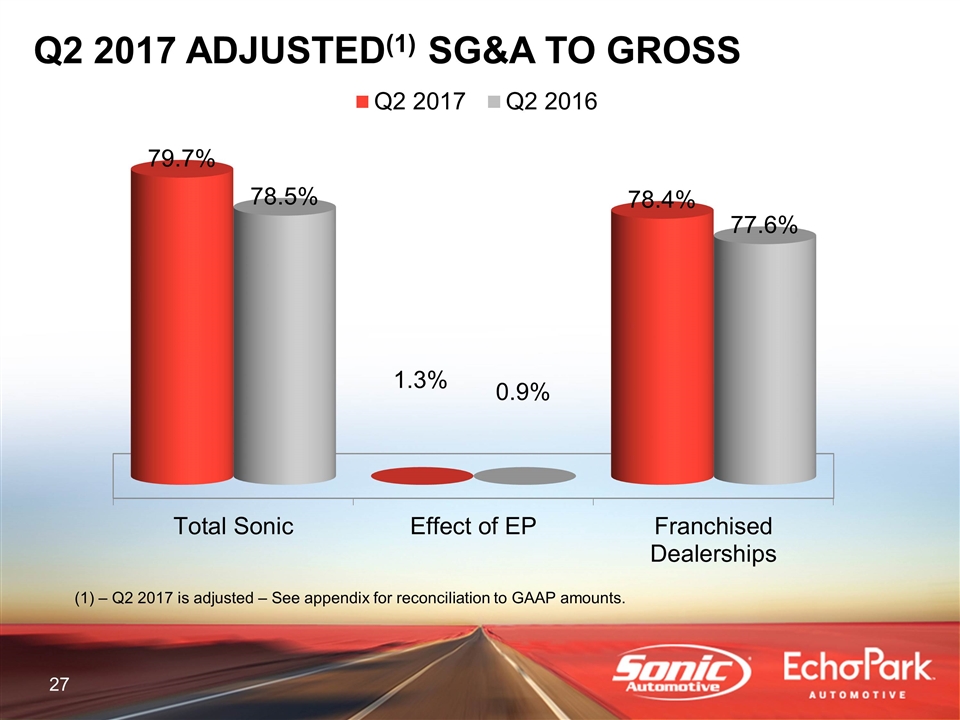
Q2 2017 ADJUSTED(1) SG&A TO GROSS – Q2 2017 is adjusted – See appendix for reconciliation to GAAP amounts.
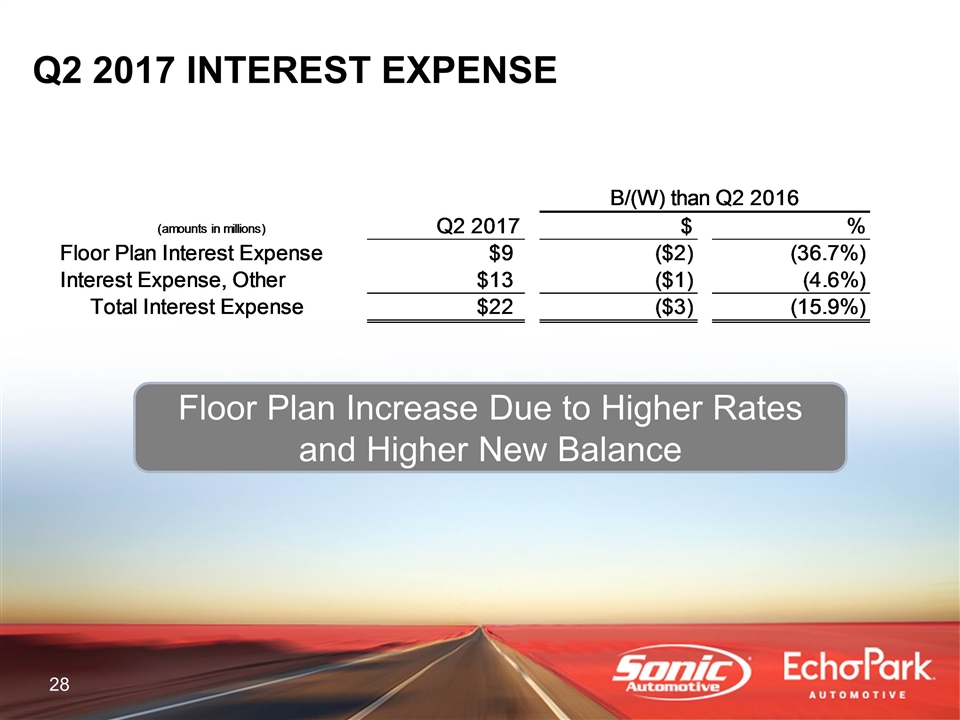
Q2 2017 INTEREST EXPENSE Floor Plan Increase Due to Higher Rates and Higher New Balance B/(W) than Q2 2016 (amounts in millions) Q2 2017 $ % Floor Plan Interest Expense $9.1445464099999914 $-2.4546059599999919 -0.36690998647080508 Interest Expense, Other $12.763516619999999 $-0.55823385999999842 -4.573706901978% Total Interest Expense $21.90806302999999 $-3.0128398199999902 -0.15944981366536554
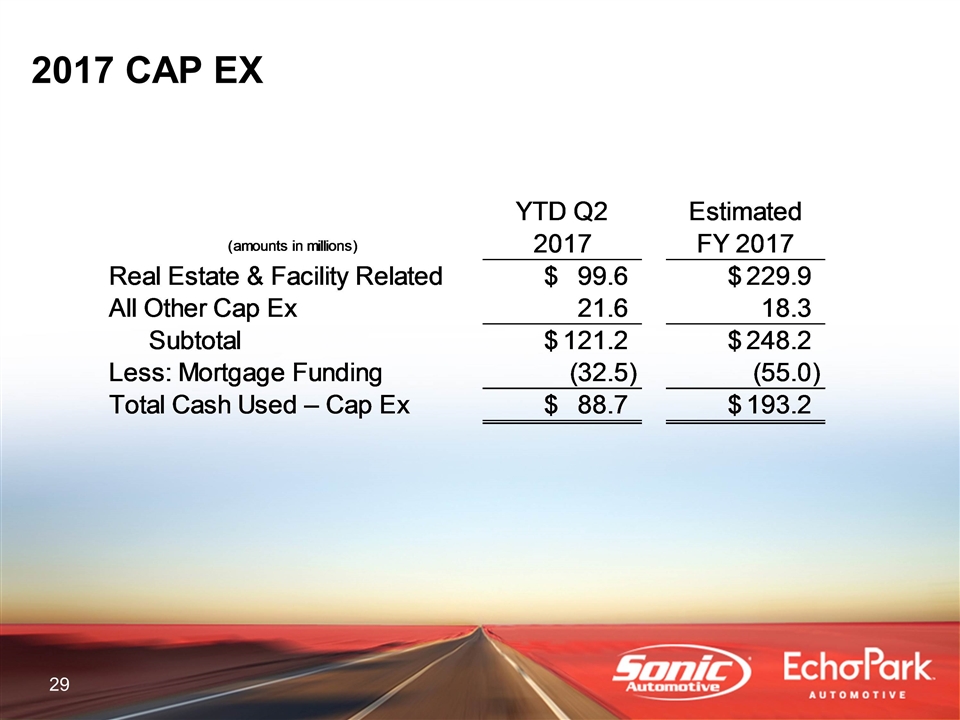
2017 CAP EX (amounts in millions) YTD Q2 2017 Estimated FY 2017 Real Estate & Facility Related $99.6 $229.9 All Other Cap Ex 21.6 18.3 Subtotal $121.19999999999999 $248.20000000000002 Less: Mortgage Funding -32.5 -55 Total Cash Used – Cap Ex $88.699999999999989 $193.20000000000002
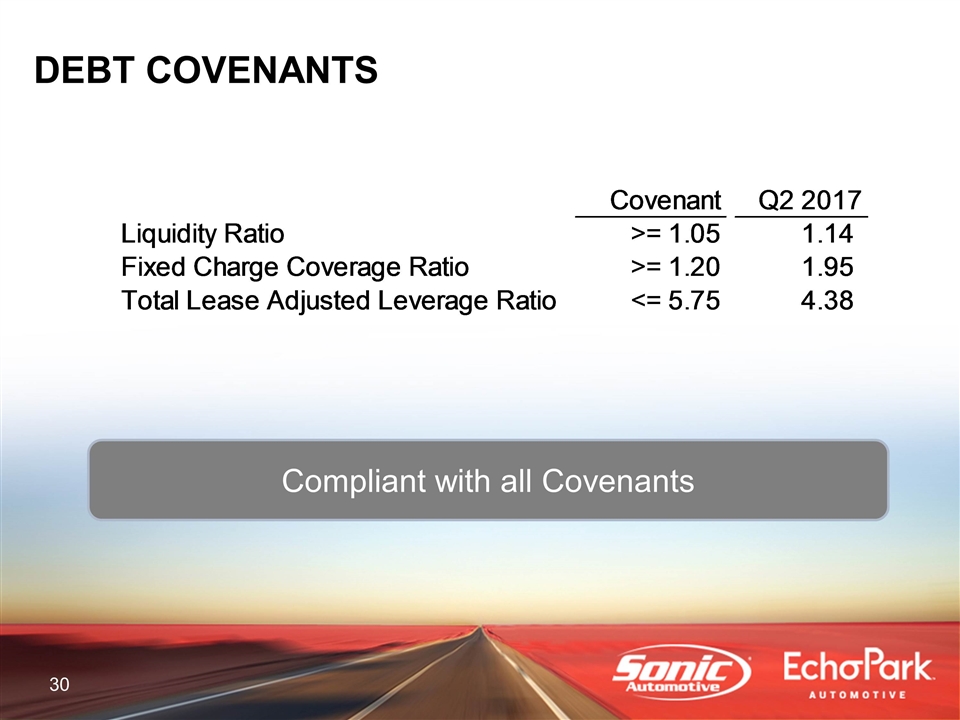
DEBT COVENANTS Compliant with all Covenants Covenant Q2 2017 Liquidity Ratio >= 1.05 1.1399999999999999 Fixed Charge Coverage Ratio >= 1.20 1.95 Total Lease Adjusted Leverage Ratio <= 5.75 4.38
OPERATIONS REVIEW
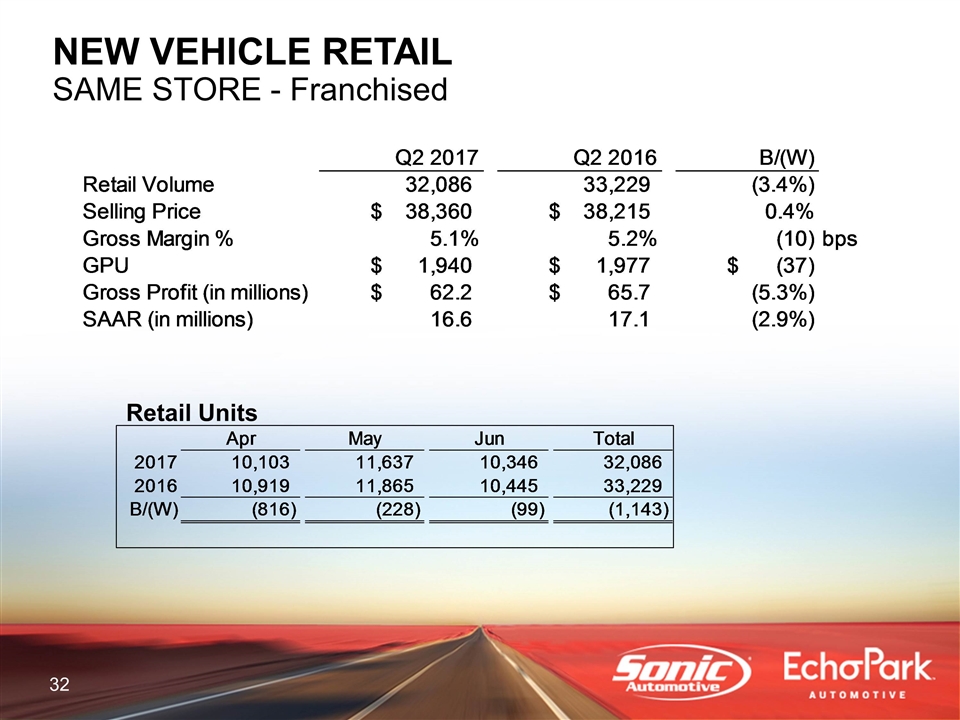
NEW VEHICLE RETAIL SAME STORE - Franchised Retail Units Apr May Jun Total 2017 10,103 11,637 10,346 32,086 2016 10,919 11,865 10,445 33,229 B/(W) -,816 -,228 -99 -1,143 Q2 2017 Q2 2016 B/(W) Retail Volume 32,086 33,229 -3.439766469% Selling Price $38,360.457572461513 $38,214.895322158358 .3809044852% Gross Margin % 5.6% 5.2% -10 bps GPU $1,940.121557688276 $1,977.1925998374616 $-37.18044406863396 Gross Profit (in millions) $62.247230029998605 $65.700132899999005 -5.2555492928% SAAR (in millions) 16.600000000000001 17.100000000000001 -2.9239766082% SAAR - Keyed 16.600000000000001 17.100000000000001 -2.9% -0.5 -2.9239766081871343E-2
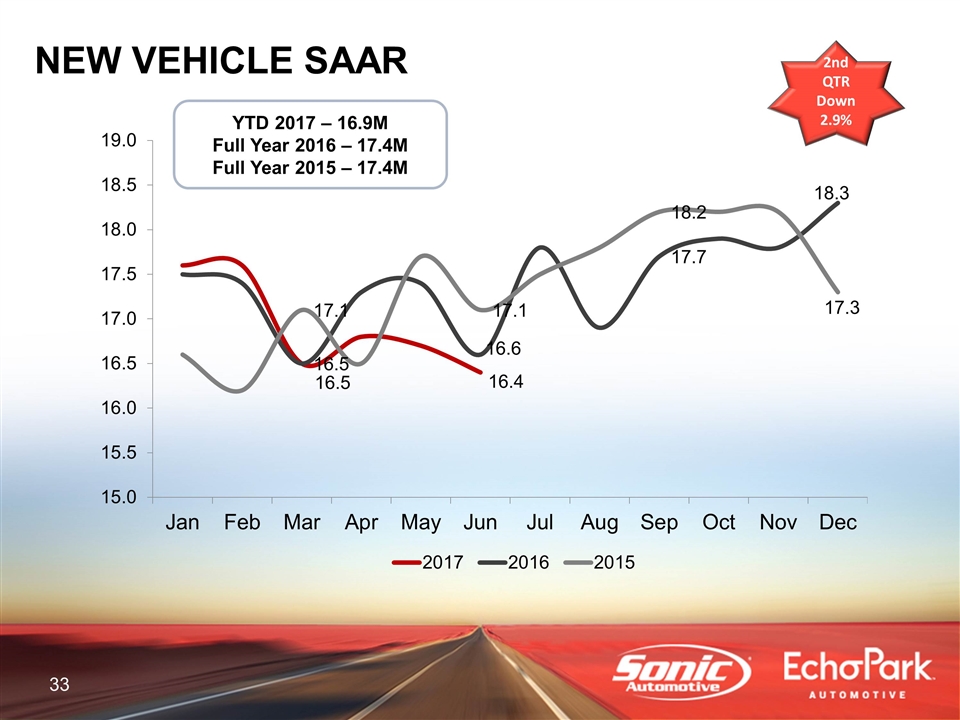
NEW VEHICLE SAAR 2nd QTR Down 2.9% YTD 2017 – 16.9M Full Year 2016 – 17.4M Full Year 2015 – 17.4M
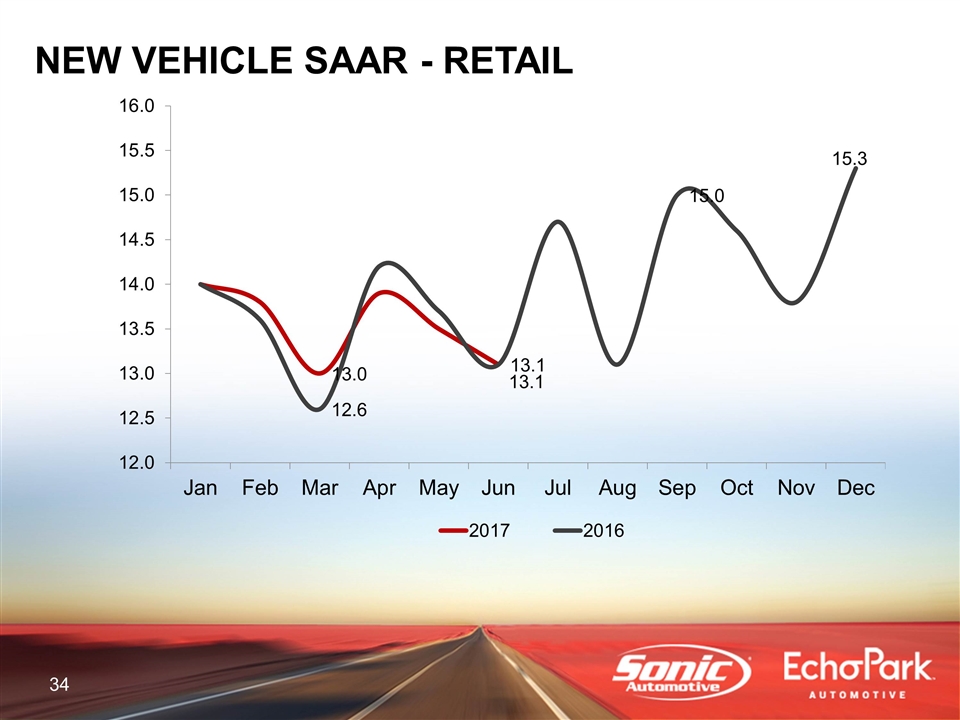
NEW VEHICLE SAAR - RETAIL
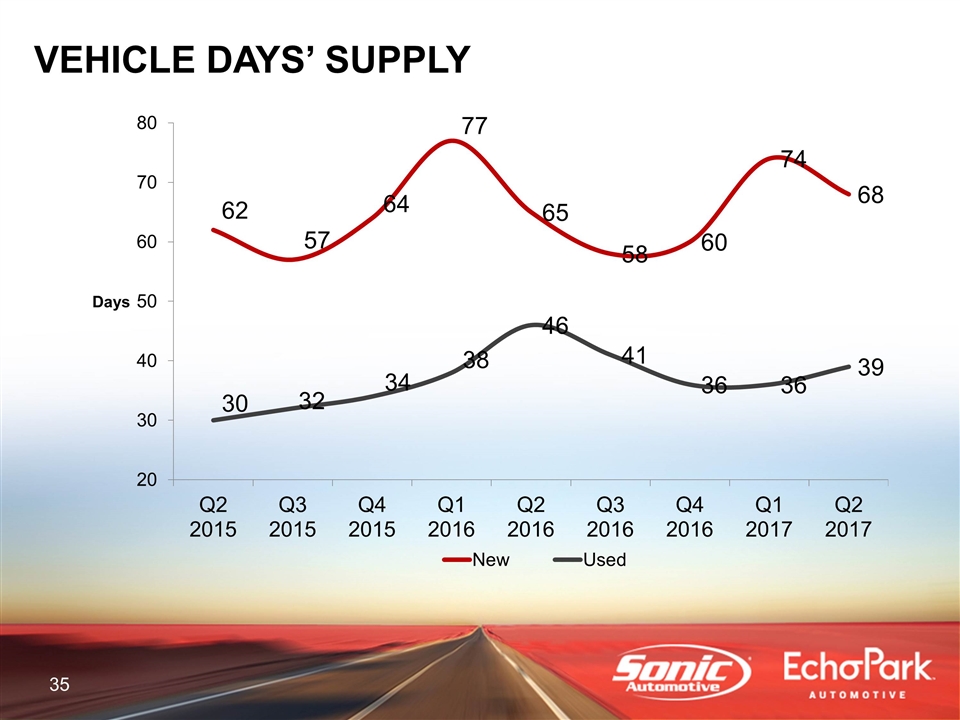
VEHICLE DAYS’ SUPPLY
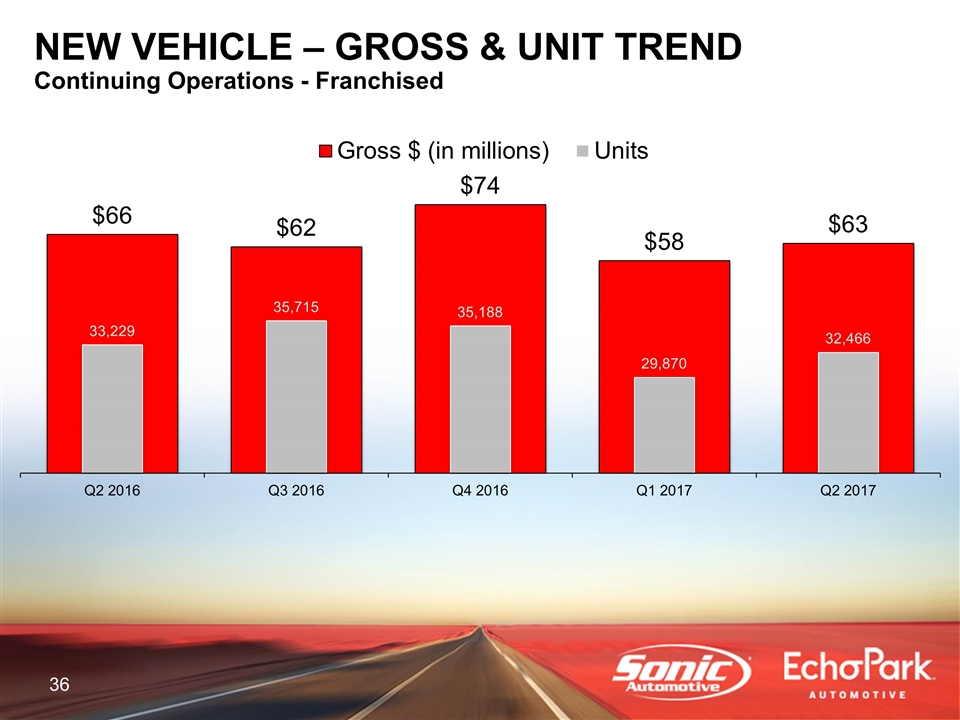
NEW VEHICLE NEW VEHICLE – GROSS & UNIT TREND Continuing Operations - Franchised
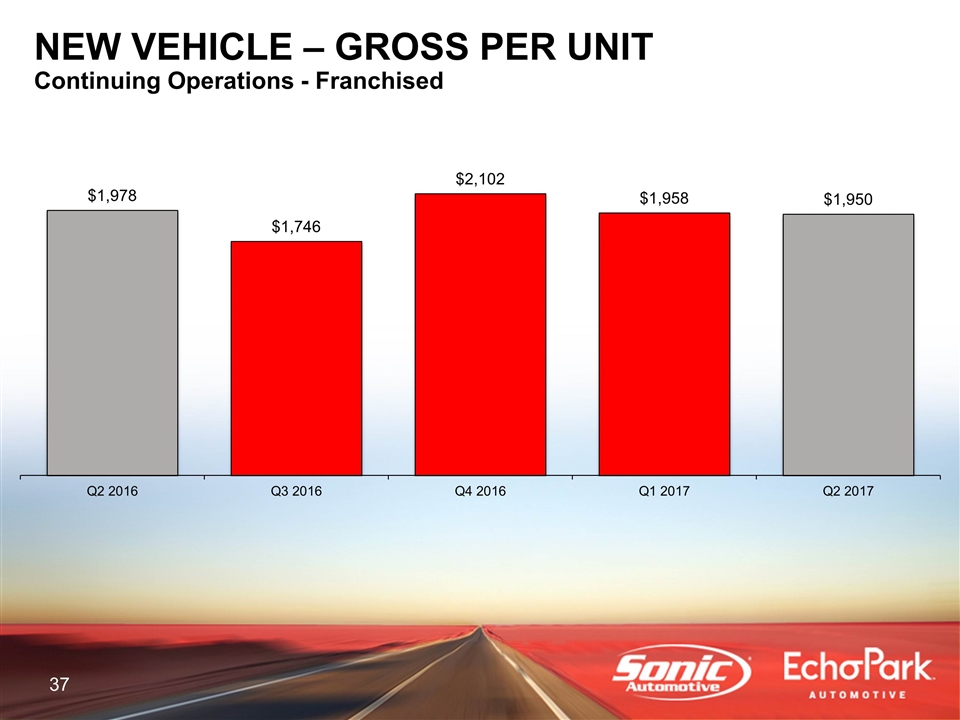
NEW VEHICLE NEW VEHICLE – GROSS PER UNIT Continuing Operations - Franchised
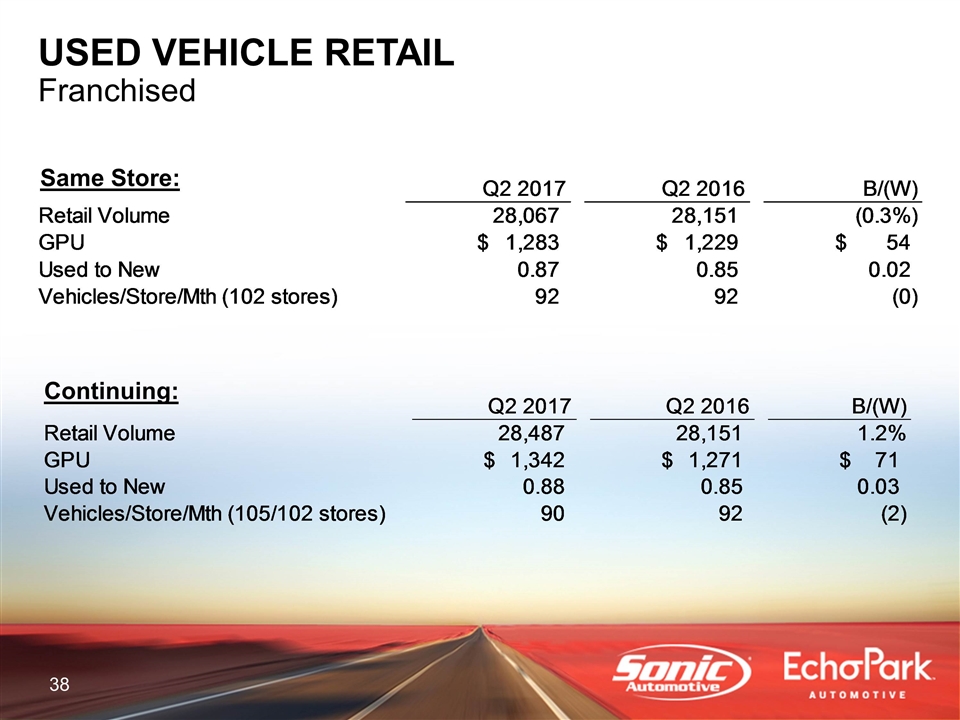
USED VEHICLE RETAIL Franchised Continuing: Same Store: Q2 2017 Q2 2016 B/(W) Retail Volume 28,487 28,151 1.1935632837% GPU $1,342.4427094815073 $1,271.184686748833 $71.258022732674362 Used to New 0.88 0.85 3.0000000000000027E-2 Vehicles/Store/Mth (105/102 stores) 90.43492063492063 91.996732026143789 -1.5618113912231593 Number of Stores 105 102 0.0% Vehicles/Store/Mth 90.43492063492063 91.996732026143789 Q2 2017 Q2 2016 B/(W) Retail Volume 28,067 28,151 -0.2983908209% GPU $1,283.812473723588 $1,228.6009619551669 $54.480285417191908 Used to New 0.87 0.85 2.0000000000000018E-2 Vehicles/Store/Mth (102 stores) 91.722222222222214 91.996732026143789 -0.27450980392157476 Number of Stores 102 102 0.0% Vehicles/Store/Mth 91.722222222222214 91.996732026143789
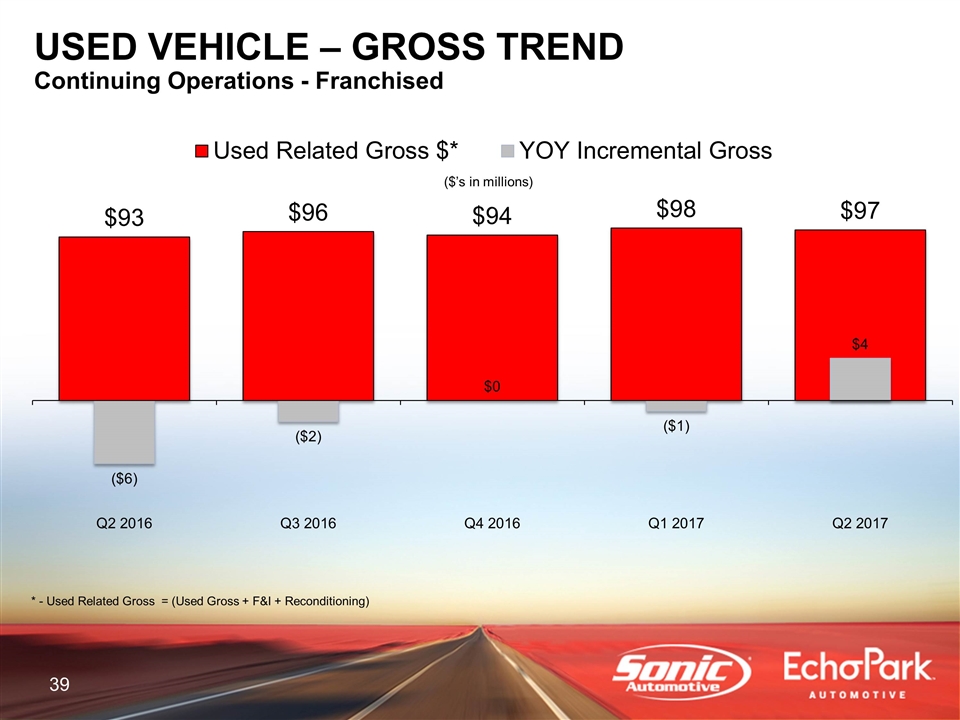
* - Used Related Gross = (Used Gross + F&I + Reconditioning) ($’s in millions) USED VEHICLE – GROSS TREND Continuing Operations - Franchised
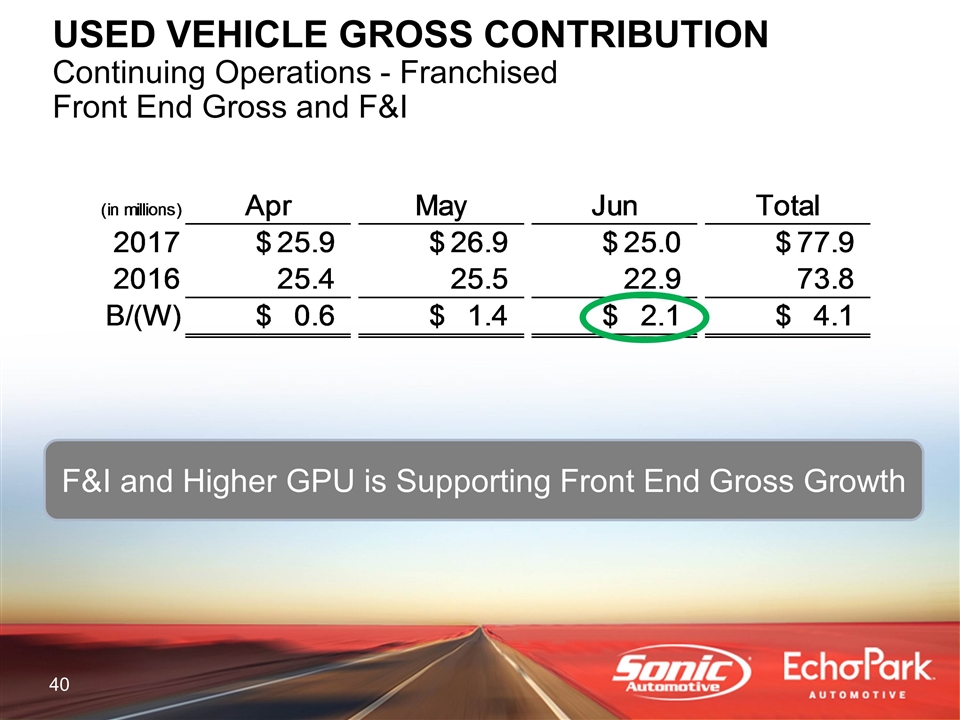
USED VEHICLE GROSS CONTRIBUTION Continuing Operations - Franchised Front End Gross and F&I F&I and Higher GPU is Supporting Front End Gross Growth (in millions) Apr May Jun Total 2017 $25.939812007872501 $26.905302557153838 $25.011024994288018 $77.856139559314357 2016 25.350713645404781 25.513975578019469 22.888169655372099 73.752858878796346 B/(W) $0.58909836246771974 $1.3913269791343694 $2.1228553389159188 $4.103280680518008
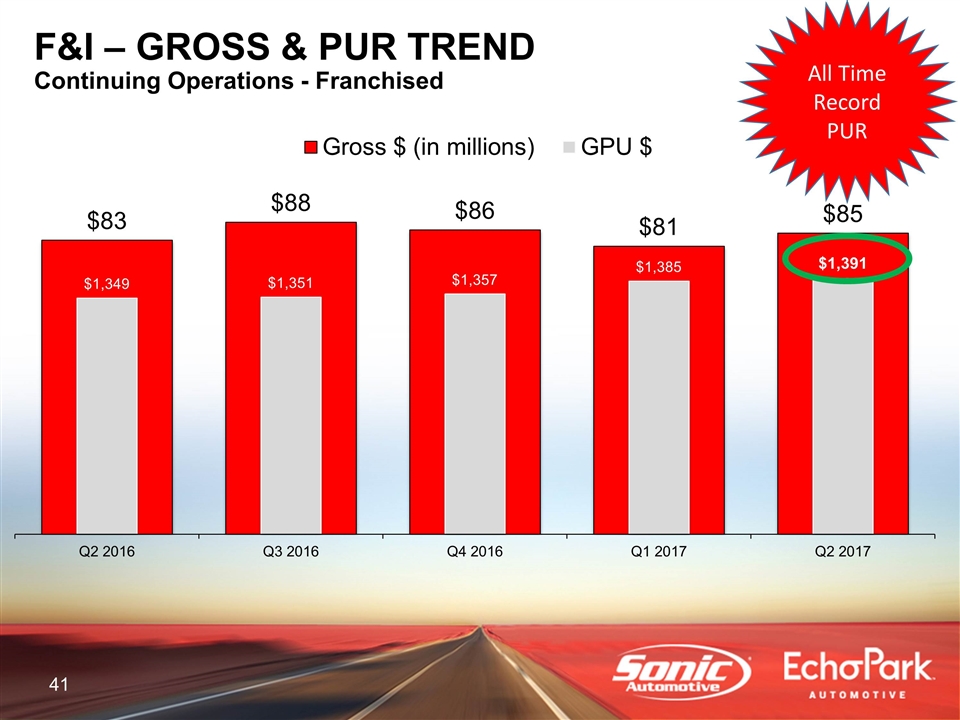
F&I F&I – GROSS & PUR TREND Continuing Operations - Franchised All Time Record PUR
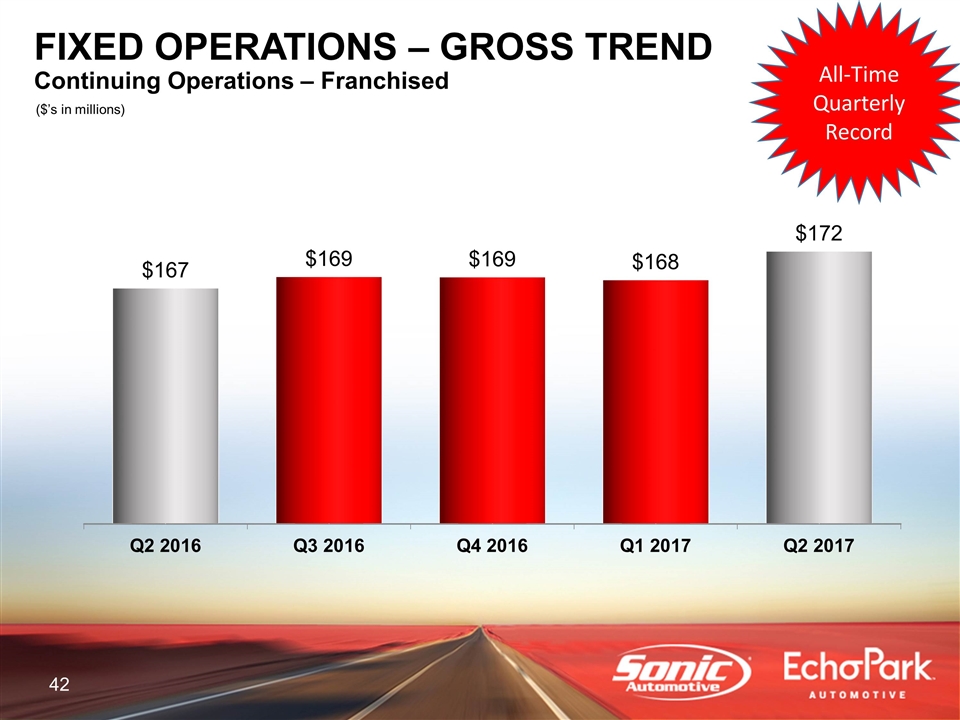
FIXED OPERATIONS ($’s in millions) FIXED OPERATIONS – GROSS TREND Continuing Operations – Franchised All-Time Quarterly Record
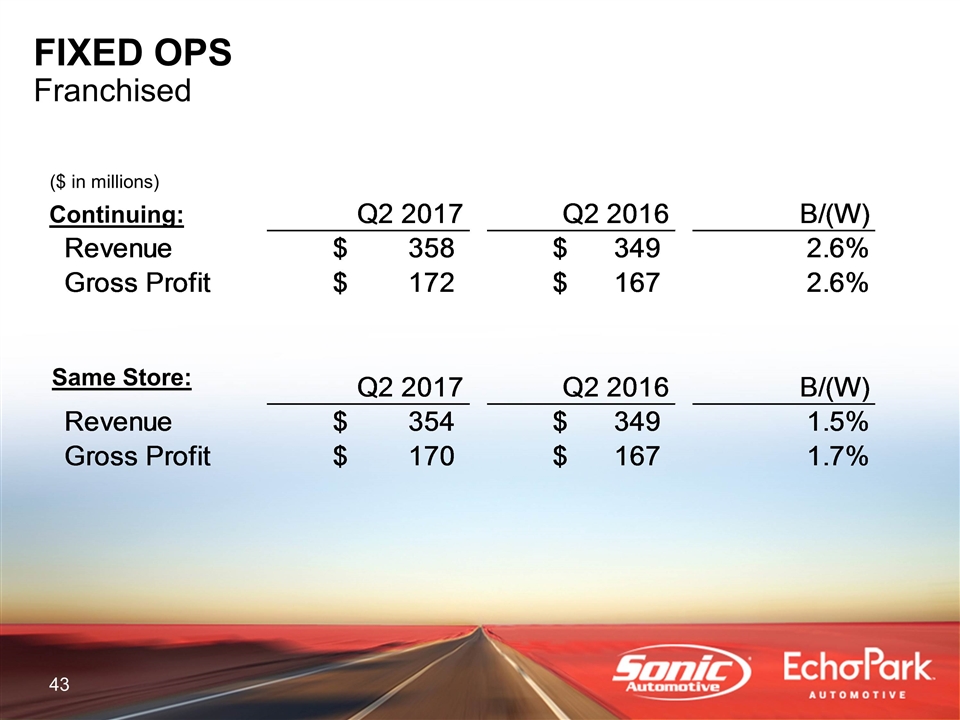
FIXED OPS Franchised Continuing: Same Store: ($ in millions) Q2 2017 Q2 2016 B/(W) Revenue $358.15790809999902 $349.081373339999 2.6001200445% Gross Profit $171.59596108 $167.32566605 2.5520860791% Q2 2017 Q2 2016 B/(W) Revenue $354.39144368999899 $349.081373339999 1.5211554542% Gross Profit $170.07747974 $167.24857963999997 1.6914344541%
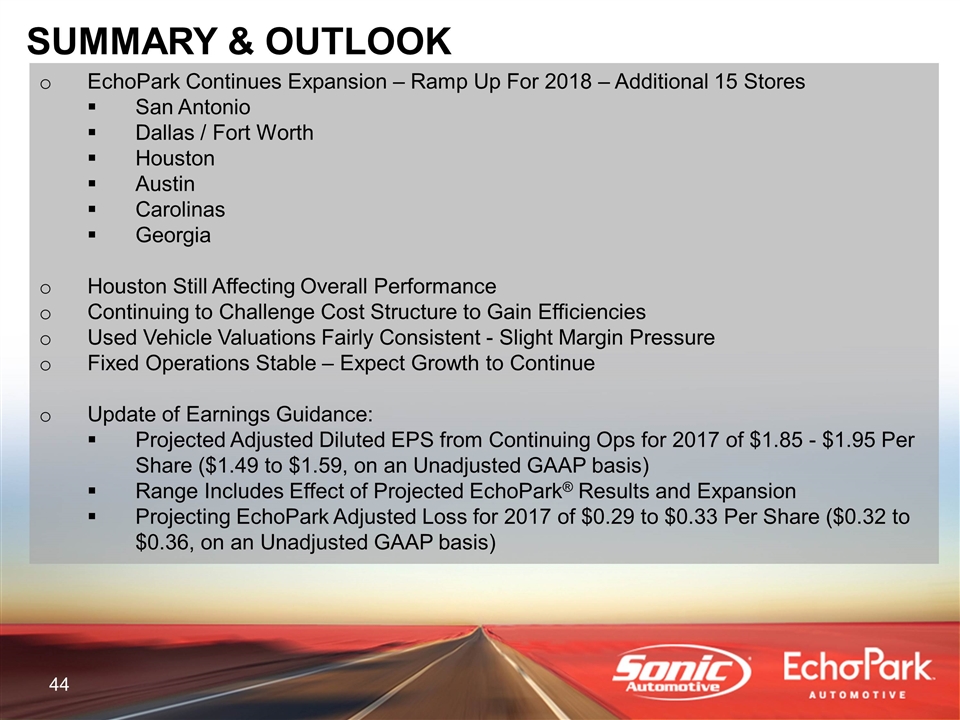
SUMMARY & OUTLOOK EchoPark Continues Expansion – Ramp Up For 2018 – Additional 15 Stores San Antonio Dallas / Fort Worth Houston Austin Carolinas Georgia Houston Still Affecting Overall Performance Continuing to Challenge Cost Structure to Gain Efficiencies Used Vehicle Valuations Fairly Consistent - Slight Margin Pressure Fixed Operations Stable – Expect Growth to Continue Update of Earnings Guidance: Projected Adjusted Diluted EPS from Continuing Ops for 2017 of $1.85 - $1.95 Per Share ($1.49 to $1.59, on an Unadjusted GAAP basis) Range Includes Effect of Projected EchoPark® Results and Expansion Projecting EchoPark Adjusted Loss for 2017 of $0.29 to $0.33 Per Share ($0.32 to $0.36, on an Unadjusted GAAP basis)
APPENDIX
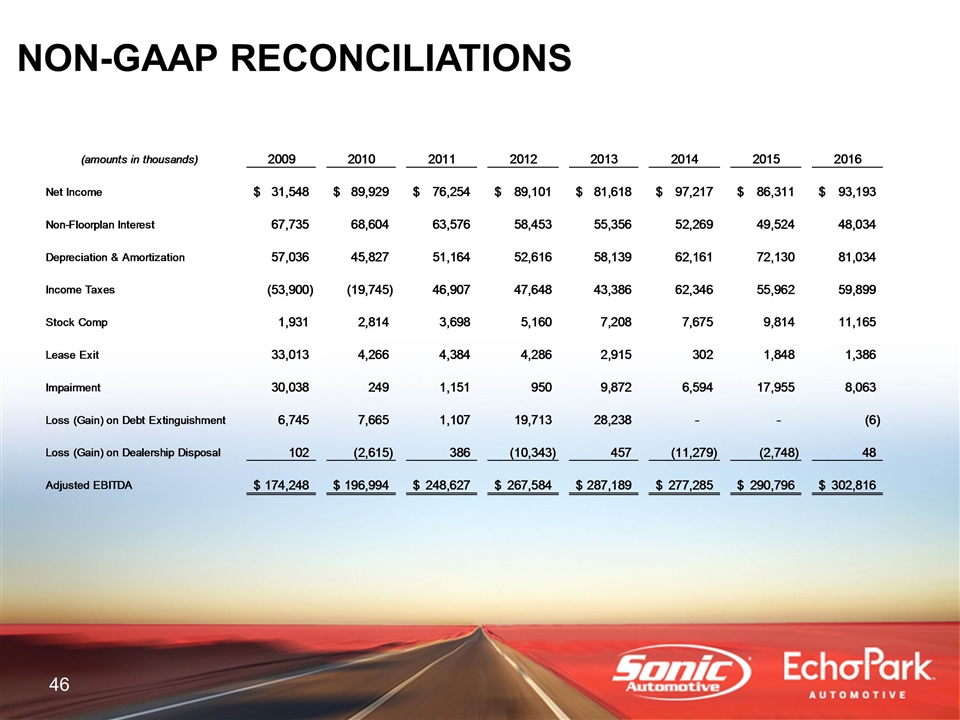
NON-GAAP RECONCILIATIONS (amounts in thousands) 2009 2010 2011 2012 2013 2014 2015 2016 Net Income $31,548 $89,929 $76,254 $89,101 $81,618 $97,217 $86,311 $93,193 Non-Floorplan Interest 67,735 68,604 63,576 58,453 55,356 52,269 49,524 48,034 Depreciation & Amortization 57,036 45,827 51,164 52,616 58,139 62,161 72,130 81,034 Income Taxes ,-53,900 ,-19,745 46,907 47,648 43,386 62,346 55,962 59,899 Stock Comp 1,931 2,814 3,698 5,160 7,208 7,675 9,814 11,165 Lease Exit 33,013 4,266 4,384 4,286 2,915 302 1,848 1,386 Impairment 30,038 249 1,151 950 9,872 6,594 17,955 8,063 Loss (Gain) on Debt Extinguishment 6,745 7,665 1,107 19,713 28,238 0 0 -6 Loss (Gain) on Dealership Disposal 102 -2,615 386 ,-10,343 457 ,-11,279 -2,748 48 Adjusted EBITDA $,174,248 $,196,994 $,248,627 $,267,584 $,287,189 $,277,285 $,290,796 $,302,816
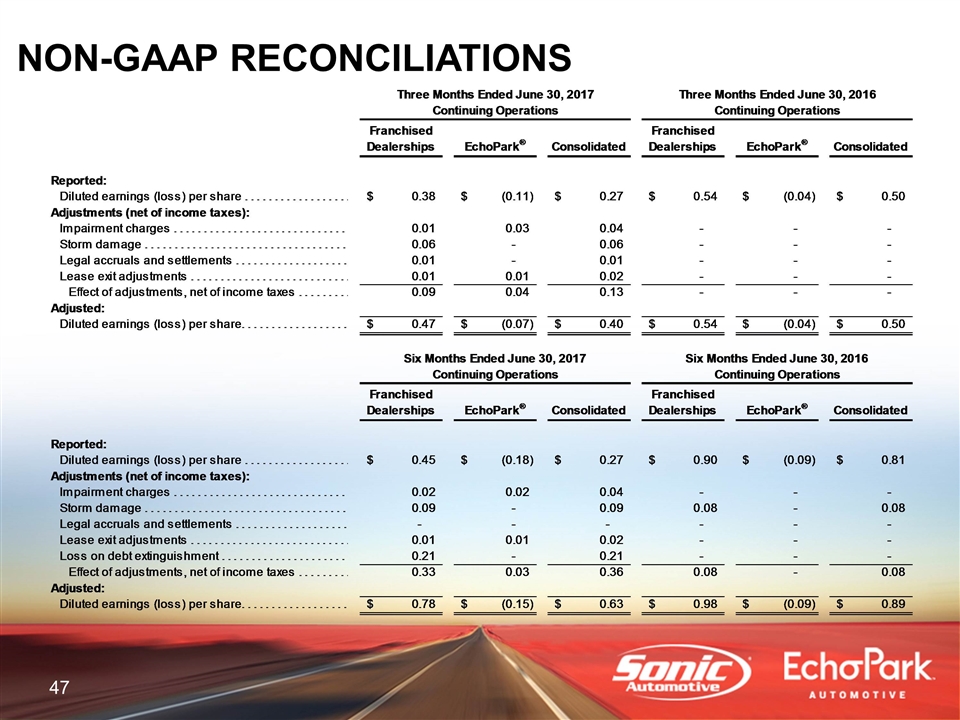
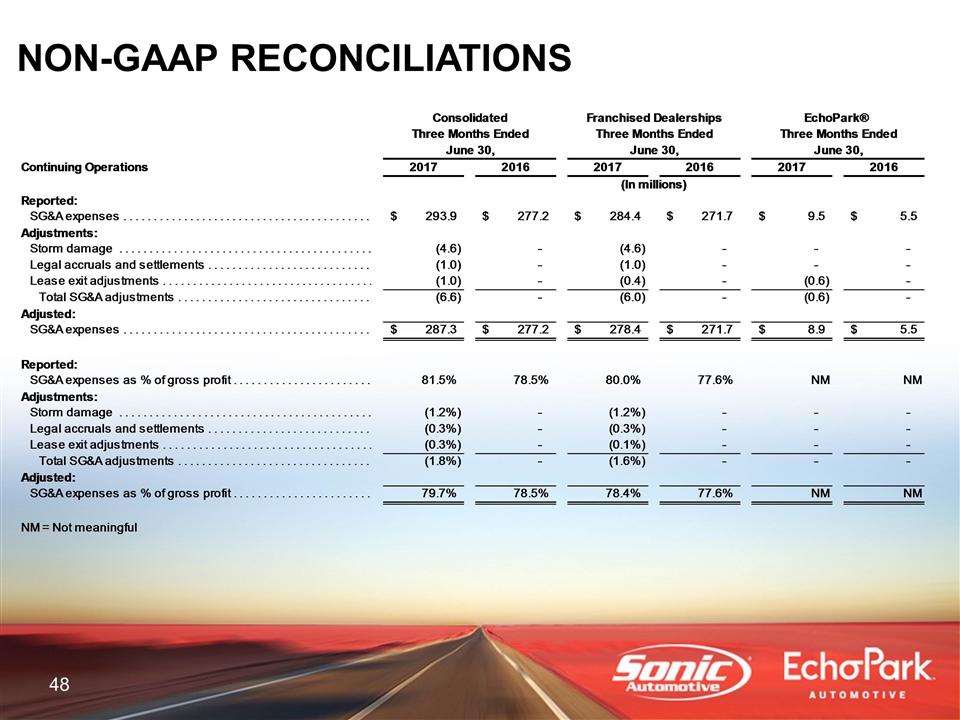
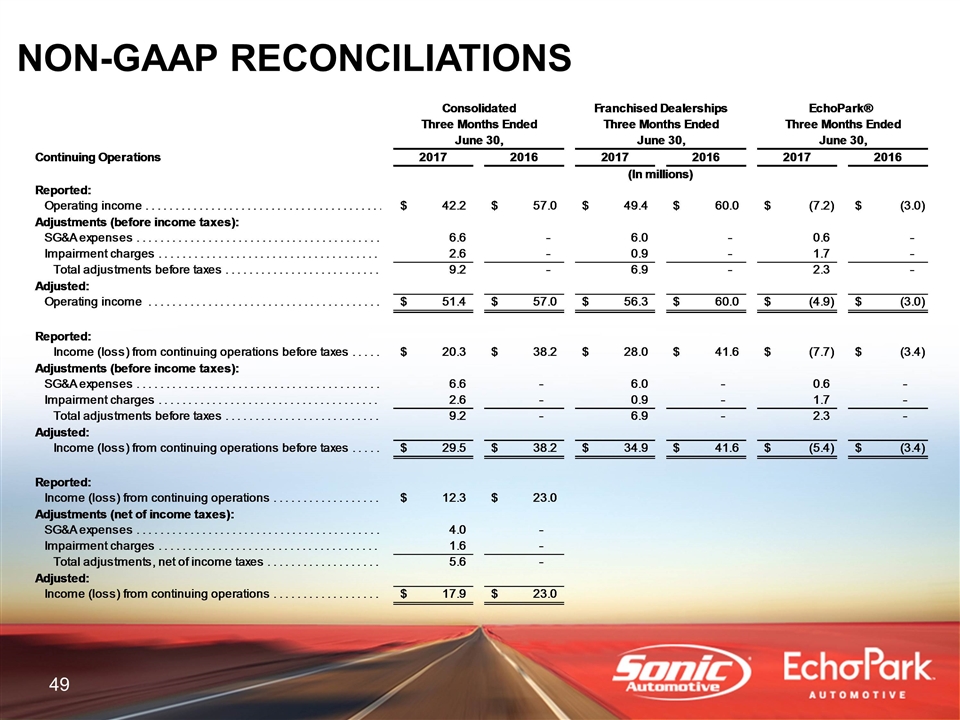
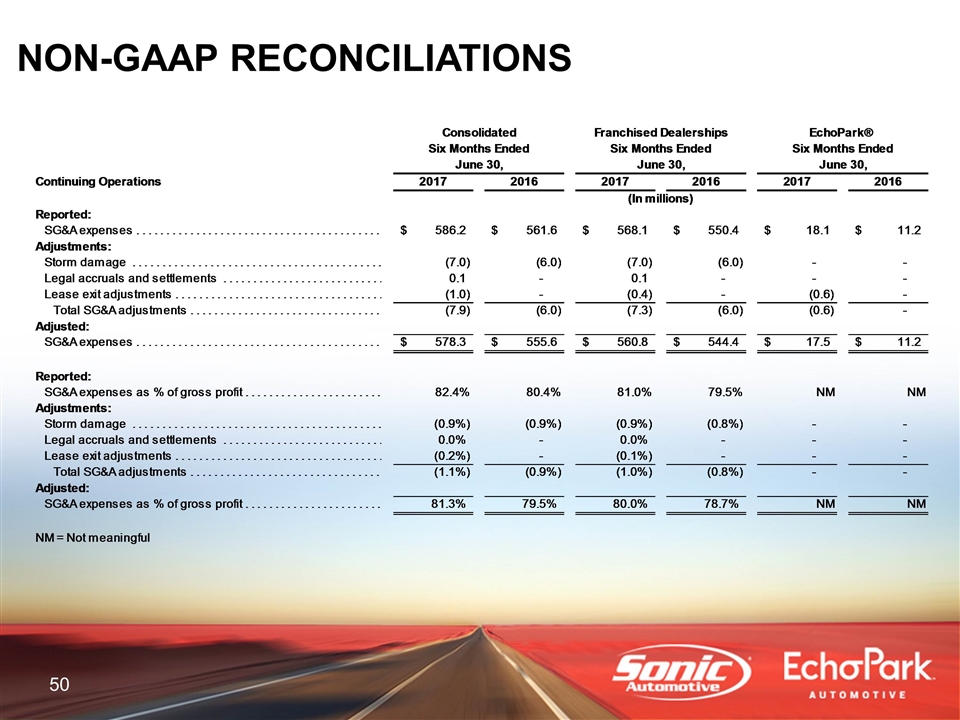
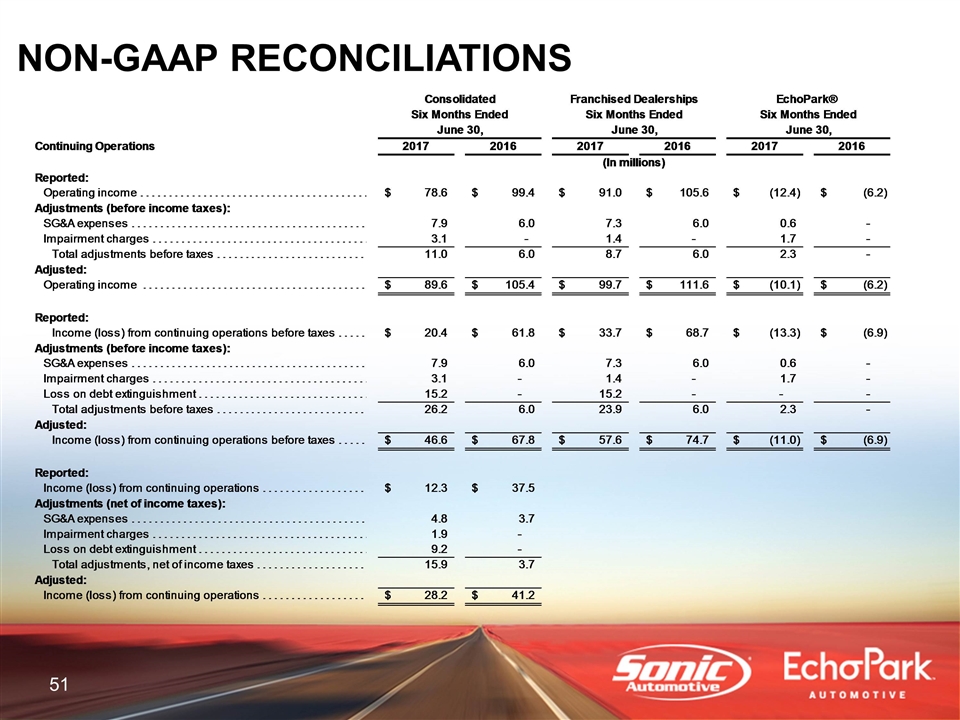
NON-GAAP RECONCILIATIONS
NON-GAAP RECONCILIATIONS
NON-GAAP RECONCILIATIONS
NON-GAAP RECONCILIATIONS
NON-GAAP RECONCILIATIONS
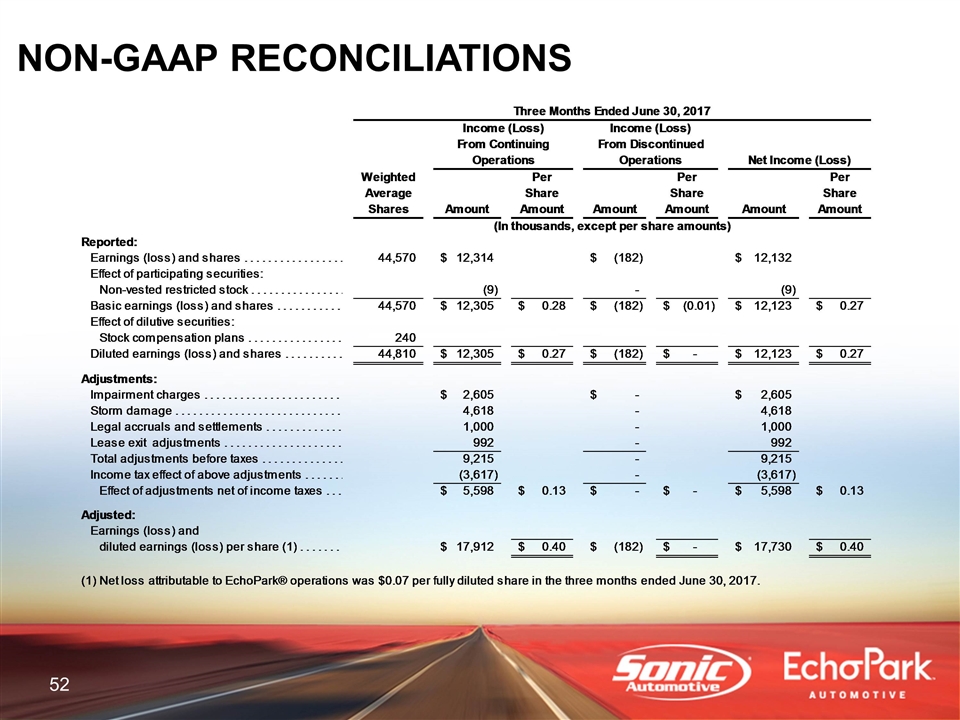
NON-GAAP RECONCILIATIONS
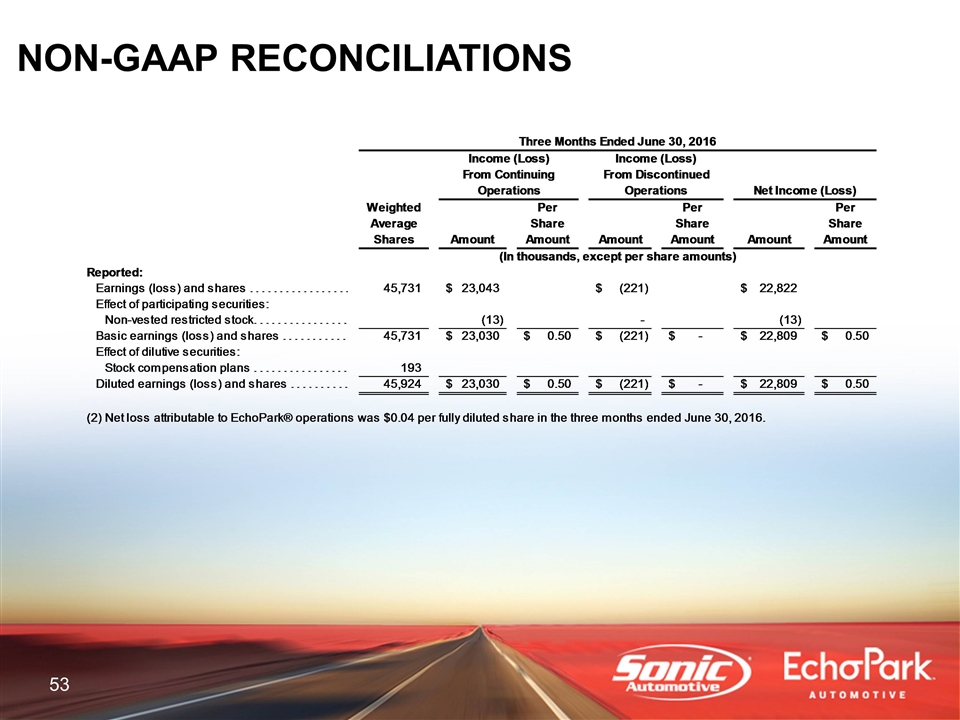
NON-GAAP RECONCILIATIONS
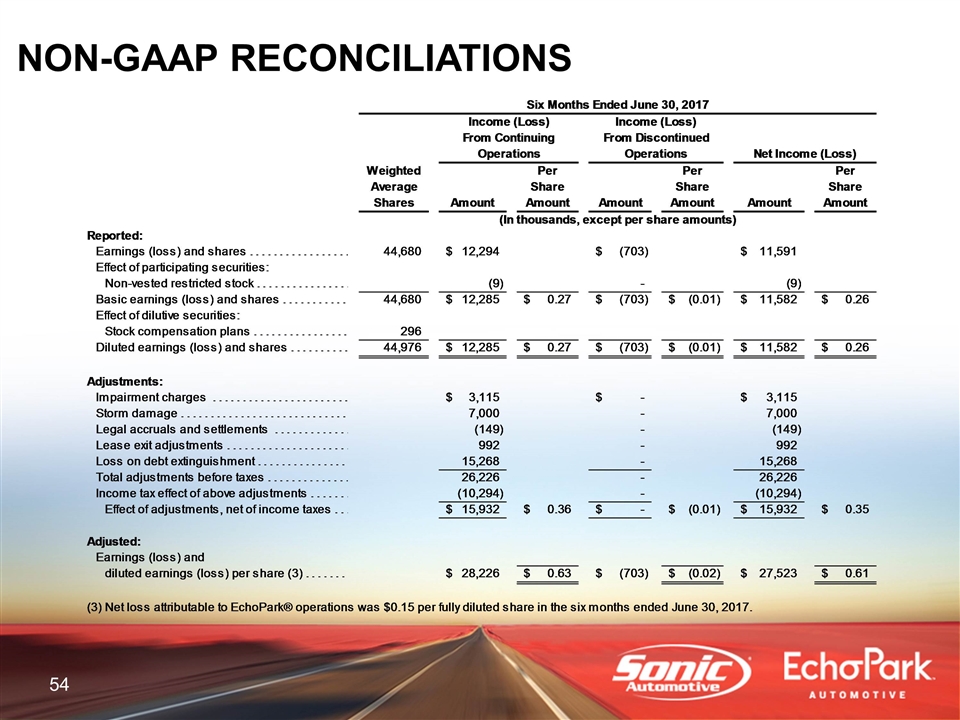
NON-GAAP RECONCILIATIONS
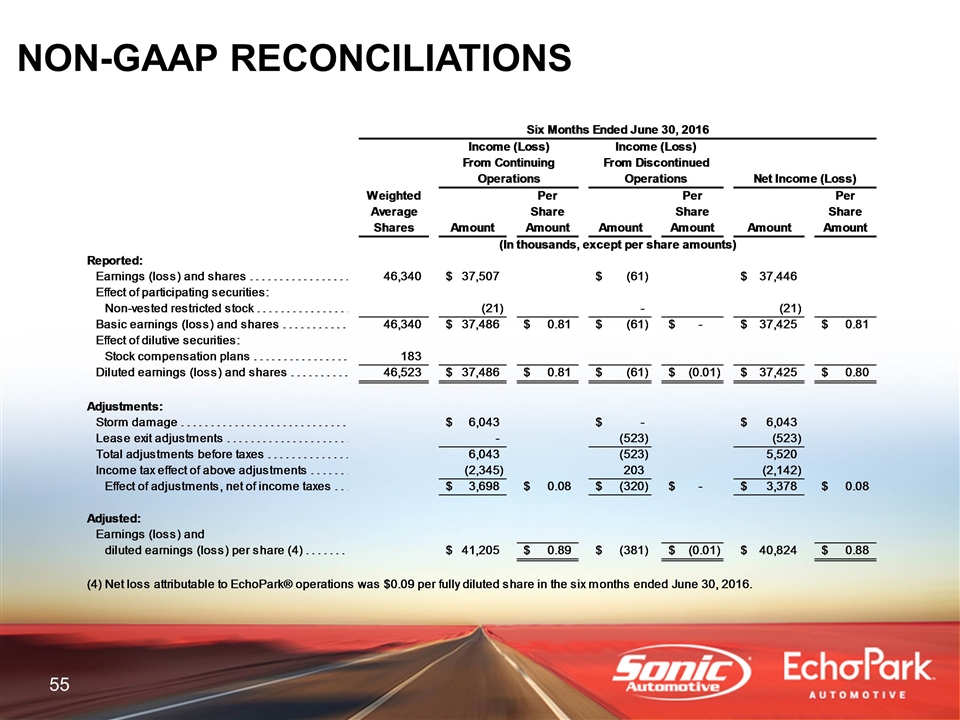
NON-GAAP RECONCILIATIONS
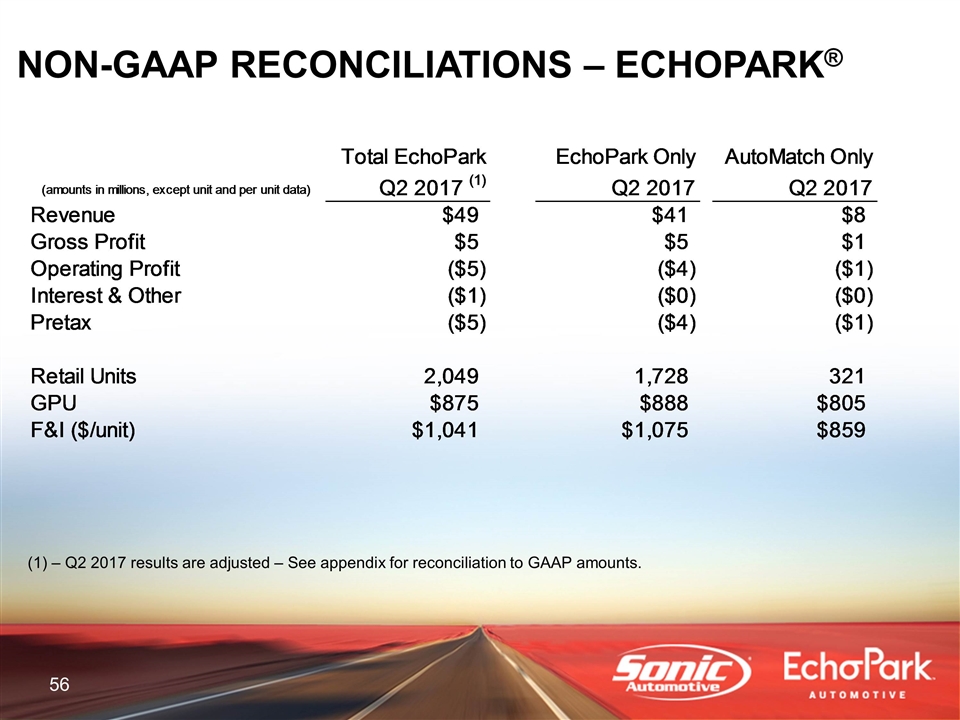
NON-GAAP RECONCILIATIONS – ECHOPARK® – Q2 2017 results are adjusted – See appendix for reconciliation to GAAP amounts. Total EchoPark EchoPark Only AutoMatch Only (amounts in millions, except unit and per unit data) Q2 2017 (1) Q2 2017 Q2 2017 Revenue $49.054388700000004 $41.239478210000001 $7.8149104899999999 Gross Profit $5.3279714299999901 $4.6759631699999931 $0.65200825999999801 Operating Profit $-4.86275681000002 $-3.5494931000000198 $-1.31326371 Interest & Other $-0.53789202000000003 $-0.45233101999999997 $-8.5561000000000012E-2 Pretax $-5.4006488300000193 $-4.0018241200000197 $-1.39882471 Retail Units 2,049 1,728 321 GPU $874.96403123474374 $887.94326388888317 $805.0945171339564 F&I ($/unit) $1,040.9519131283555 $1,074.7718171296297 $858.89336448598135 Diluted EPS Keyed CY -7.0000000000000007E-2 PY -0.05 Change -2.0000000000000004E-2 % Change 0.40000000000000008