
Q3 2017 Investor Presentation Exhibit 99.2
FORWARD-LOOKING STATEMENTS This presentation contains “forward-looking statements” within the meaning of the Private Securities Litigation Reform Act of 1995. These statements relate to future events, are not historical facts and are based on our current expectations and assumptions regarding our business, the economy and other future conditions. These statements can generally be identified by lead-in words such as “believe”, “expect”, “anticipate”, “intend”, “plan”, “foresee”, “may”, “will” and other similar words. Statements that describe our Company’s objectives, plans or goals are also forward-looking statements. Examples of such forward-looking information we may be discussing in this presentation include, without limitation, earnings expectations, anticipated 2017 industry new vehicle sales volume, the implementation of growth and operating strategies, including acquisitions of dealerships and properties, the development of open points and stand-alone pre-owned stores, the return of capital to stockholders, anticipated future success and impacts from the implementation of our strategic initiatives and earnings per share expectations. You are cautioned that these forward-looking statements are not guarantees of future performance, involve risks and uncertainties and actual results may differ materially from those projected in the forward-looking statements as a result of various factors. These risks and uncertainties include, without limitation, economic conditions in the markets in which we operate, new and used vehicle industry sales volume, the success of our operational strategies, the rate and timing of overall economic recovery or decline, and the risk factors described in the Company’s Annual Report on Form 10-K for the year ended December 31, 2016. These forward-looking statements, risks, uncertainties and additional factors speak only as of the date of this presentation. We undertake no obligation to update any such statements, except as required under federal securities laws and the rules and regulations of the Securities and Exchange Commission. 2
CONTENT COMPANY OVERVIEW STRATEGIC FOCUS FINANCIAL REVIEW OPERATIONS REVIEW SUMMARY & OUTLOOK

COMPANY OVERVIEW
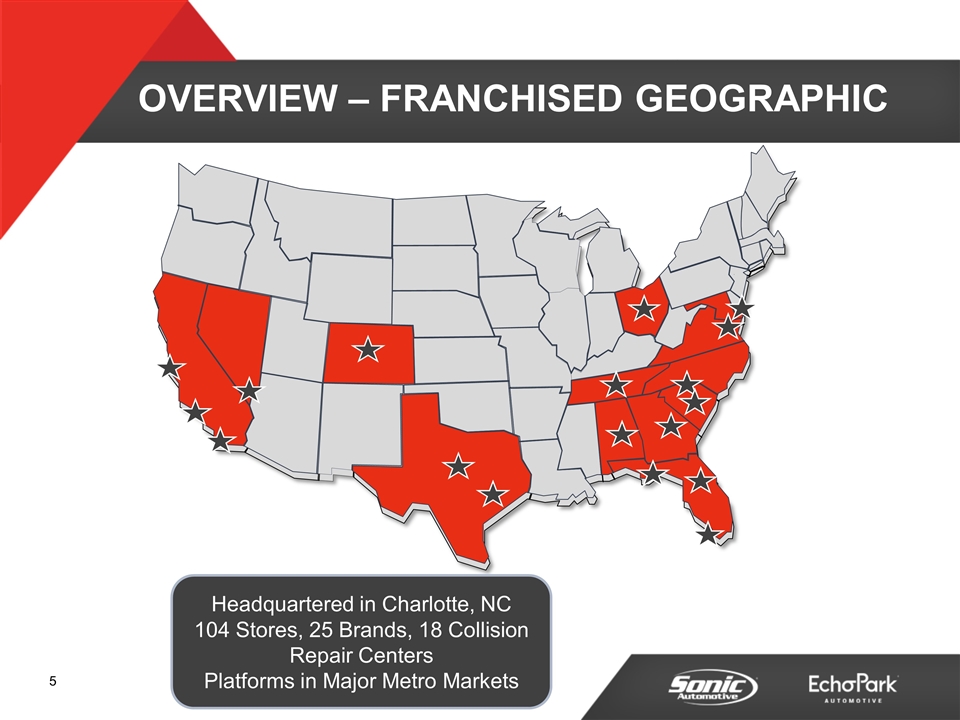
OVERVIEW – FRANCHISED GEOGRAPHIC Headquartered in Charlotte, NC 104 Stores, 25 Brands, 18 Collision Repair Centers Platforms in Major Metro Markets
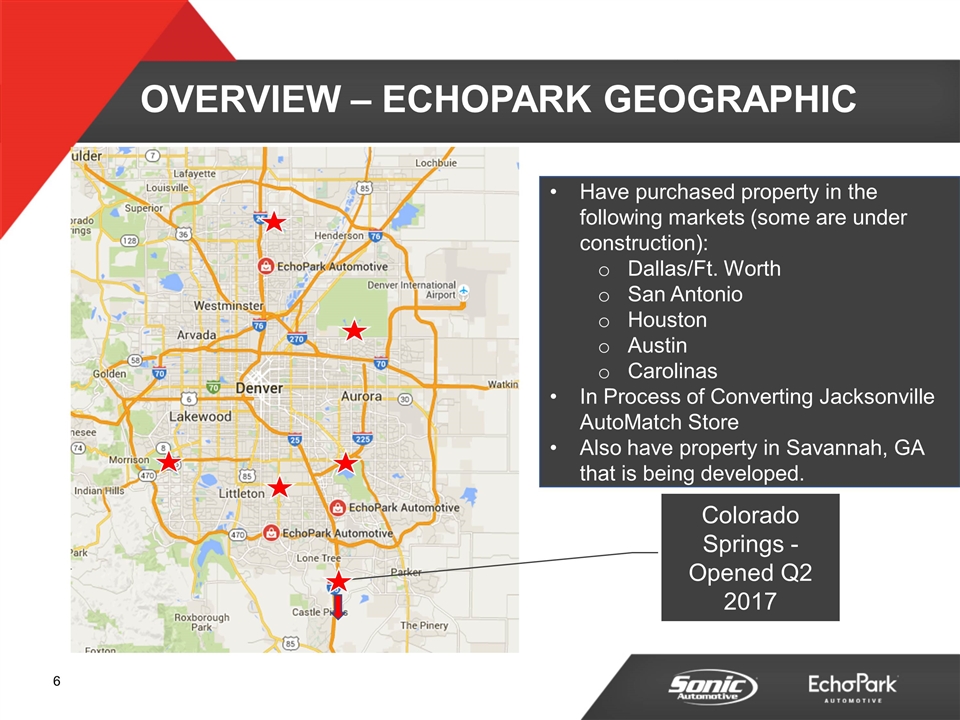
OVERVIEW – ECHOPARK GEOGRAPHIC Colorado Springs - Opened Q2 2017 Have purchased property in the following markets (some are under construction): Dallas/Ft. Worth San Antonio Houston Austin Carolinas In Process of Converting Jacksonville AutoMatch Store Also have property in Savannah, GA that is being developed.
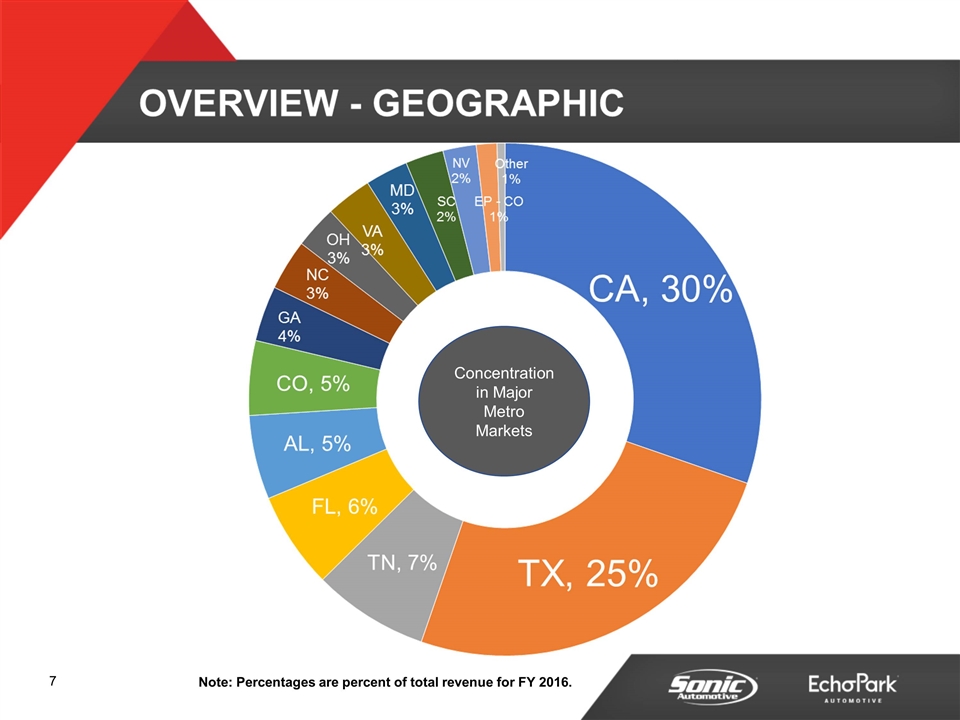
Note: Percentages are percent of total revenue for FY 2016. Concentration in Major Metro Markets
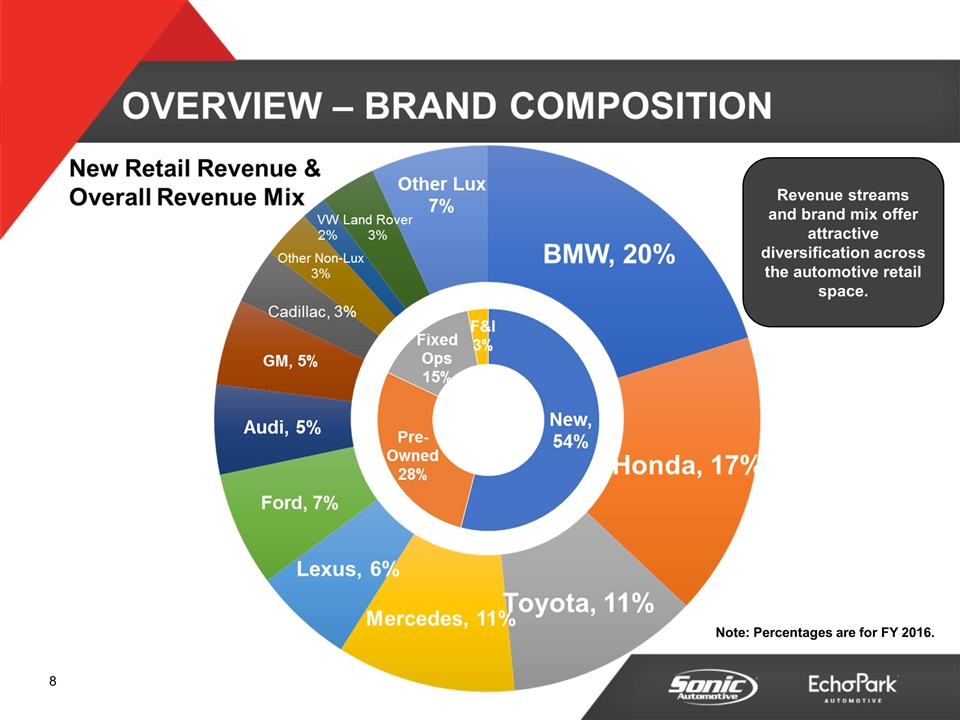
Revenue streams and brand mix offer attractive diversification across the automotive retail space. Note: Percentages are for FY 2016.

STRATEGIC FOCUS
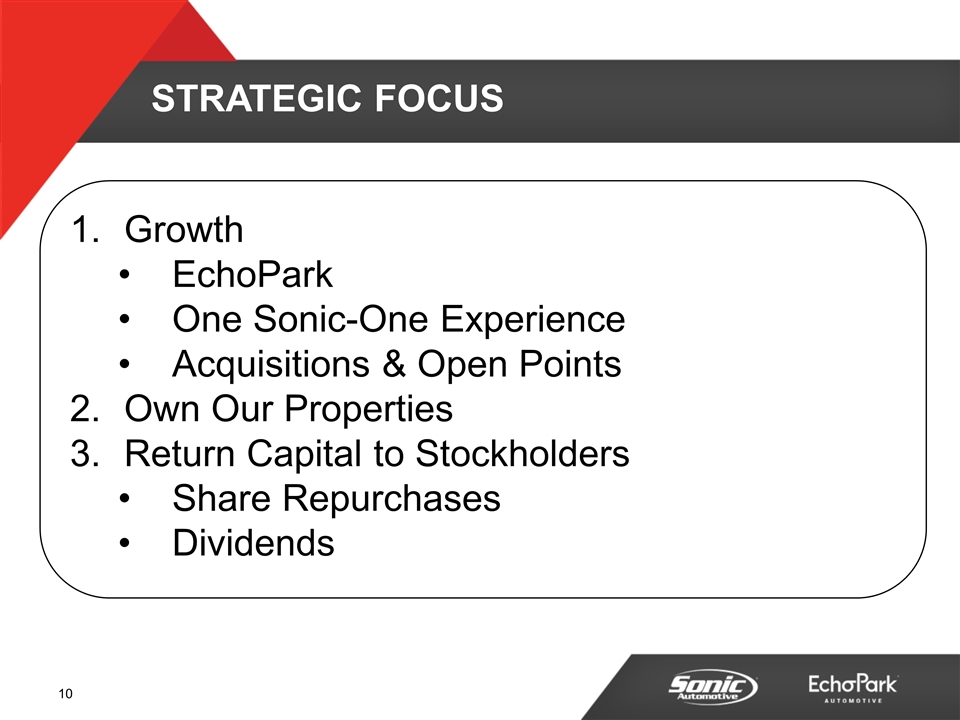
STRATEGIC FOCUS Growth EchoPark One Sonic-One Experience Acquisitions & Open Points Own Our Properties Return Capital to Stockholders Share Repurchases Dividends
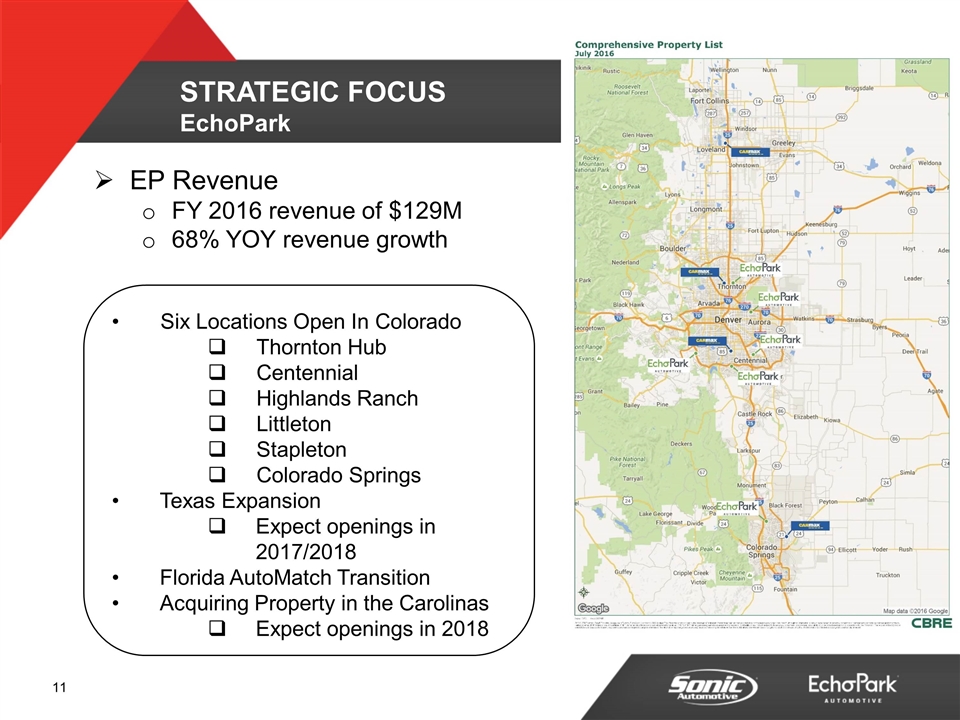
STRATEGIC FOCUS EchoPark Six Locations Open In Colorado Thornton Hub Centennial Highlands Ranch Littleton Stapleton Colorado Springs Texas Expansion Expect openings in 2017/2018 Florida AutoMatch Transition Acquiring Property in the Carolinas Expect openings in 2018 EP Revenue FY 2016 revenue of $129M 68% YOY revenue growth
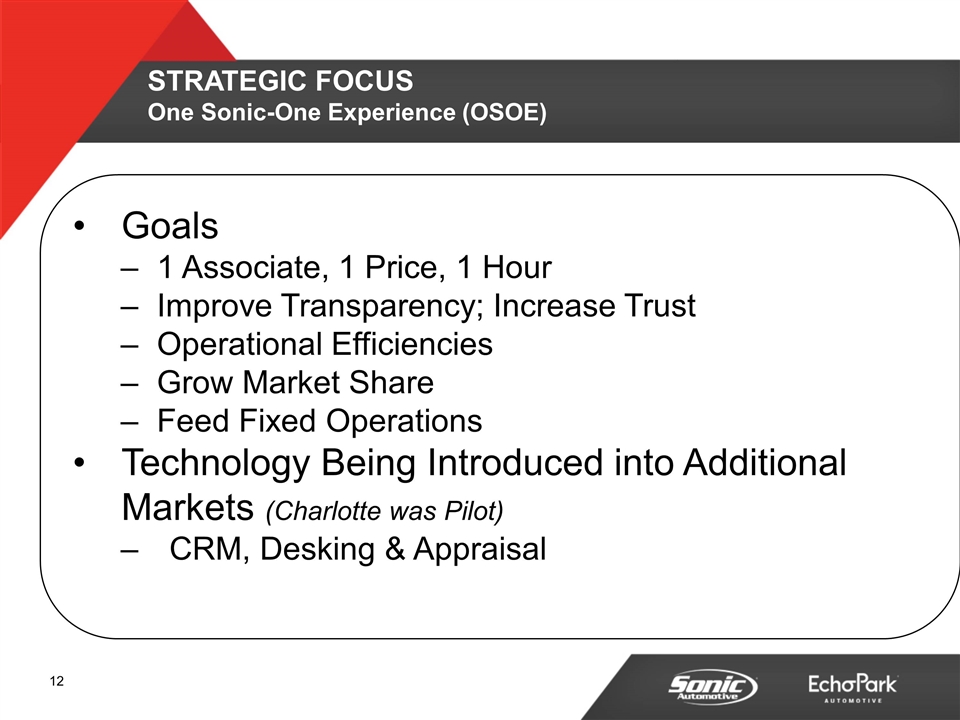
STRATEGIC FOCUS One Sonic-One Experience (OSOE) Goals 1 Associate, 1 Price, 1 Hour Improve Transparency; Increase Trust Operational Efficiencies Grow Market Share Feed Fixed Operations Technology Being Introduced into Additional Markets (Charlotte was Pilot) CRM, Desking & Appraisal
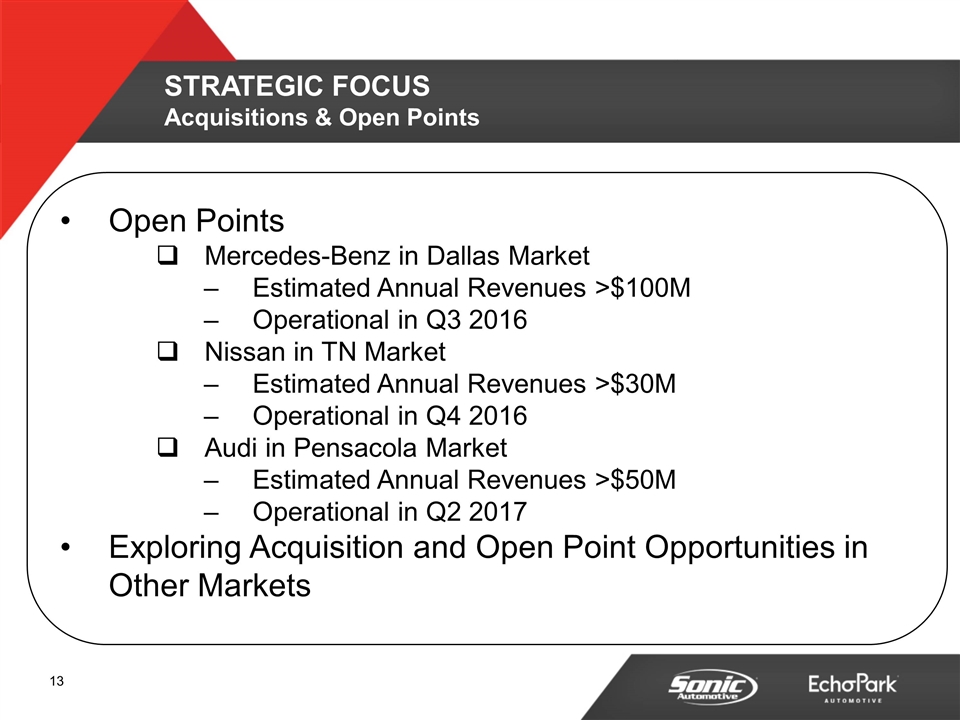
STRATEGIC FOCUS Acquisitions & Open Points Open Points Mercedes-Benz in Dallas Market Estimated Annual Revenues >$100M Operational in Q3 2016 Nissan in TN Market Estimated Annual Revenues >$30M Operational in Q4 2016 Audi in Pensacola Market Estimated Annual Revenues >$50M Operational in Q2 2017 Exploring Acquisition and Open Point Opportunities in Other Markets
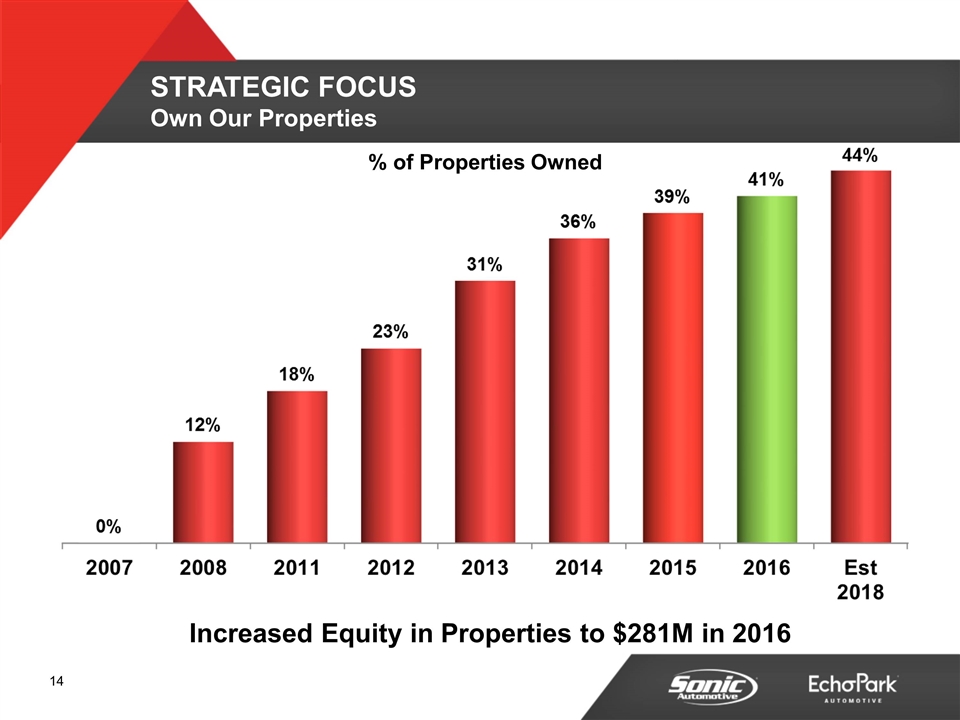
STRATEGIC FOCUS Own Our Properties % of Properties Owned Increased Equity in Properties to $281M in 2016
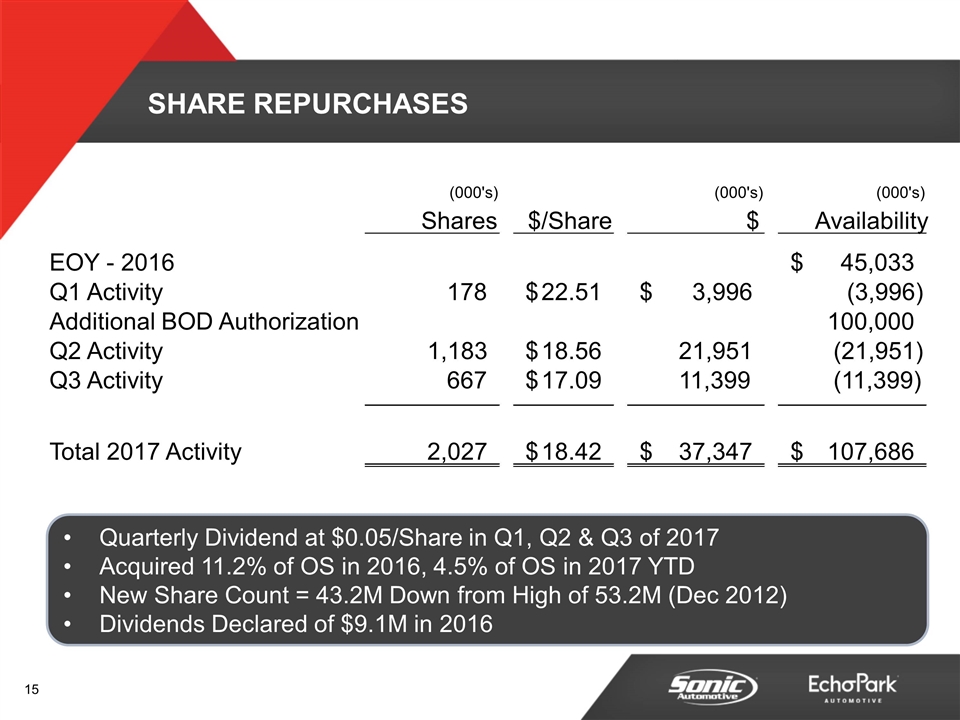
SHARE REPURCHASES Quarterly Dividend at $0.05/Share in Q1, Q2 & Q3 of 2017 Acquired 11.2% of OS in 2016, 4.5% of OS in 2017 YTD New Share Count = 43.2M Down from High of 53.2M (Dec 2012) Dividends Declared of $9.1M in 2016 (000's) (000's) (000's) Shares $/Share $ Availability EOY - 2016 45,033 $ Q1 Activity 178 22.51 $ 3,996 $ (3,996) Additional BOD Authorization 100,000 Q2 Activity 1,183 18.56 $ 21,951 (21,951) Q3 Activity 667 17.09 $ 11,399 (11,399) Total 2017 Activity 2,027 18.42 $ 37,347 $ 107,686 $
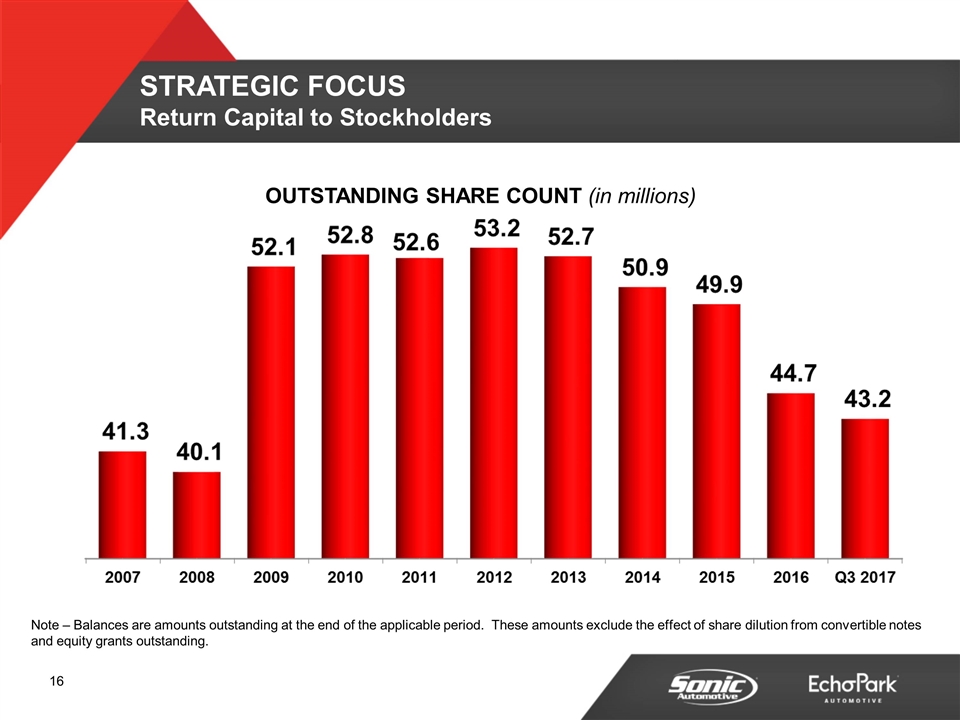
OUTSTANDING SHARE COUNT (in millions) Note – Balances are amounts outstanding at the end of the applicable period. These amounts exclude the effect of share dilution from convertible notes and equity grants outstanding. STRATEGIC FOCUS Return Capital to Stockholders
Q3 2017 Financial Review FRANCHISED DEALERSHIPS
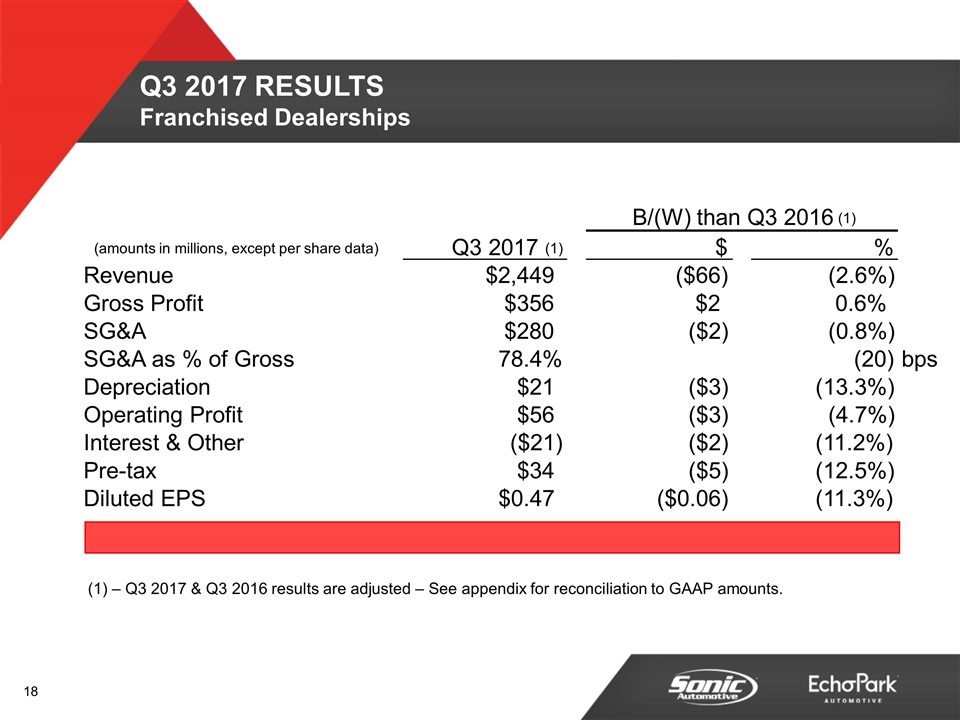
– Q3 2017 & Q3 2016 results are adjusted – See appendix for reconciliation to GAAP amounts. Q3 2017 RESULTS Franchised Dealerships B/(W) than Q3 2016 (1) (amounts in millions, except per share data) Q3 2017 (1) $ % Revenue $2,449 ($66) (2.6%) Gross Profit $356 $2 0.6% SG&A $280 ($2) (0.8%) SG&A as % of Gross 78.4% (20) bps Depreciation $21 ($3) (13.3%) Operating Profit $56 ($3) (4.7%) Interest & Other ($21) ($2) (11.2%) Pre-tax $34 ($5) (12.5%) Diluted EPS $0.47 ($0.06) (11.3%)
Q3 2017 Financial Review PRE-OWNED STORES
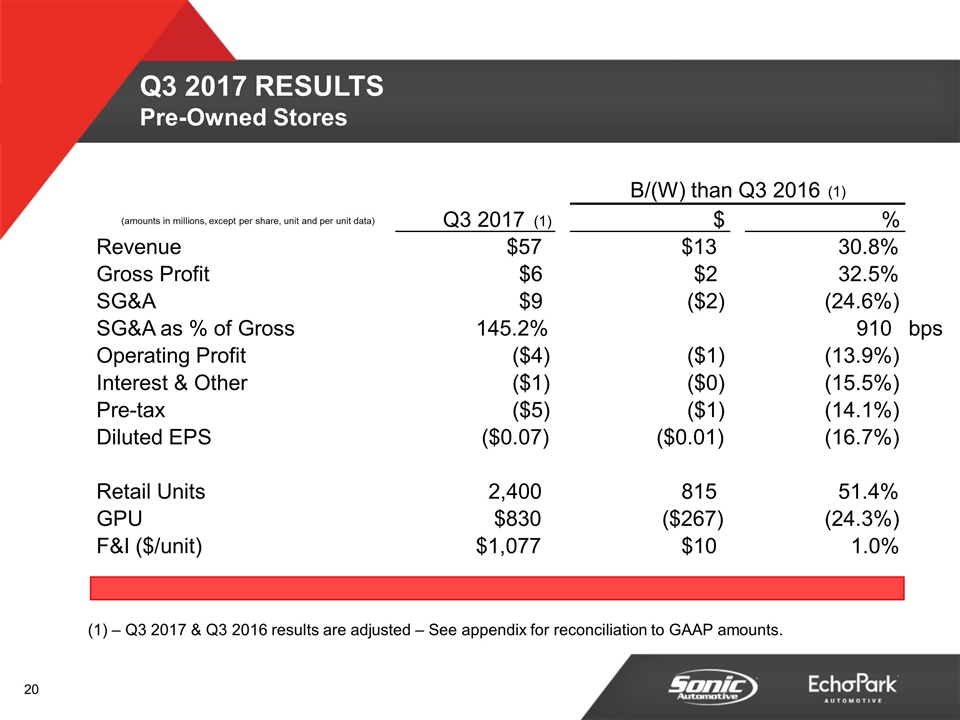
– Q3 2017 & Q3 2016 results are adjusted – See appendix for reconciliation to GAAP amounts. Q3 2017 RESULTS Pre-Owned Stores B/(W) than Q3 2016 (1) (amounts in millions, except per share, unit and per unit data) Q3 2017 (1) $ % Revenue $57 $13 30.8% Gross Profit $6 $2 32.5% SG&A $9 ($2) (24.6%) SG&A as % of Gross 145.2% 910 bps Operating Profit ($4) ($1) (13.9%) Interest & Other ($1) ($0) (15.5%) Pre-tax ($5) ($1) (14.1%) Diluted EPS ($0.07) ($0.01) (16.7%) Retail Units 2,400 815 51.4% GPU $830 ($267) (24.3%) F&I ($/unit) $1,077 $10 1.0%
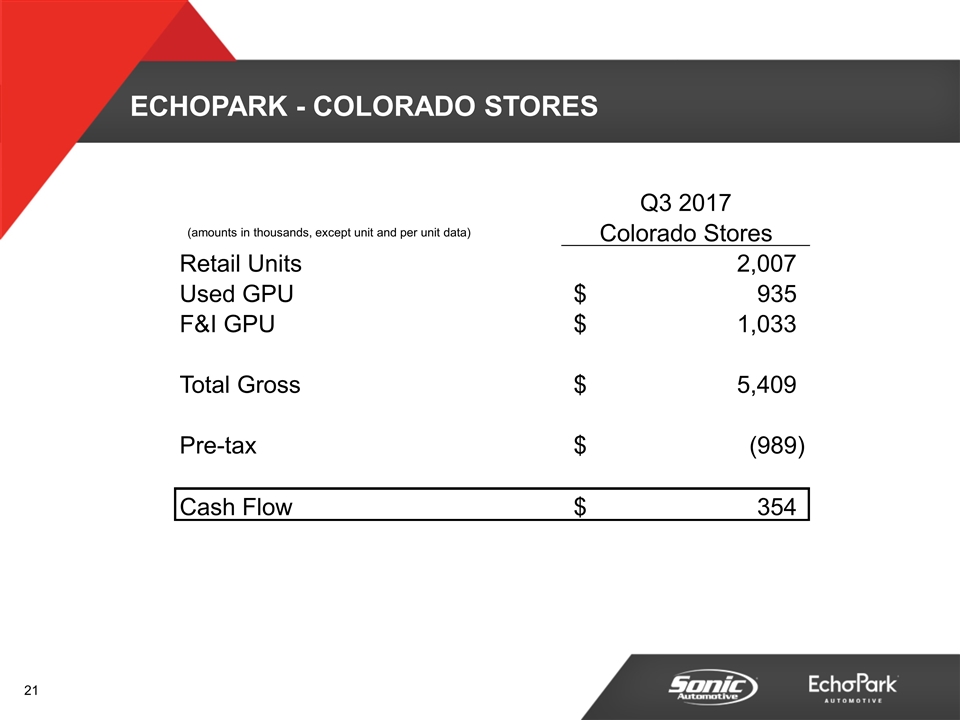
ECHOPARK - Colorado stores Q3 2017 (amounts in thousands, except unit and per unit data) Colorado Stores Retail Units 2,007 Used GPU 935 $ F&I GPU 1,033 $ Total Gross 5,409 $ Pre-tax (989) $ Cash Flow 354 $
Q3 2017 Financial Review TOTAL ENTERPRISE
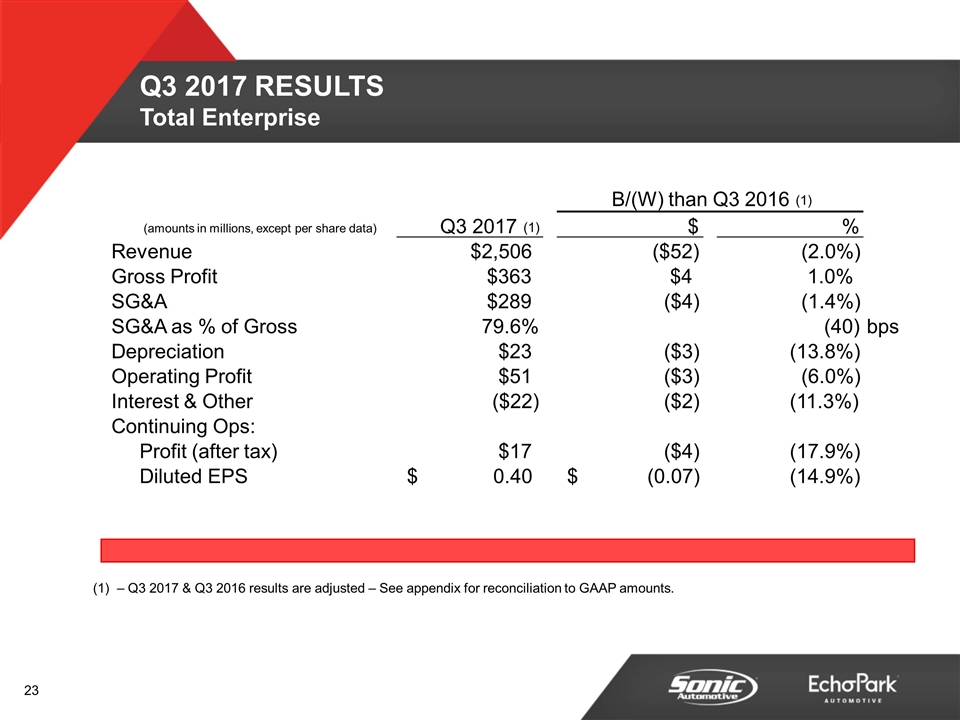
– Q3 2017 & Q3 2016 results are adjusted – See appendix for reconciliation to GAAP amounts. Q3 2017 RESULTS Total Enterprise B/(W) than Q3 2016 (1) (amounts in millions, except per share data) Q3 2017 (1) $ % Revenue $2,506 ($52) (2.0%) Gross Profit $363 $4 1.0% SG&A $289 ($4) (1.4%) SG&A as % of Gross 79.6% (40) bps Depreciation $23 ($3) (13.8%) Operating Profit $51 ($3) (6.0%) Interest & Other ($22) ($2) (11.3%) Continuing Ops: Profit (after tax) $17 ($4) (17.9%) Diluted EPS 0.40 $ (0.07) $ (14.9%)
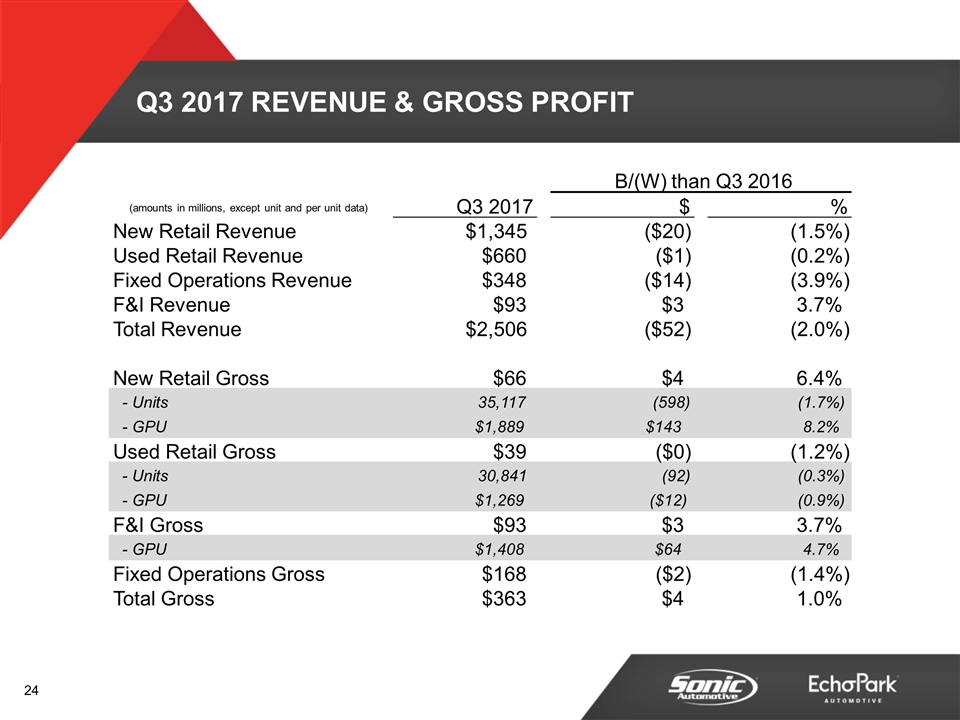
Q3 2017 REVENUE & GROSS PROFIT B/(W) than Q3 2016 (amounts in millions, except unit and per unit data) Q3 2017 $ % New Retail Revenue $1,345 ($20) (1.5%) Used Retail Revenue $660 ($1) (0.2%) Fixed Operations Revenue $348 ($14) (3.9%) F&I Revenue $93 $3 3.7% Total Revenue $2,506 ($52) (2.0%) New Retail Gross $66 $4 6.4% - Units 35,117 (598) (1.7%) - GPU $1,889 $143 8.2% Used Retail Gross $39 ($0) (1.2%) - Units 30,841 (92) (0.3%) - GPU $1,269 ($12) (0.9%) F&I Gross $93 $3 3.7% - GPU $1,408 $64 4.7% Fixed Operations Gross $168 ($2) (1.4%) Total Gross $363 $4 1.0%
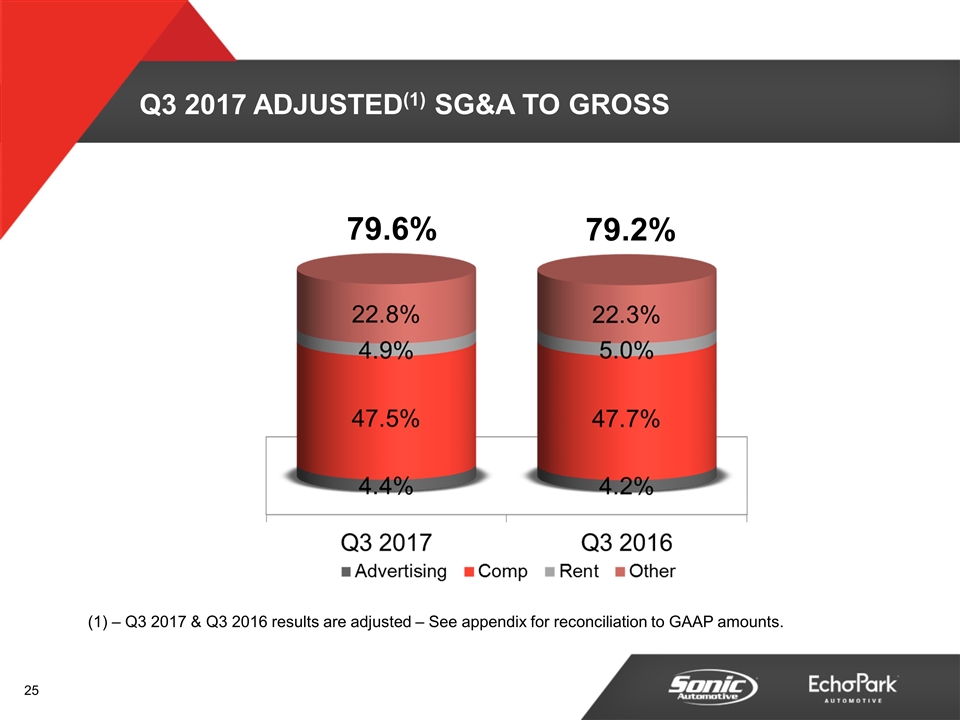
Q3 2017 ADJUSTED(1) SG&A TO GROSS 79.6% 79.2% – Q3 2017 & Q3 2016 results are adjusted – See appendix for reconciliation to GAAP amounts.
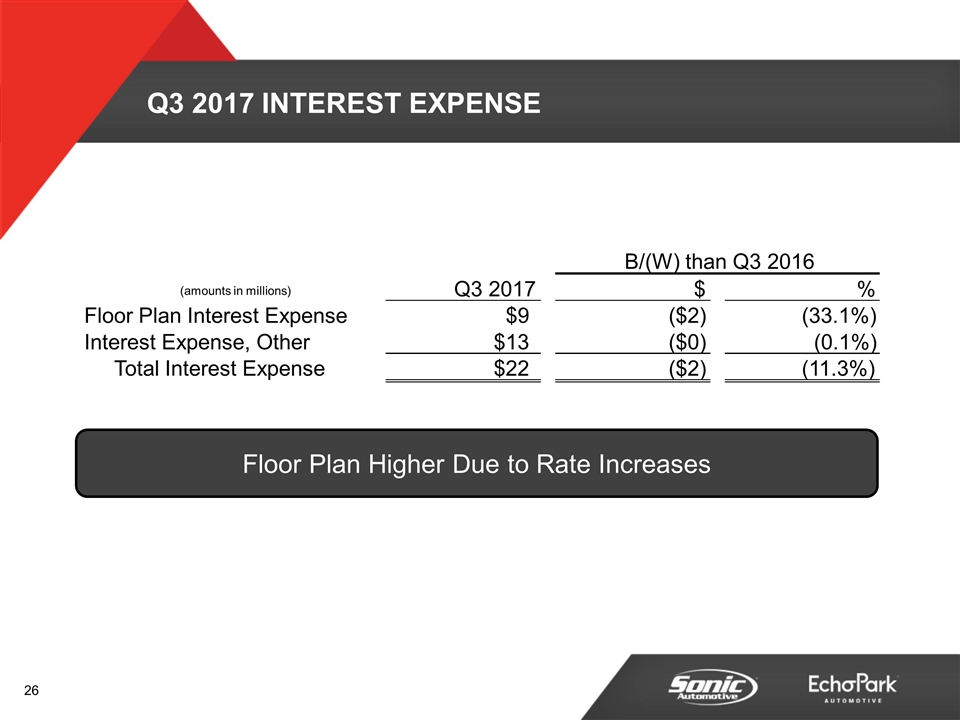
Q3 2017 INTEREST EXPENSE Floor Plan Higher Due to Rate Increases B/(W) than Q3 2016 (amounts in millions) Q3 2017 $ % Floor Plan Interest Expense $9 ($2) (33.1%) Interest Expense, Other $13 ($0) (0.1%) Total Interest Expense $22 ($2) (11.3%)
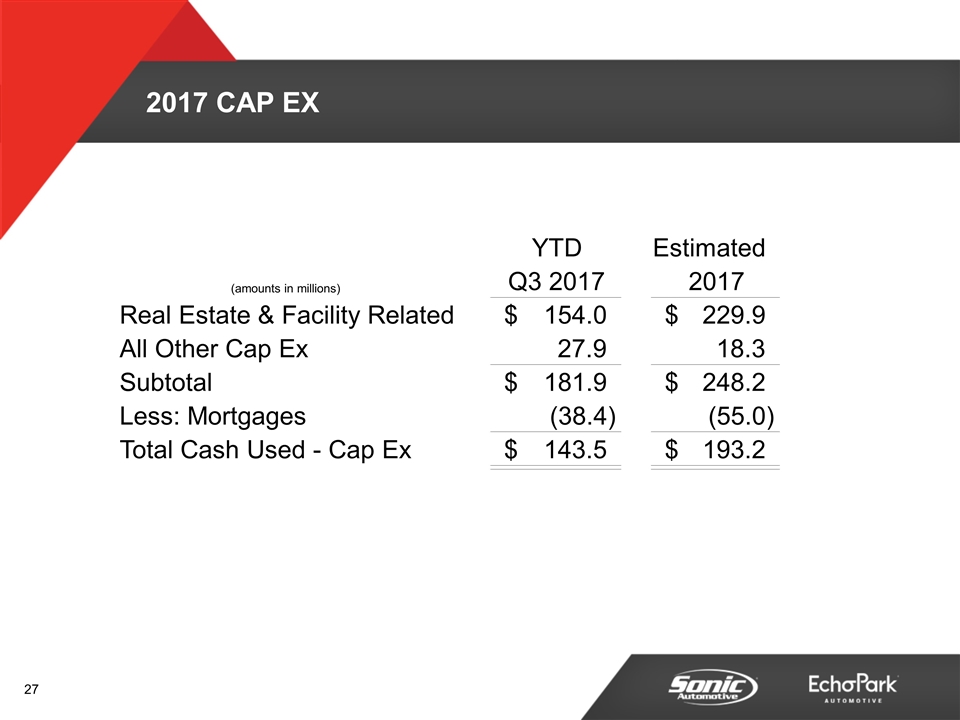
2017 CAP EX YTD Estimated Q3 2017 2017 Real Estate & Facility Related 154.0 $ 229.9 $ All Other Cap Ex 27.9 18.3 Subtotal 181.9 $ 248.2 $ Less: Mortgages (38.4) (55.0) Total Cash Used - Cap Ex 143.5 $ 193.2 $ (amounts in millions)
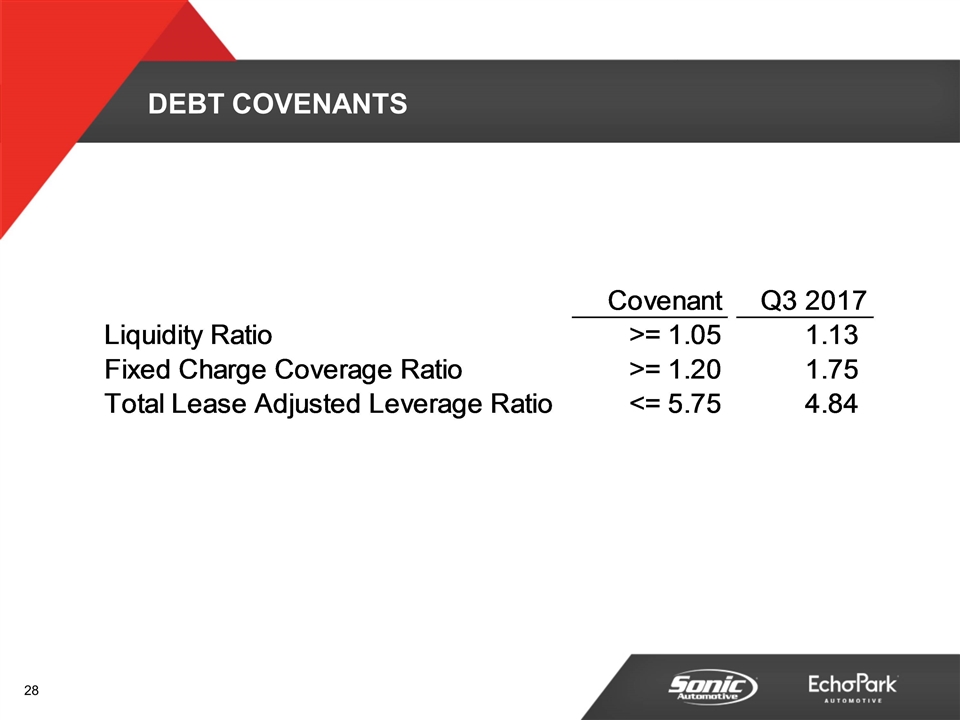
DEBT COVENANTS Covenant Q3 2017 Liquidity Ratio >= 1.05 1.1299999999999999 Fixed Charge Coverage Ratio >= 1.20 1.75 Total Lease Adjusted Leverage Ratio <= 5.75 4.84
Q3 2017 Operations Review
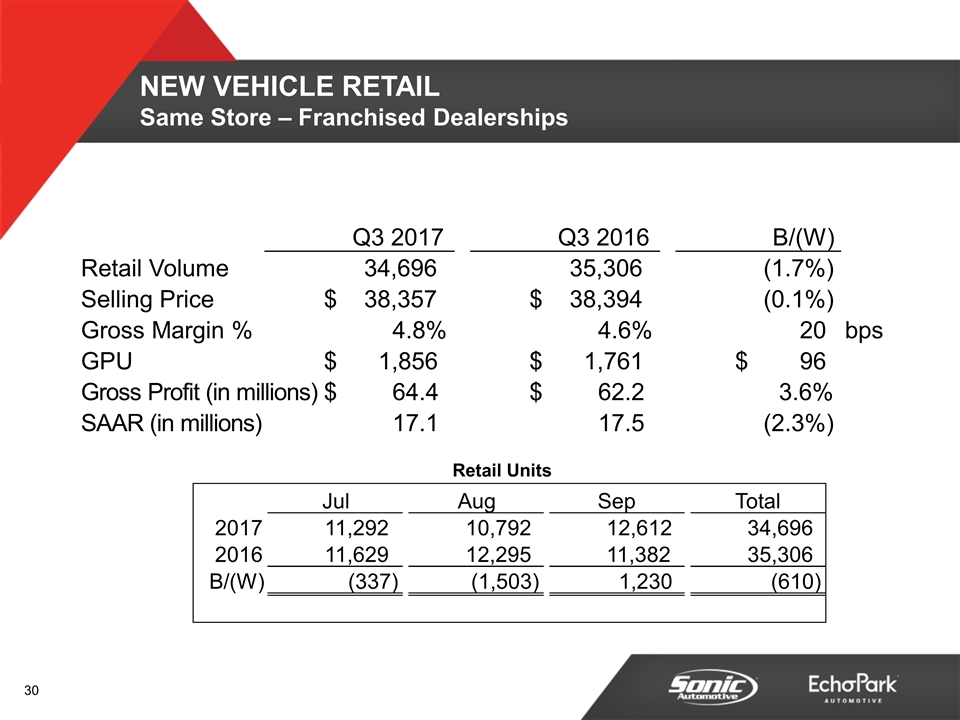
Retail Units NEW VEHICLE RETAIL Same Store – Franchised Dealerships Q3 2017 Q3 2016 B/(W) Retail Volume 34,696 35,306 (1.7%) Selling Price 38,357 $ 38,394 $ (0.1%) Gross Margin % 4.8% 4.6% 20 bps GPU 1,856 $ 1,761 $ 96 $ Gross Profit (in millions) 64.4 $ 62.2 $ 3.6% SAAR (in millions) 17.1 17.5 (2.3%) Jul Aug Sep Total 2017 11,292 10,792 12,612 34,696 2016 11,629 12,295 11,382 35,306 B/(W) (337) (1,503) 1,230 (610)
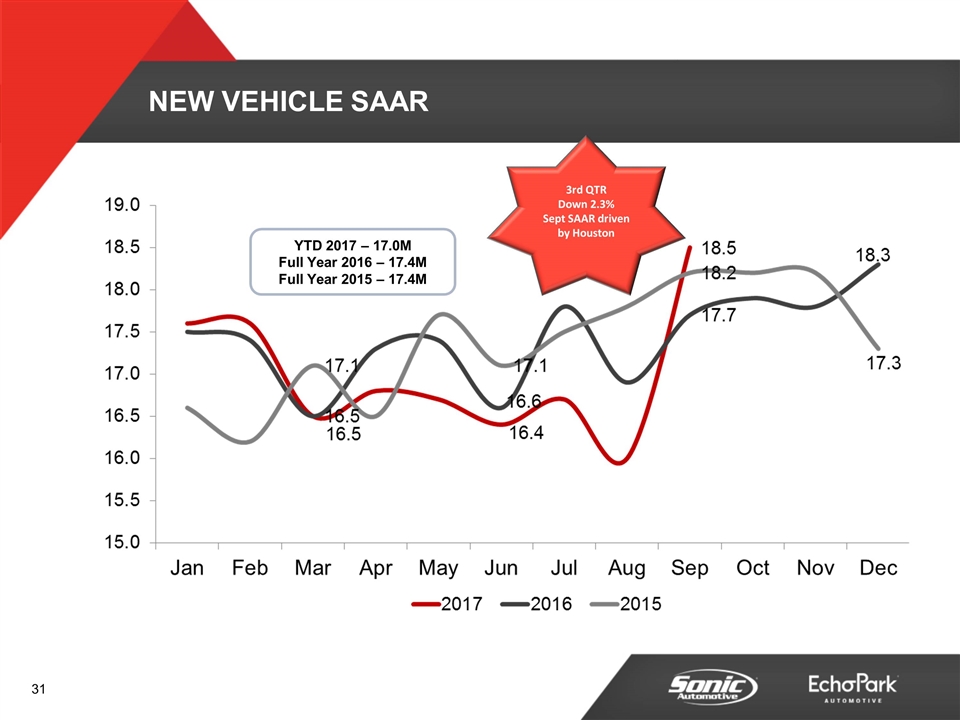
NEW VEHICLE SAAR 3rd QTR Down 2.3% Sept SAAR driven by Houston YTD 2017 – 17.0M Full Year 2016 – 17.4M Full Year 2015 – 17.4M
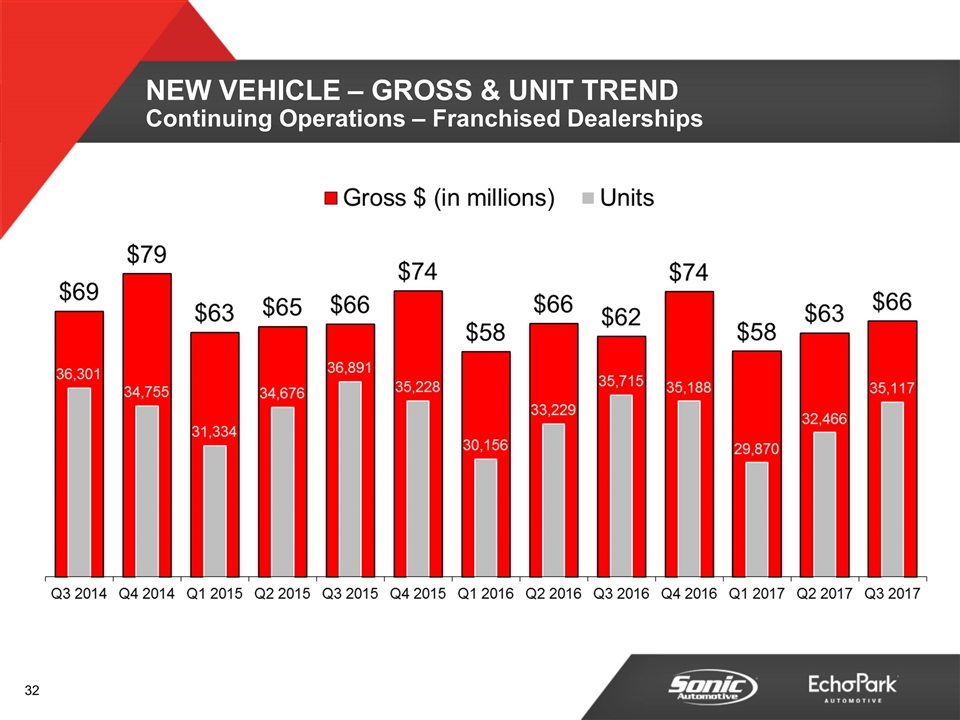
NEW VEHICLE – GROSS & UNIT TREND Continuing Operations – Franchised Dealerships
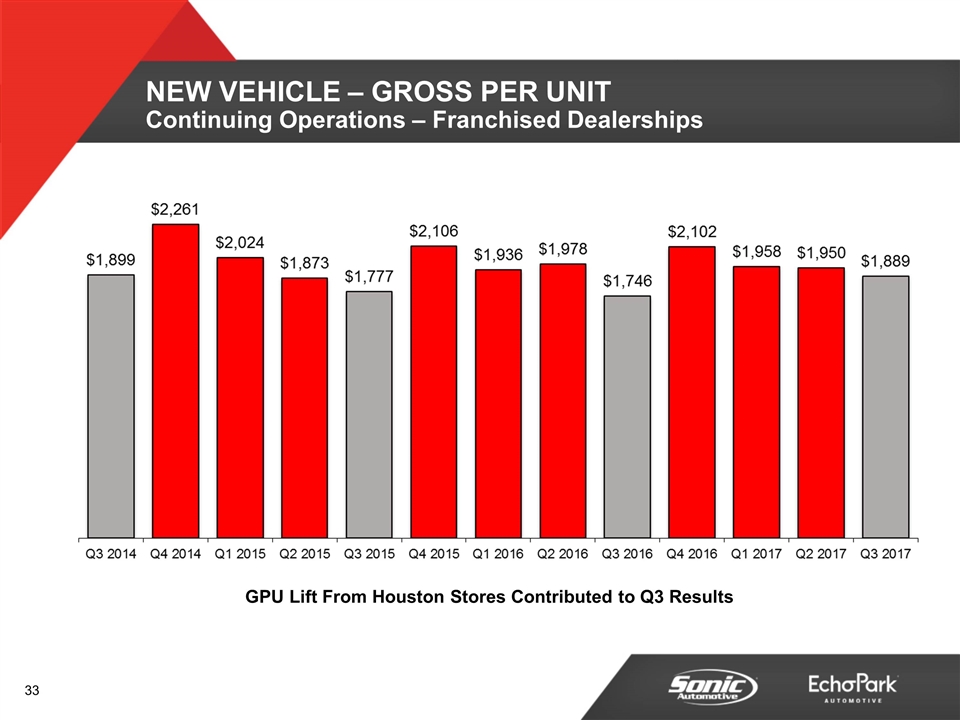
NEW VEHICLE – GROSS PER UNIT Continuing Operations – Franchised Dealerships GPU Lift From Houston Stores Contributed to Q3 Results
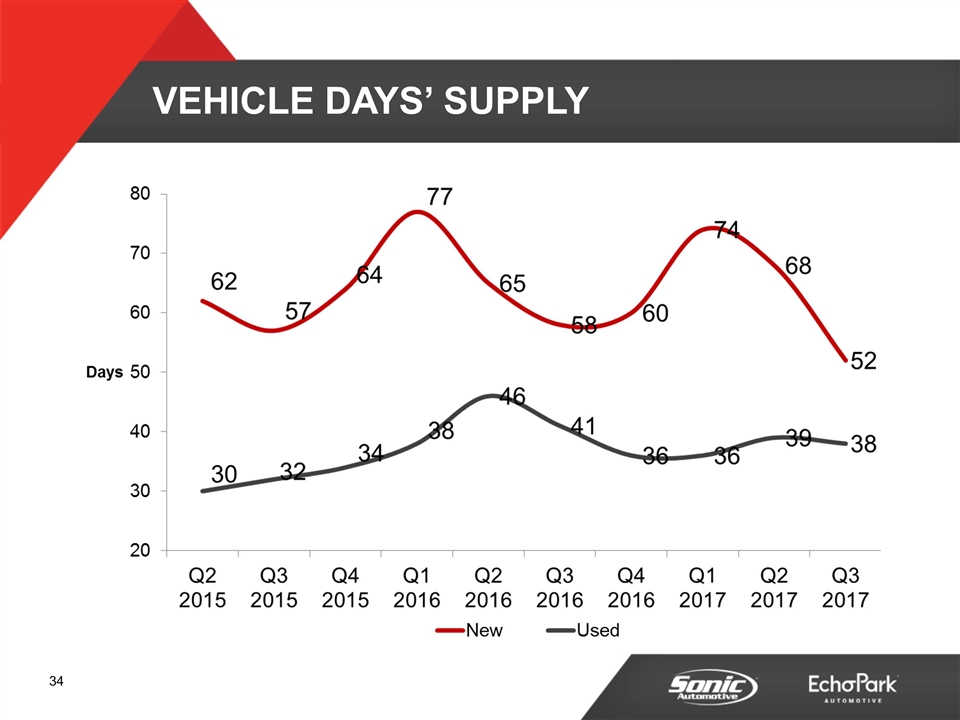
VEHICLE DAYS’ SUPPLY
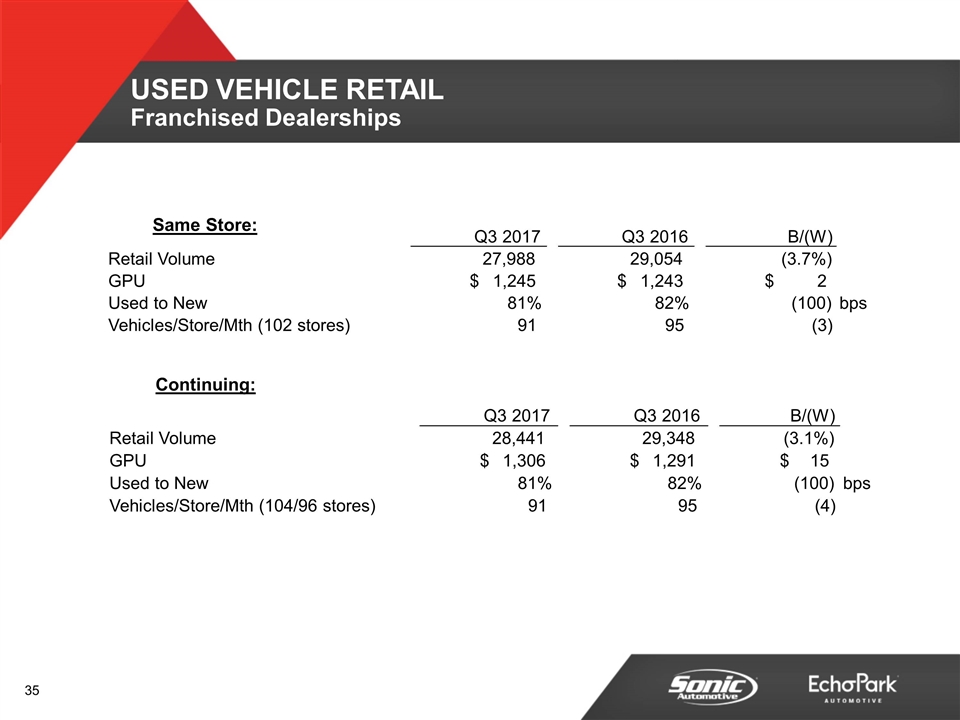
Continuing: Same Store: USED VEHICLE RETAIL Franchised Dealerships Q3 2017 Q3 2016 B/(W) Retail Volume 27,988 29,054 (3.7%) GPU 1,245 $ 1,243 $ 2 $ Used to New 81% 82% (100) bps Vehicles/Store/Mth (102 stores) 91 95 (3) Q3 2017 Q3 2016 B/(W) Retail Volume 28,441 29,348 (3.1%) GPU 1,306 $ 1,291 $ 15 $ Used to New 81% 82% (100) bps Vehicles/Store/Mth (104/96 stores) 91 95 (4)
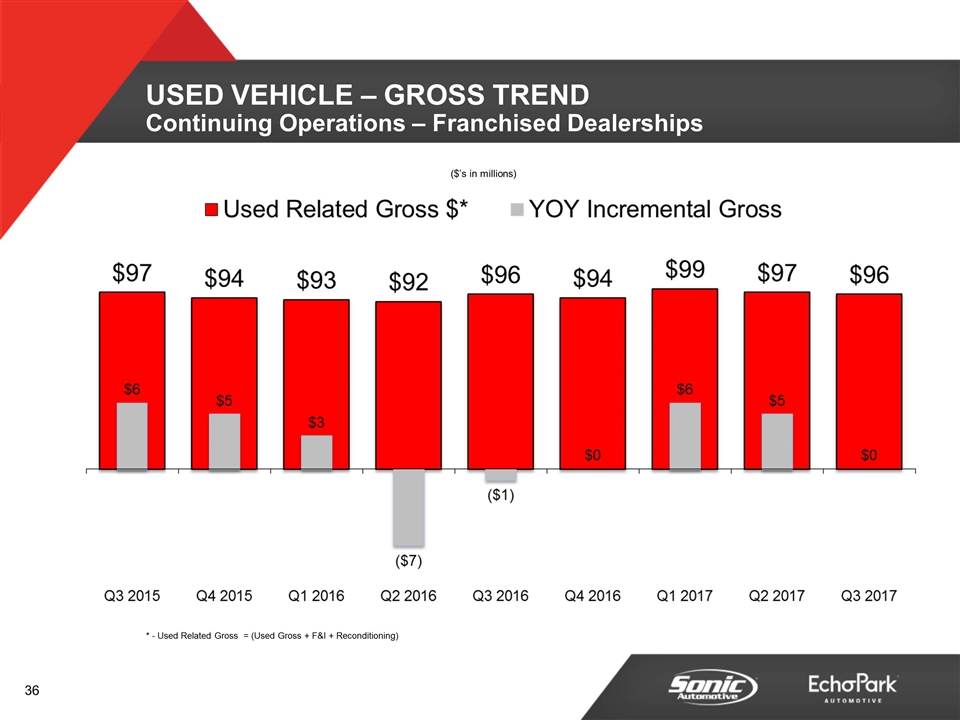
* - Used Related Gross = (Used Gross + F&I + Reconditioning) ($’s in millions) USED VEHICLE – GROSS TREND Continuing Operations – Franchised Dealerships
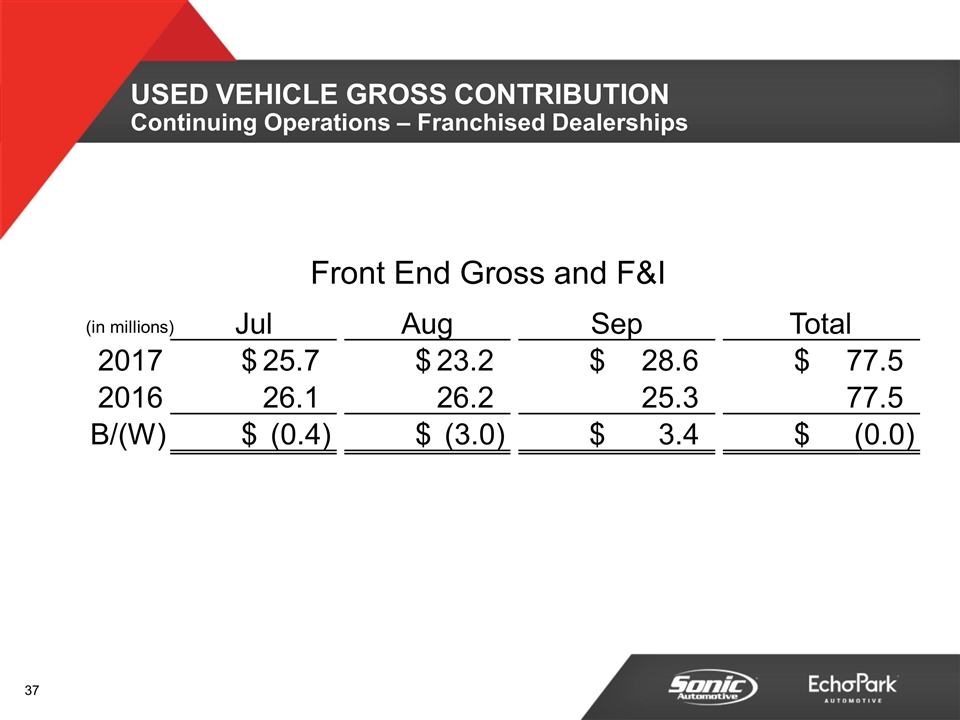
Front End Gross and F&I USED VEHICLE GROSS CONTRIBUTION Continuing Operations – Franchised Dealerships (in millions) Jul Aug Sep Total 2017 25.7 $ 23.2 $ 28.6 $ 77.5 $ 2016 26.1 26.2 25.3 77.5 B/(W) (0.4) $ (3.0) $ 3.4 $ (0.0) $
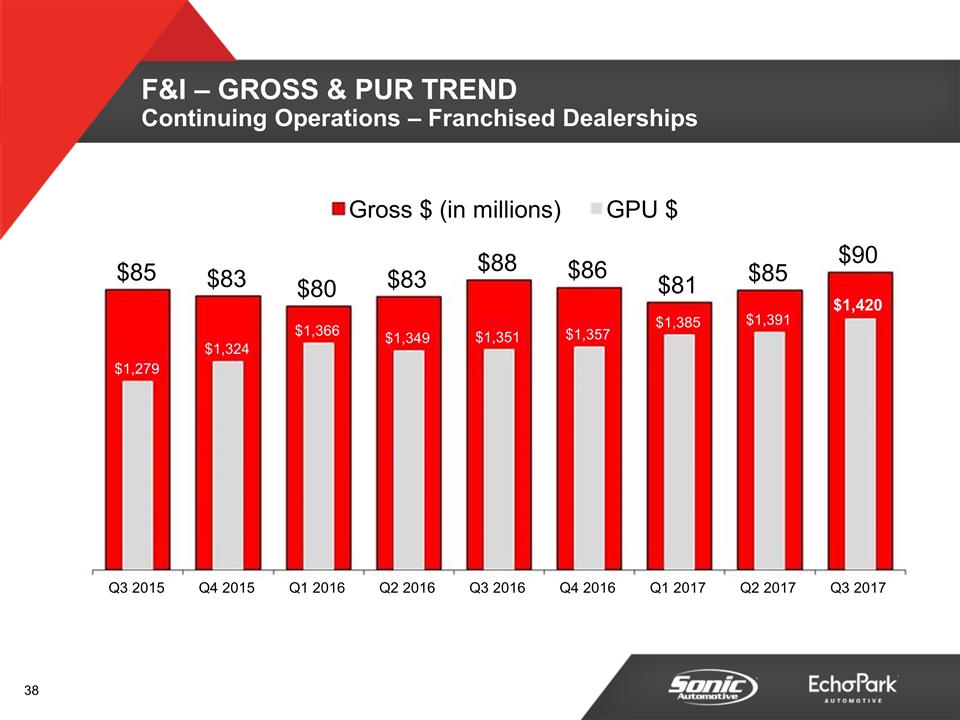
F&I – GROSS & PUR TREND Continuing Operations – Franchised Dealerships $85 $83 $80 $83 $88 $86 $81 $85 $90 $1,279 $1,324 $1,366 $1,349 $1,351 $1,357 $1,385 $1,391 $1,420 Q3 2015 Q4 2015 Q1 2016 Q2 2016 Q3 2016 Q4 2016 Q1 2017 Q2 2017 Q3 2017 Gross $ (in millions) GPU $
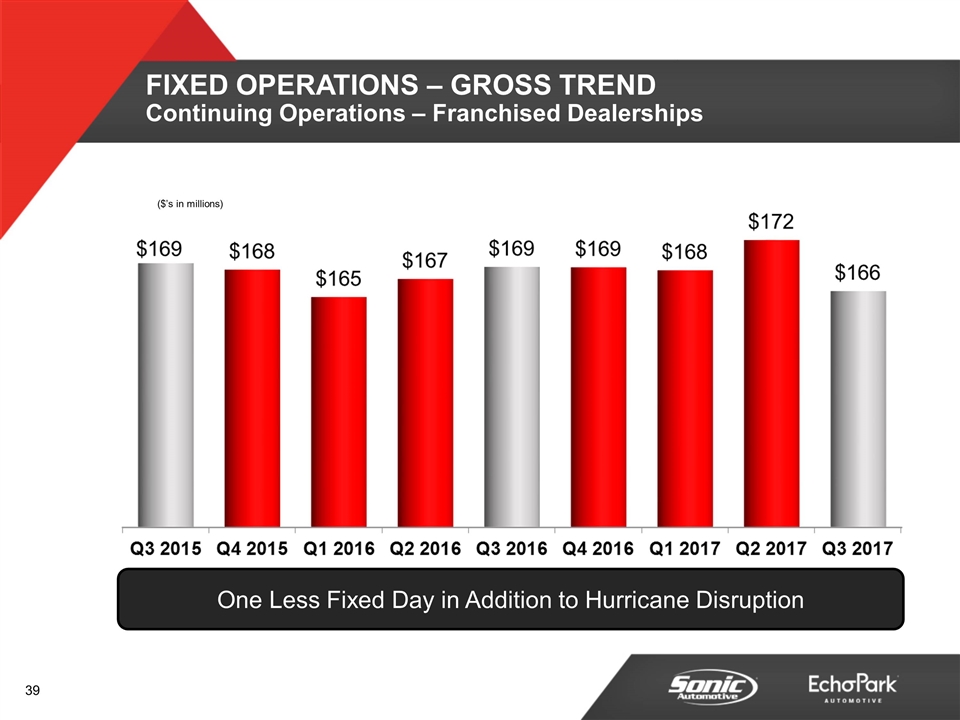
($’s in millions) FIXED OPERATIONS – GROSS TREND Continuing Operations – Franchised Dealerships One Less Fixed Day in Addition to Hurricane Disruption
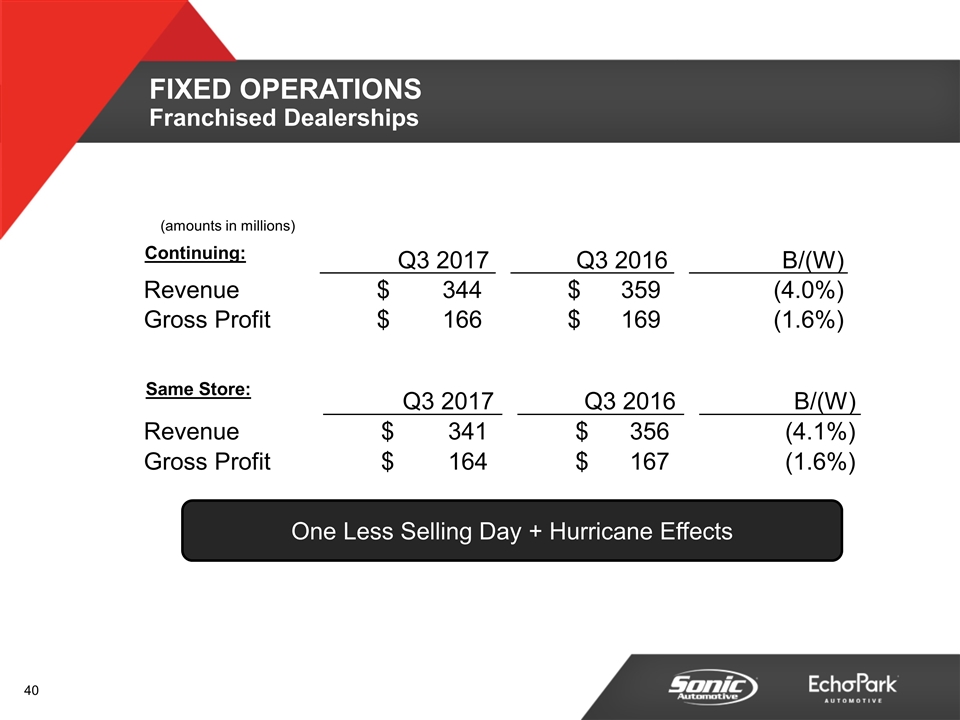
Continuing: Same Store: One Less Selling Day + Hurricane Effects FIXED OPERATIONS Franchised Dealerships Q3 2017 Q3 2016 B/(W) Revenue 344 $ 359 $ (4.0%) Gross Profit 166 $ 169 $ (1.6%) Q3 2017 Q3 2016 B/(W) Revenue 341 $ 356 $ (4.1%) Gross Profit 164 $ 167 $ (1.6%) (amounts in millions)
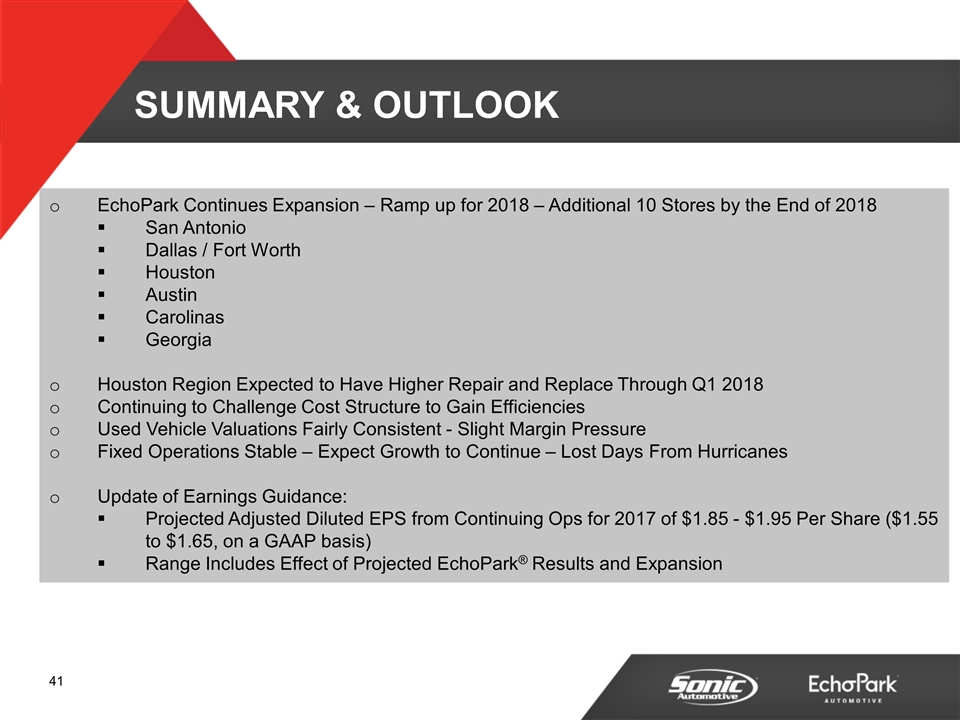
SUMMARY & OUTLOOK EchoPark Continues Expansion – Ramp up for 2018 – Additional 10 Stores by the End of 2018 San Antonio Dallas / Fort Worth Houston Austin Carolinas Georgia Houston Region Expected to Have Higher Repair and Replace Through Q1 2018 Continuing to Challenge Cost Structure to Gain Efficiencies Used Vehicle Valuations Fairly Consistent - Slight Margin Pressure Fixed Operations Stable – Expect Growth to Continue – Lost Days From Hurricanes Update of Earnings Guidance: Projected Adjusted Diluted EPS from Continuing Ops for 2017 of $1.85 - $1.95 Per Share ($1.55 to $1.65, on a GAAP basis) Range Includes Effect of Projected EchoPark® Results and Expansion

APPENDIX
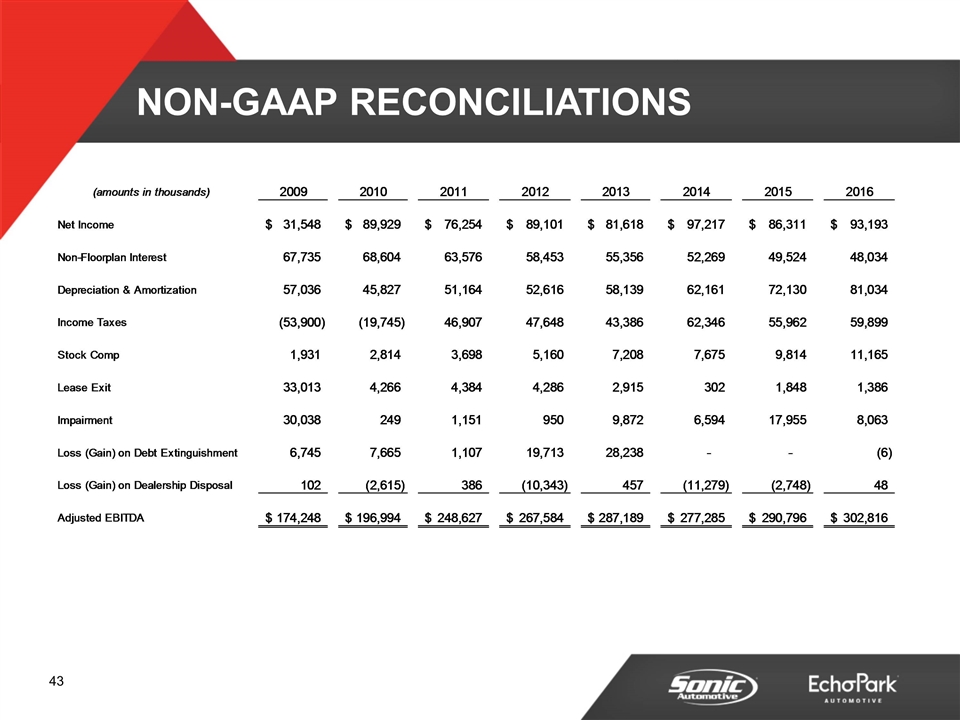
NON-GAAP RECONCILIATIONS
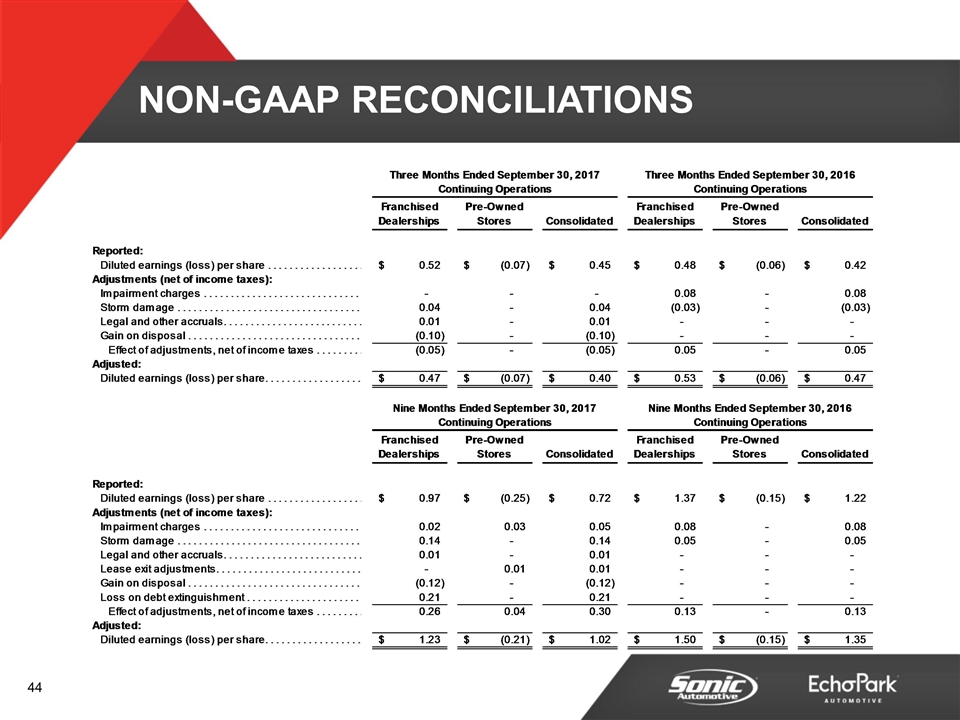
NON-GAAP RECONCILIATIONS
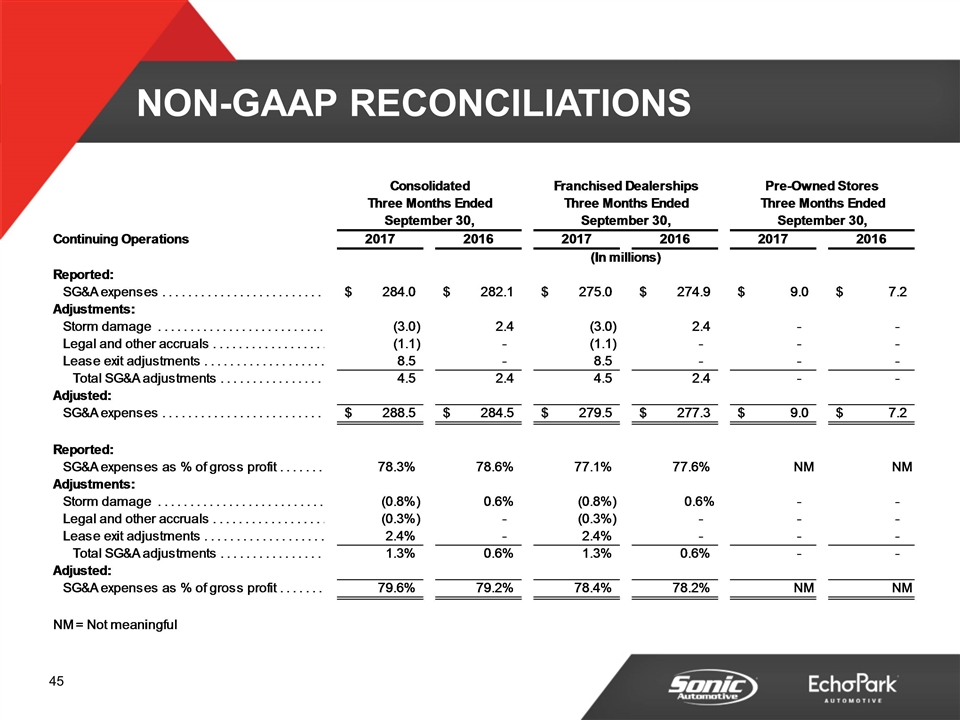
NON-GAAP RECONCILIATIONS
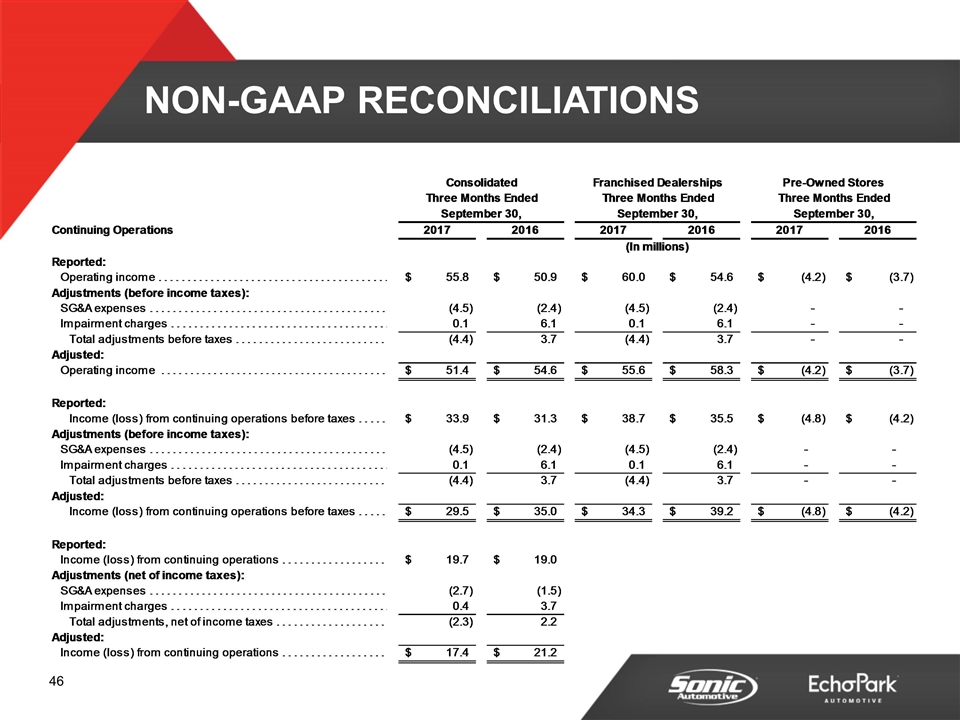
NON-GAAP RECONCILIATIONS
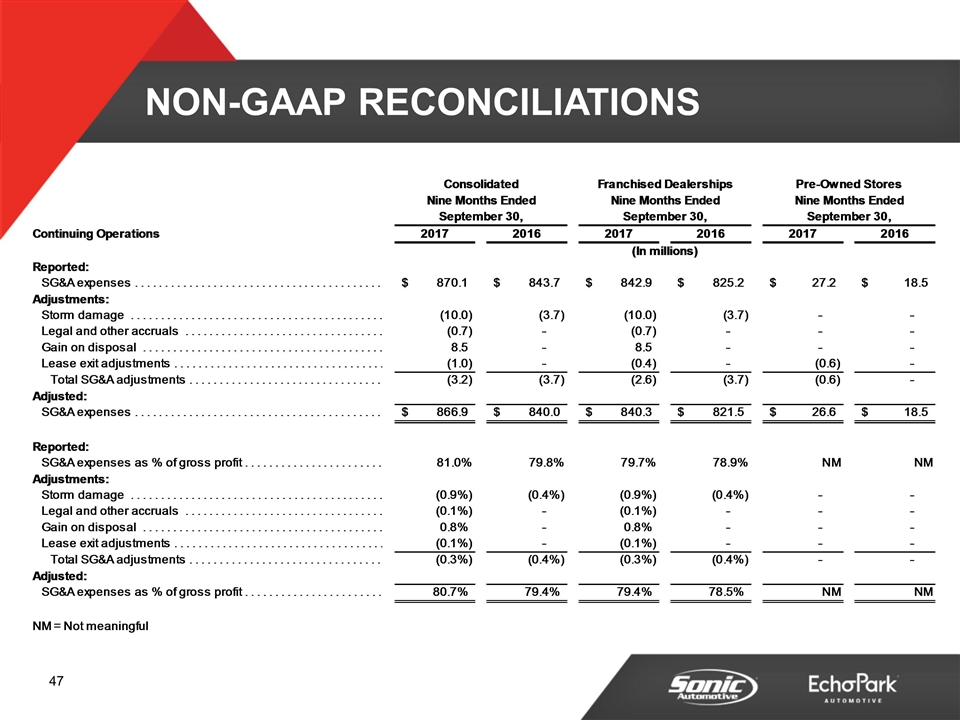
NON-GAAP RECONCILIATIONS
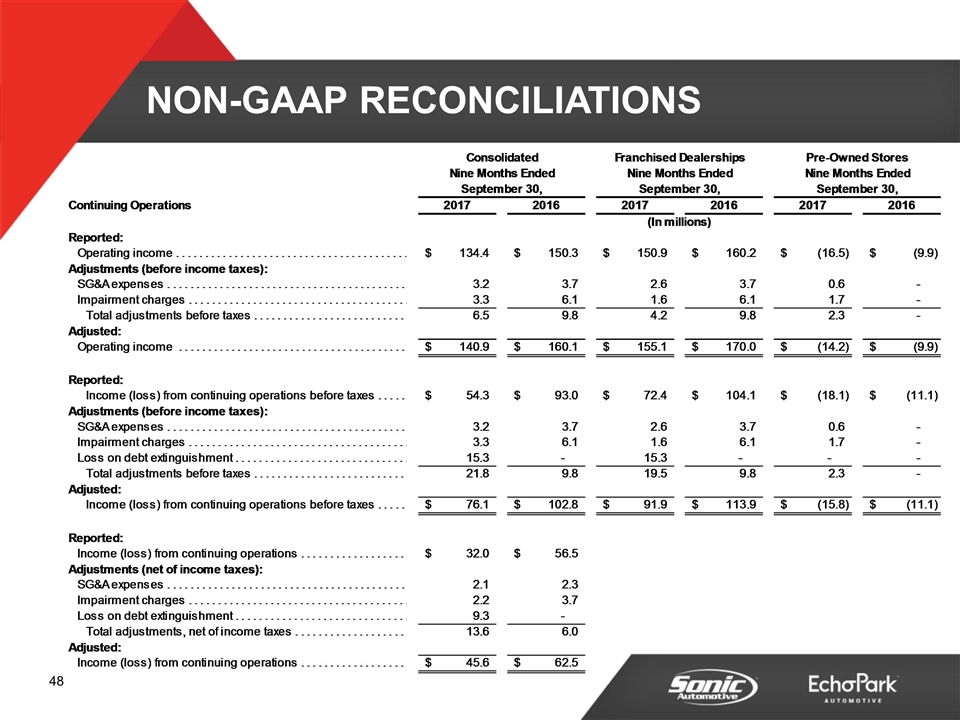
NON-GAAP RECONCILIATIONS
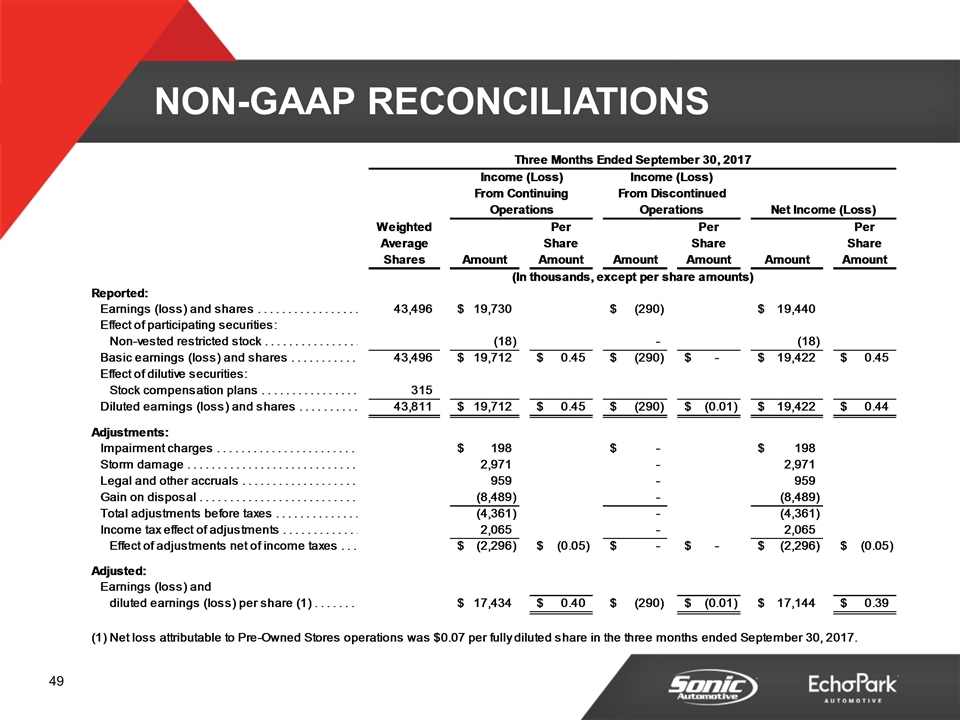
NON-GAAP RECONCILIATIONS
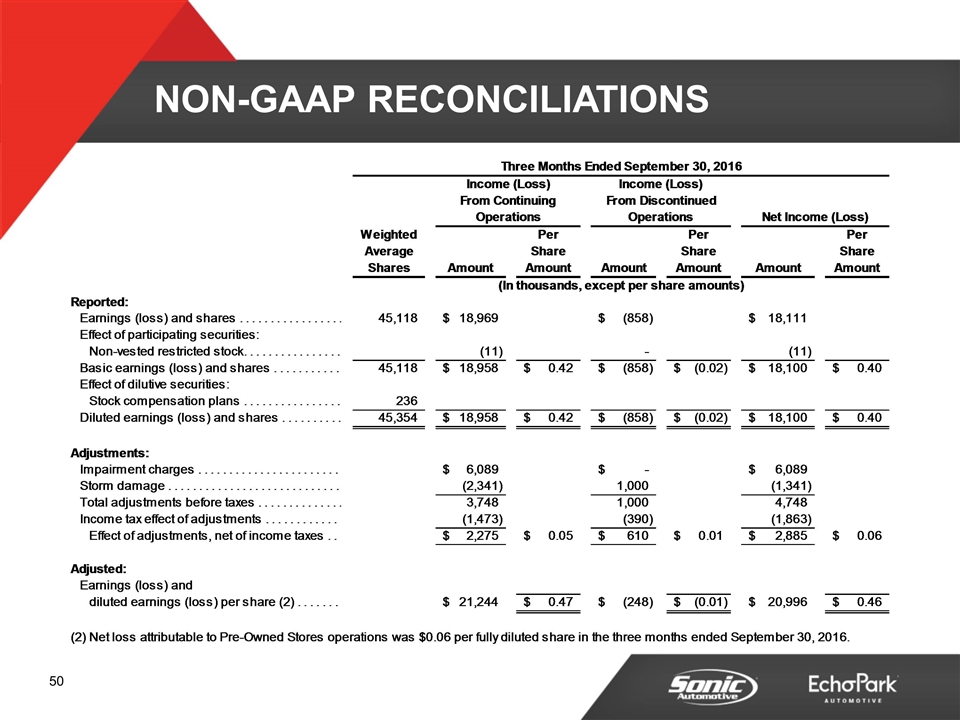
NON-GAAP RECONCILIATIONS
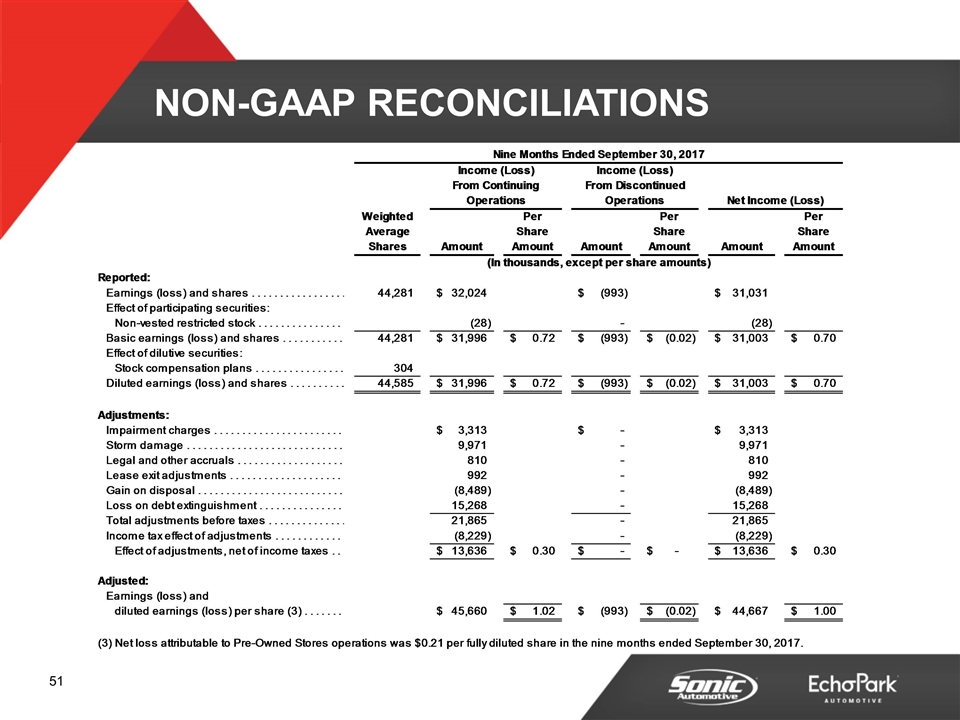
NON-GAAP RECONCILIATIONS
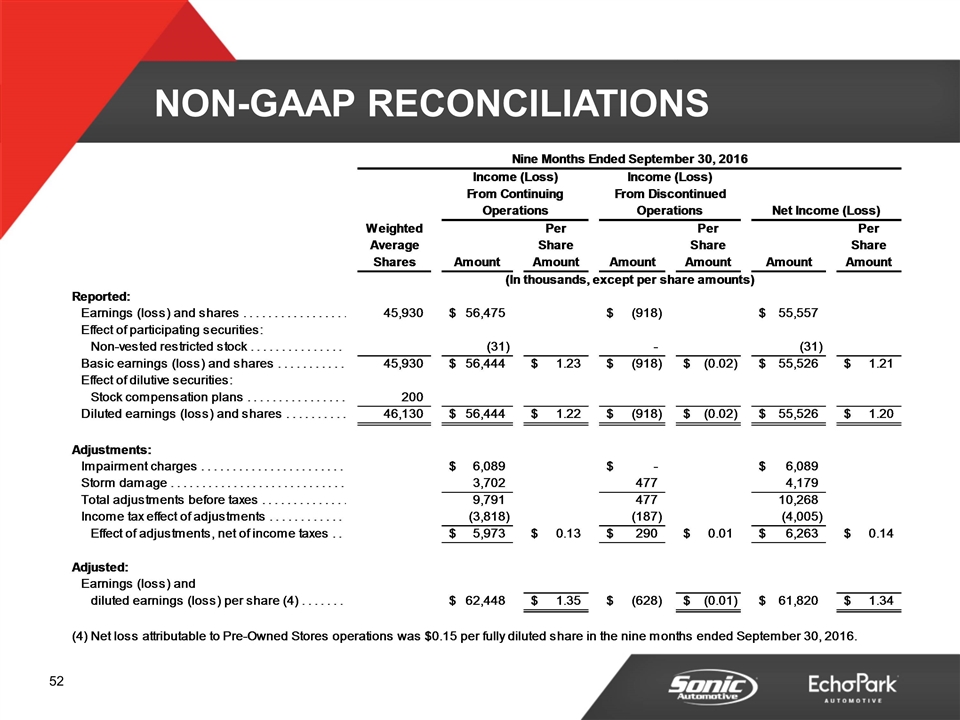
NON-GAAP RECONCILIATIONS
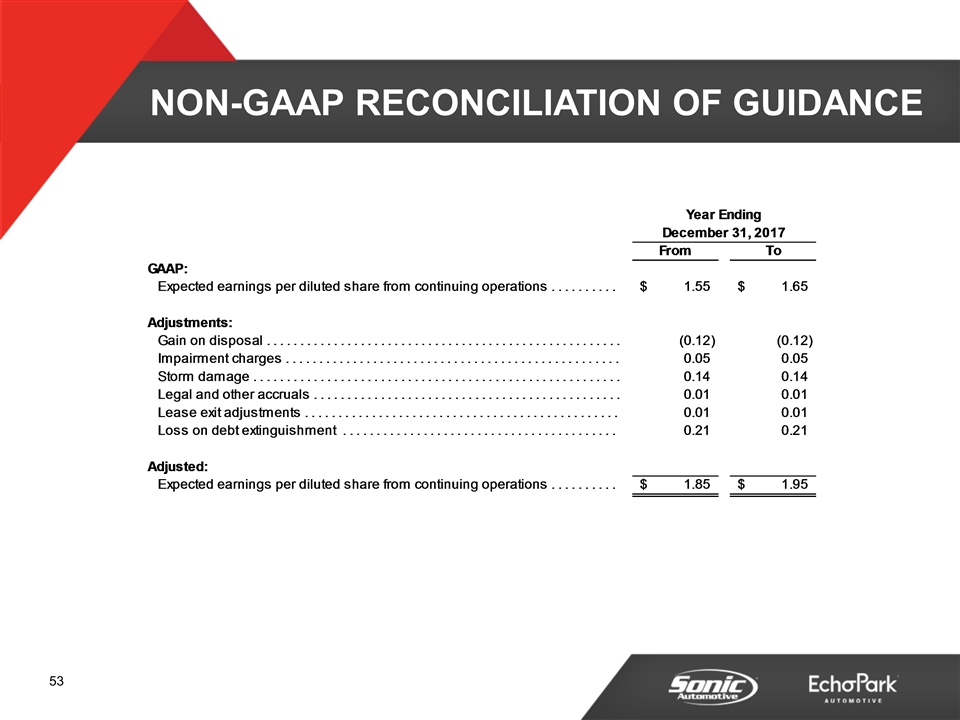
NON-GAAP RECONCILIATION OF GUIDANCE