Exhibit 99.1

EXCERPTS FROM PRELIMINARY OFFERING MEMORANDUM, DATED OCTOBER 13, 2021

CAUTIONARY NOTICE REGARDING FORWARD-LOOKING STATEMENTS

This offering memorandum contains numerous “forward-looking statements” within the meaning of Section 27A of the Securities Act and Section 21E of the Securities Exchange Act of 1934, as amended (the “Exchange Act”). These forward-looking statements address our future objectives, plans and goals, as well as our intent, beliefs and current expectations regarding future operating performance, results and events, and can generally be identified by words such as “may,” “will,” “should,” “believe,” “expect,” “estimate,” “anticipate,” “intend,” “plan,” “foresee” and other similar words or phrases.

These forward-looking statements are based on our current estimates and assumptions and involve various risks and uncertainties. As a result, you are cautioned that these forward-looking statements are not guarantees of future performance and that actual results could differ materially from those projected in these forward-looking statements. Factors which may cause actual results to differ materially from our projections include those risks described in “Risk Factors” and elsewhere in this offering memorandum and in our filings with the SEC that are incorporated by reference into this offering memorandum, as well as:


the number of new and used vehicles sold in the United States as compared to our expectations and the expectations of the market;


the reputation and financial condition of vehicle manufacturers whose brands we represent, the financial incentives vehicle manufacturers offer and their ability to design, manufacture, deliver and market their vehicles successfully;


our relationships with manufacturers, which may affect our ability to obtain desirable new vehicle models in inventory or to complete additional acquisitions or dispositions;


our ability to consummate and achieve the benefits of the Acquisition;


our ability to combine the RFJ Auto and Sonic businesses in a manner that facilitates growth opportunities and realizes anticipated cost synergies and performance improvements;


our business and growth strategies, including, but not limited to, our EchoPark store operations;


our ability to generate sufficient cash flows or to obtain additional financing to fund our EchoPark expansion, capital expenditures, our share repurchase program, dividends on our common stock, acquisitions and general operating activities;


the adverse resolution of one or more significant legal proceedings against us or our franchised dealerships or EchoPark stores;


the significant flexibility provided by the indentures that will govern the notes to pursue a strategic transaction involving our EchoPark business and to use the proceeds therefrom without noteholder consent;


changes in laws and regulations governing the operation of automobile franchises, accounting standards, taxation requirements and environmental laws, including any change in law or regulations in response to the COVID-19 pandemic;


changes in vehicle and parts import quotas, duties, tariffs or other restrictions, including supply shortages that could be caused by the COVID-19 pandemic or other supply chain disruptions;


the severity and duration of the COVID-19 pandemic and the actions taken by vehicle manufacturers, governmental authorities, businesses or consumers in response to the pandemic, including in response to a worsening or “next wave” of the pandemic or as a result of a variant of COVID-19 or otherwise;


the inability of vehicle manufacturers and their suppliers to obtain, produce and deliver vehicles or parts and accessories to meet demand at our franchised dealerships for sale and use in our parts, service and collision repair operations;


general economic conditions in the markets in which we operate, including fluctuations in interest rates, employment levels, the level of consumer spending and consumer credit availability;


high levels of competition in the retail automotive industry, which not only create pricing pressures on the products and services we offer, but also on businesses we may seek to acquire;


the impact of pursuing or not pursuing strategic alternatives relating to certain of our operations;


our ability to successfully integrate potential future acquisitions;


the significant control that our principal stockholders exercise over us and our business matters; and


the rate and timing of overall economic expansion or contraction.

These forward-looking statements speak only as of the date of this offering memorandum or the documents incorporated by reference into the offering memorandum, as applicable, and we undertake no obligation to revise or update these statements to reflect subsequent events or circumstances.


SPECIAL NOTE REGARDING NON-GAAP FINANCIAL MEASURES

In evaluating its business, the Company considers and uses Adjusted EBITDA, Adjusted EBITDAR and certain ratios and other measures calculated using Adjusted EBITDA as supplemental measures of its operating performance. Adjusted EBITDA is defined as net income plus non-floor plan interest expense, income taxes, impairment charges, (gain) loss on disposal of dealerships and real estate, (gain) loss on exit of leased dealerships, (gain) loss on retirement of debt, long term compensation expense, non-cash stock-based compensation expense, depreciation and amortization, and certain other non-recurring items, for all operations, continuing and discontinued. Adjusted EBITDAR is defined as Adjusted EBITDA plus rent expense.

The terms Adjusted EBITDA and Adjusted EBITDAR are not defined under accounting principles generally accepted in the United States (“U.S. GAAP”) and they and the ratios and measures calculated using them are not measures of operating income, operating performance or liquidity presented in accordance with U.S. GAAP. Adjusted EBITDA, Adjusted EBITDAR and ratios and measures calculated using them have limitations as analytical tools, and when assessing the Company’s operating performance, investors should not consider Adjusted EBITDA or Adjusted EBITDAR or ratios and measures calculated using Adjusted EBITDA in isolation, or as substitutes for net income (loss), cash flow from operations, or other consolidated income statement data prepared in accordance with U.S. GAAP or calculated using such data prepared in accordance with U.S. GAAP. Among other things, Adjusted EBITDA and Adjusted EBITDAR do not reflect the Company’s actual cash expenditures. Other companies may calculate similar measures differently than the Company, limiting their usefulness as comparative tools.


ii


While Adjusted EBITDA and Adjusted EBITDAR should not be construed as a substitute for net income (loss) or as a better measure of liquidity than net cash provided by operating activities, it is included in our discussion of earnings to provide additional information regarding the amount of cash our business is generating with respect to our ability to meet future debt services, capital expenditures and working capital requirements. Consistent with industry practices, Sonic’s management uses Adjusted EBITDA and Adjusted EBITDAR as one factor when valuing dealership operations.

For a reconciliation of Adjusted EBITDA and Adjusted EBITDAR to the most directly comparable U.S. GAAP financial measure, see “Summary Historical and Pro Forma Financial Data and Operating Data of the Company” included elsewhere in this offering memorandum.


INDUSTRY, MARKET AND COMPETITIVE POSITION DATA

We obtained the industry, market and competitive position data included in and incorporated by reference into this offering memorandum from our own internal estimates and research as well as from industry publications and research, studies and surveys conducted by third parties. Industry publications, studies and surveys generally state that they have been obtained from sources believed to be reliable, although they do not guarantee the accuracy or completeness of such information. While we believe that each of these publications, studies and surveys is reliable, we have not independently verified industry, market and competitive position data from third-party sources. While we believe our internal business research is reliable and the market definitions are appropriate, neither such research nor these definitions have been verified by any independent source. Accordingly, investors should not place undue weight on the industry, market and competitive position data presented in this offering memorandum.

Certain Defined Terms Used Herein

Except as otherwise indicated or as the context otherwise requires, all references in this offering memorandum to (i) “Sonic,” the “Company,” “we,” “us” and “our” mean Sonic Automotive, Inc. and its subsidiaries and (ii) “SAI” mean Sonic Automotive, Inc. but not any of its subsidiaries. All references to the “Combined Company” refer to Sonic Automotive, Inc. and its subsidiaries, after giving effect to the Acquisition.

When used herein, unless the context requires otherwise, or as specifically described below:


The term “2021 Floor Plan Facilities” means, together, the amended and restated syndicated new and used vehicle floor plan credit facilities that we entered into on April 14, 2021.


iii


The term “2021 New Vehicle Floor Plan Facility” means, as amended, the new vehicle revolving floor plan facility under the 2021 Floor Plan Facilities.


The term “2021 Used Vehicle Floor Plan Facility” means, as amended, the used vehicle revolving floor plan facility under the 2021 Floor Plan Facilities.


The term “2029 Notes” means the Company’s                 % Senior Notes due 2029.


The term “2031 Notes” means the Company’s                 % Senior Notes due 2031.


The term “6.125% Notes” means our outstanding 6.125% Senior Subordinated Notes due 2027.


The term “Acquisition” means the acquisition of RFJ Auto pursuant to the Merger Agreement, pursuant to which we will acquire the new and used automotive retail business of RFJ Auto, together with the associated real estate, inventory and other related assets.


The term “CPO” means certified pre-owned.


The term “CSI” means Customer Satisfaction Index.


The term “Exchange Act” means the Securities Exchange Act of 1934, as amended.


The terms “finance and insurance” or “F&I” mean, collectively, the arrangement of extended warranties, service contracts, financing, insurance and other aftermarket products.


The term “Fixed Operations” means, collectively, sales of replacement parts and performance of vehicle maintenance, manufacturer warranty repairs, and paint and collision repair services.


The term “HSR Act” means the Hart-Scott-Rodino Antitrust Improvements Act of 1976, as amended.


The term “LTM Period” means for the twelve months ended June 30, 2021.


The term “Merger Agreement” means that certain Agreement and Plan of Merger, dated as of September 17, 2021, by and among Sonic Automotive, Inc., RFJ Auto and the other parties thereto.


The term “notes” means, together, the 2029 Notes and the 2031 Notes.


The term “RFJ Auto” means RFJ Auto Partners, Inc., together with its subsidiaries.


The term “Special Mandatory Redemption” means the requirement that we redeem $700.0 million aggregate principal amount of the notes, with such redemption being allocated to each series of notes on a pro rata basis on the aggregate principal amount of each series of notes, at a redemption price equal to


iv


100% of the principal amount thereof (the “Mandatory Redemption Amount”), plus accrued and unpaid interest to, but excluding, the redemption date, if (i) the consummation of the Acquisition does not occur on or before January 31, 2022 (the “End Date”) or (ii) the Company notifies the trustee of its abandonment or termination of the Merger Agreement or its determination that the consummation of the Acquisition will not occur before the End Date.


The term “SEC” means the U.S. Securities and Exchange Commission.


The term “Securities Act” means the Securities Act of 1933, as amended.


The term “U.S. GAAP” means accounting principles generally accepted in the United States.


v


OFFERING MEMORANDUM SUMMARY

This summary highlights selected information included in or incorporated by reference into this offering memorandum. The following summary does not contain all of the information that you should consider before investing in the notes and is qualified in its entirety by the more detailed information appearing elsewhere in this offering memorandum and the financial statements and the documents incorporated by reference herein. You should carefully read this entire offering memorandum, including the “Risk Factors” section beginning on page 22 and the risk factors incorporated by reference herein, before making an investment decision. See “Where You Can Find More Information About Sonic.”

Overview

We are one of the largest automotive retailers in the United States (as measured by total revenue). For the twelve months ended June 30, 2021 (the “LTM Period”), the Company generated revenue of $11.5 billion, net income of $285.2 million and Adjusted EBITDA of $536.6 million. For a reconciliation of the Company’s Adjusted EBITDA to net income (loss), which is the most directly comparable U.S. GAAP financial measure, see “Summary Historical and Pro Forma Financial Data and Operating Data of the Company.” Included in the Company’s results for the LTM Period were revenue of $1.9 billion and an Adjusted EBITDA deficit of $3.0 million from the EchoPark Segment, which represented, as of June 30, 2021, 18.4% of the Company’s total assets and 18.2% of the Company’s total liabilities. The EchoPark subsidiaries will initially guarantee the notes but may be designated by the Company at any time as unrestricted subsidiaries, subject only to no event of default, at which time they would cease to guarantee the notes and would not be subject to the indenture’s restrictive covenants. See “Risk Factors– Risks Related to the Notes—The indentures that will govern the notes will provide us with significant flexibility to pursue a strategic transaction involving the EchoPark business without noteholder consent.”

On September 17, 2021, SAI and one of its subsidiaries entered into the Merger Agreement with RFJ Auto and the representative of RFJ Auto’s equityholders, pursuant to which RFJ Auto will merge with and into a subsidiary of SAI with RFJ Auto surviving the merger and becoming a direct, wholly owned subsidiary of SAI. RFJ Auto was established in 2014 and is based in Plano, Texas. It is one of the largest privately owned automotive retail platforms in the United States (as measured by total revenue), with approximately 1,700 employees and a dealership footprint of 33 rooftops located in seven states throughout the Pacific Northwest, Midwest and Southwest. The RFJ Auto brand portfolio includes 16 automotive brands, as well as specialty pre-owned vehicle locations. It has developed a diverse product offering through an efficient omnichannel platform and includes the highest volume Chrysler Jeep dealership in the world.

During the LTM Period, RFJ Auto generated revenue of $3.2 billion, net income of $57.4 million and Adjusted EBITDA of $118.5 million. For a reconciliation of RFJ Auto’s Adjusted EBITDA to net income, which is the most directly comparable U.S. GAAP financial measure, see “Summary Historical Financial Data of RFJ Auto.”

Combination Rationale

We believe that the Acquisition strengthens our long-term growth plan by incorporating RFJ Auto’s innovative omnichannel sales strategy with the culture and growth strategy of Sonic’s franchised dealership business to create a company (“Combined Company”) that is expected to be one of the largest U.S. dealer groups by total revenue. We expect that pairing the experienced RFJ Auto management team with our demonstrated success in acquiring and integrating well-run businesses will provide us the opportunity to leverage the best practices of both businesses going forward, creating long-term growth potential.

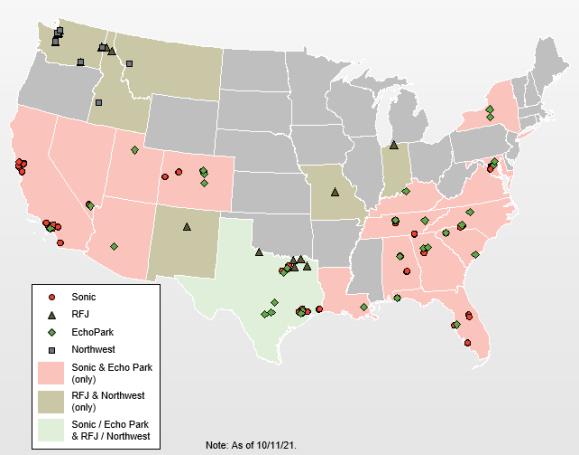
On a pro forma basis for the twelve months ended June 30, 2021, RFJ’s revenue contribution to the Combined Company would have been approximately $3.2 billion and it would have represented approximately 34% of the Combined Company’s franchised dealership revenues. Six of the seven states in the RFJ Auto footprint


1


are new markets for Sonic, strategically expanding the markets in which Sonic operates while also adding five new brands to the Sonic brand portfolio, further broadening our vehicle and service offerings to consumers. The geographic footprint covered by the 142 stores in the Combined Company is as follows.


LOGO

We believe that we can achieve meaningful run-rate synergies and operational improvements following the closing of the Acquisition, consisting of: (i) a reduction in corporate overhead costs as a result of our ability to leverage our scale to reduce costs related to purchasing certain equipment, supplies, and services through national vendor relationships; (ii) a reduction in the effective interest rate on inventory floor plan financing; and (iii) expected operational improvements primarily with respect to finance and insurance revenues and parts, service and collision repair revenues and gross margins, among other areas.

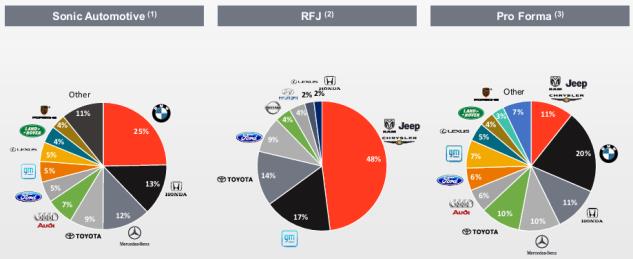
The below information demonstrates the highly complementary brand and geographic diversification benefits of the Combined Company created by the Acquisition.


2


LOGO


(1)

Based on new vehicle revenues for the LTM Period. “Other” includes Nissan, Cadillac, Hyundai, Volkswagen, MINI and other imports.


(2)

Based on new vehicle revenues for the LTM Period applied to brand mix allocations for the twelve month period ending May 31, 2021.


(3)

Pro Forma excludes Sonic acquisitions since June 30, 2021, besides the Acquisition. “Other” includes Nissan, Cadillac, Hyundai, Volkswagen, MINI and other imports.


LOGO


(1)

Based on new vehicle revenues for the LTM Period.


(2)

Based on total revenues for the LTM Period.

As a result of the way we manage our business, we had two reportable segments as of the date of this offering memorandum: (i) the Franchised Dealerships Segment and (ii) the EchoPark Segment. For management and operational reporting purposes, we group certain businesses together that share management and inventory (principally used vehicles) into “stores.” As of the date of this offering memorandum, we operated 87 stores in the Franchised Dealerships Segment and 31 stores in the EchoPark Segment. The Franchised Dealerships Segment consists of 99 new vehicle franchises (representing 22 different brands of cars and light trucks) and 14 collision repair centers in 12 states. The Franchised Dealerships Segment provides comprehensive services, including (1) sales of both new and used cars and light trucks; (2) sales of replacement parts and performance of vehicle maintenance, manufacturer warranty repairs, and paint and collision repair services (collectively, “Fixed Operations”); and (3) arrangement of extended warranties, service contracts, financing, insurance and other aftermarket products (collectively, “finance and insurance” or “F&I”) for our guests. The EchoPark Segment sells used cars and light trucks and arranges F&I product sales for our guests in pre-owned vehicle specialty retail locations. Our EchoPark business generally operates independently from our franchised dealerships business (except for certain shared back-office functions and corporate overhead costs). Sales operations for EchoPark


3


began in the fourth quarter of 2014, and, as of the date of this offering memorandum, we operated 31 EchoPark stores in 16 states.

The following charts depict Sonic’s and the Combined Company’s multiple sources of continuing operations revenue and gross profit for the LTM Period:


LOGO


4


Business Strategy

Expand Our Omni-Channel Capabilities. Automotive consumers have become increasingly more comfortable using technology to research their vehicle buying alternatives, communicate with store personnel, and complete a portion or all of a vehicle purchase online. The internet presents a marketing, advertising and sales channel that we will continue to utilize to drive value for our stores and enhance the guest experience. Our existing platforms give us the ability to leverage new technology to integrate systems, customize our dealership websites and use our data to improve the effectiveness of our advertising and interaction with our guests. These platforms also allow us to market all of our products and services to a national audience and, at the same time, support the local market penetration of our individual stores. We believe that the ongoing development of our e-commerce platform will drive incremental revenues and an improved guest experience in the future.

Focus on the Guest Experience. We focus on providing a high-quality guest experience and maintaining high levels of customer satisfaction. Our personalized sales process is designed to appeal to our guests by providing high-quality vehicles and service through a positive, “guest-centric” experience. Several manufacturers offer specific financial incentives on a per vehicle basis if certain Customer Satisfaction Index (“CSI”) levels (which vary by manufacturer) are achieved by a dealership. In addition, all manufacturers consider CSI scores in approving acquisitions or awarding new dealership open points. To keep dealership and executive management focused on customer satisfaction, we include CSI results as a component of our incentive-based compensation programs for certain groups of associates and executive management.

Train, Develop and Retain Our Teammates. We believe our teammates are the cornerstone of our business and crucial to our financial success. Our goal is to develop our teammates and foster an environment where our teammates can contribute and grow with the Company. Teammate satisfaction is very important to us, and we believe a high level of teammate satisfaction reduces turnover and enhances our guests’ experience at our stores by pairing our guests with well-trained support personnel. We believe that our comprehensive training of our teammates provides us with an advantage over other competitors in providing a high-quality guest experience.

Execute Our EchoPark Expansion Plan. We have developed a diversified business model by augmenting our manufacturer-franchised dealership operations with our EchoPark pre-owned vehicle specialty retail business. Sales operations for EchoPark began in the fourth quarter of 2014, and, as the date of this offering memorandum, we operated 31 EchoPark stores in 16 states. During 2020, we announced an accelerated EchoPark growth plan in which we hope to open 25 additional EchoPark stores annually from 2021 to 2025 as we build out an expected 140-plus point nationwide EchoPark distribution network by 2025 covering approximately 90% of the U.S. population. As has been previously announced, Sonic’s Board of Directors continues to work with financial and legal advisors to consider a full range of potential strategic alternatives for its EchoPark business. No timetable has been established for the completion of the review, and the review may not result in any transaction. The indentures that will govern the notes will be designed to allow Sonic to pursue such a transaction without noteholder consent and will give Sonic substantial flexibility in the use of the proceeds from such a transaction. See “Risk Factors— Risks Related to the Notes—The indentures that will govern the notes will provide us with significant flexibility to pursue a strategic transaction involving the EchoPark business and use the proceeds therefrom without noteholder consent.”

Maximize Asset Returns Through Process Execution. We have developed standardized operating processes that are documented in operating playbooks for our stores. Through the continued implementation of our operating playbooks, we believe organic growth opportunities exist by offering a more favorable buying experience to our guests and creating efficiencies in our business processes. We believe the development, refinement and implementation of these operating processes will enhance the guest experience, make us more competitive in the markets we serve and drive profit growth across each of our revenue streams. We believe that attractive acquisition opportunities continue to exist for dealership groups with the capital and experience to identify, acquire and professionally manage dealerships and we continue to evaluate these opportunities in the ordinary course.


5


Maintain Diverse Revenue Streams. We have multiple diverse revenue streams among our two operating segments. In addition to new vehicle sales, our revenue sources include used vehicle sales (including through our EchoPark segment), which we believe are less sensitive to economic cycles and seasonal influences that affect new vehicle sales. Our Fixed Operations sales carry a higher gross margin than new and used vehicle sales and, in the past, have not been as sensitive to economic conditions as new vehicle sales. We also offer guests assistance in obtaining financing and a range of automobile-related warranty, aftermarket and insurance products.

Manage Portfolio. Our long-term growth and acquisition strategy is primarily focused on large metropolitan markets that meet certain strategic criteria for population growth and vehicle registration rates, among other considerations. A majority of our franchised dealerships are either luxury or mid-line import brands. For the LTM Period, approximately 89.1% of our total new vehicle revenue was generated by luxury and mid-line import dealerships, which usually have higher operating margins, more stable Fixed Operations departments, lower associate turnover and lower inventory levels.

Increase Sales of Higher-Margin Products and Services. We continue to pursue opportunities to increase our sales of higher-margin products and services by expanding the following:

Finance, Insurance and Other Aftermarket Products. Each sale of a new or used vehicle gives us an opportunity to provide our guests with financing and insurance options and earn financing fees and insurance and other aftermarket product commissions. We also offer our guests the opportunity to purchase extended warranties, service contracts and other aftermarket products from third-party providers whereby we earn a commission for arranging the contract sale. We currently offer a wide range of non-recourse financing, leasing, other aftermarket products, extended warranties, service contracts and insurance products to our guests. We emphasize menu-selling techniques and other best practices to increase our sales of F&I products at our franchised dealerships and EchoPark stores.

Parts, Service and Collision Repair. Each of our franchised dealerships offers a fully integrated service and parts department. Manufacturers permit warranty work to be performed only at franchised dealerships such as ours. As a result, our franchised dealerships are uniquely qualified and positioned to perform work covered by manufacturer warranties on increasingly complex vehicles. We believe we can continue to grow our profitable parts and service business over the long term by increasing service capacity, investing in sophisticated equipment and well-trained technicians, using competitive variable-rate pricing structures, focusing on the guest experience, and efficiently managing our parts inventory. In addition, we believe our emphasis on selling extended service contracts and maintenance contracts associated with retail new and used vehicle sales will drive further service and parts business in our franchised dealerships as we increase the potential to retain current service and parts guests beyond the term of the standard manufacturer warranty period.

Certified Pre-Owned Vehicles. Various manufacturers provide franchised dealers the opportunity to sell certified pre-owned (“CPO”) vehicles. This certification process extends the standard manufacturer warranty on the CPO vehicle, which we believe increases our potential to retain the pre-owned purchaser as a future parts and service customer. As CPO vehicles can only be sold by franchised dealerships and CPO warranty work can only be performed at franchised dealerships, we believe CPO vehicles add additional sales volume and will increase our Fixed Operations business over the long term.

The Transactions

Acquisition of RFJ Auto

The purchase price payable pursuant to the Merger Agreement is expected to be approximately $965.7 million, comprising (i) approximately $576.1 million for goodwill and other intangible assets, (ii) plus approximately $136.5 million for property and equipment including real estate assets, (iii) plus approximately $271.5 million for inventory, (iv) plus approximately $67.0 million for accounts receivable, (v) minus approximately $85.4 million related to liabilities assumed net of other miscellaneous assets. The value, and therefore the resulting purchase price, of RFJ Auto’s parts and accessories inventory, supplies, repair work-in-process and new and used vehicle inventories and other assets acquired or liabilities assumed by Sonic are all subject to change based on natural fluctuations in the business of RFJ Auto prior to the closing of the Acquisition and the foregoing amounts are management’s best estimate as of the date hereof.


6


The Merger Agreement contains customary representations, warranties and covenants by SAI, RFJ Auto and the other parties thereto. The consummation of the Acquisition is subject to various closing conditions, including, among other things, (i) the expiration or termination of all applicable waiting periods under the Hart-Scott-Rodino Antitrust Improvements Act of 1976, as amended (the “HSR Act”), and (ii) the consent to or the approval of the transactions contemplated by the Merger Agreement by each Manufacturer (as defined in the Merger Agreement) whose consent or approval is required. The Merger Agreement may be terminated under certain circumstances, including by Sonic or RFJ Auto if the closing of the Acquisition does not occur on or before 5:00 p.m., Eastern Time, on December 15, 2021, unless such party’s breach of the Merger Agreement has prevented the consummation of the Acquisition by such time.

Redemption of 6.125% Notes

On October 13, 2021, Sonic issued a notice to redeem the entire $250.0 million aggregate principal amount of the Company’s outstanding 6.125% Notes, with such redemption scheduled to occur on October 28, 2021. The redemption of the 6.125% Notes is conditioned on the successful completion of this offering. Until we are able to apply a portion of the net proceeds of the offering to redeem the 6.125% Notes, the 6.125% Notes will remain outstanding and the net proceeds of this offering may be deposited in floor plan deposit accounts or with banks.

In this offering memorandum, we refer to the Acquisition, the additional borrowings contemplated by the “Use of Proceeds” section and the redemption of the 6.125% Notes collectively as the “Transactions.” We cannot assure you that we will complete the Acquisition or any other transaction constituting the Transactions on the terms contemplated in this offering memorandum or at all. The consummation of this offering of notes is not conditioned on the consummation of the Acquisition. If the Acquisition is not consummated, the notes will be subject to a Special Mandatory Redemption. See “Description of Notes—Special Mandatory Redemption.”

Recent Developments

Third Quarter 2021 Activity and Preliminary Results

Sonic continues to grow its business through strategic operational initiatives, acquisitions, the expansion of its EchoPark footprint, and opportunistic share repurchases. A timeline of these events subsequent to June 30, 2021 includes:


Franchised Dealerships Segment


Acquired one Audi franchise, one Subaru franchise, and two Volkswagen franchises in Colorado


EchoPark Segment


Opened five new delivery centers in Florida, Kentucky, Louisiana, Texas, and Utah


Opened one new retail hub in Nevada


Company


Repurchased approximately 0.5 million shares of Class A Common Stock for approximately $24.8 million in open-market transactions at prevailing market prices

During the third quarter ended September 30, 2021, global supply-chain disruptions continued to impact automobile production, resulting in low levels of new vehicle inventory for Sonic and the industry in general. As of September 30, 2021, Sonic had approximately 2,400 new vehicles in inventory, compared to 12,900 new vehicles in inventory as of September 30, 2020. Due to lack of available new vehicle inventory, Sonic expects to report lower new vehicle retail unit sales volume in the third quarter of 2021 compared to the second quarter of 2021. Further, as a result of low new vehicle inventory levels, average used vehicle transaction prices and retail used vehicle gross profit per unit remain elevated above normal levels. Parts, service and collision repair activities have continued to improve as pandemic-related governmental restrictions have loosened and vehicle owners have begun to return to normal driving habits. From a finance and insurance perspective, Sonic has continued to see good credit availability for car buyers and continued strength in warranty and insurance product penetration. The expense reduction measures that Sonic put in place beginning in March and April of 2020 continue to drive higher overall profitability despite new vehicle inventory-related challenges.


7


With the above considerations, based on preliminary results for the third quarter ended September 30, 2021 Sonic estimates total revenues to be in the range of $3.0 billion to $3.1 billion, net income to be in the range of $81.8 million to $85.6 million and Adjusted EBITDA to be in the range of $147.0 million to $153.0 million. Comparable figures for the fiscal quarter ended September 30, 2020 were total revenues of $2.55 billion, net income of $59.8 million and Adjusted EBITDA of $113.9 million.

The following table shows the calculation of Sonic’s Adjusted EBITDA and reconciles Adjusted EBITDA to its closest U.S. GAAP measurement, net income, for the periods presented in the table below:


     Sonic  
    

Reported
Three
Months
Ended

September 30,


Preliminary Results for the

Three Months Ending

September 30, 2021

 
     2020      Low      High  

Adjusted EBITDA

   $ 113,924      $ 147,000      $ 153,000  

Subtract: (1)


Non-floor plan interest (2)

     9,928        9,800        9,800  

Provision for income taxes

     20,620        27,000        28,500  

Depreciation & amortization (3)

     23,767        24,900        24,900  

Stock-based compensation expense

     3,153        3,700        3,700  

Long-term compensation-related charges

     —          500        500  

Asset impairment charges

     26        —          —    

Loss (gain) on franchise and real estate disposals

     (3,388      —          —    


Net income

   $ 59,818      $ 81,100      $ 85,600  


(1)

Items include both continuing operations and discontinued operations.


(2)

Includes the following, net of any amortization of debt issuance costs or net debt discount/premium included in footnote (3) below: interest expense, other, net; interest expense, non-cash, convertible debt; and interest expense/amortization, non-cash, cash flow swaps.


(3)

Includes: depreciation and amortization of property and equipment; debt issuance cost amortization; and net debt discount/premium amortization and other amortization.

Based on preliminary results for the third quarter ended September 30, 2021, RFJ Auto estimates total revenues to be in the range of $760.0 million to $800.0 million and net income to be in the range of $16.0 million to $18.0 million, which is consistent in trend with RFJ Auto’s results for the six months ended June 30, 2021.

Each of the Company’s and RFJ Auto’s closing procedures for the three months ended September 30, 2021 will not be complete, and the Company’s financial results for the three months ended September 30, 2021 will not be publicly available, until after the expected completion of the offering of the notes. The Company’s and RFJ Auto’s actual financial results could be different from these preliminary financial results, and any differences could be material due to the completion of financial closing procedures, final adjustments and other developments that may arise between now and the time the financial results for our interim period are finalized The preliminary financial information presented above has been prepared by the Company’s and RFJ Auto’s management and is based on a number of assumptions. Neither of the Company’s independent registered public accounting firm nor RFJ Auto’s independent certified public accountants has performed review procedures with respect to the summary preliminary financial information of the Company or RFJ Auto set forth herein, nor have they expressed any opinion or provided any other form of assurance on such information. The information presented above should not be considered a substitute for full unaudited quarterly financial statements, and you should not place undue reliance on these preliminary estimates. In addition, the preliminary estimated financial results set forth below are not necessarily indicative of results the Company may achieve in any future period.


8


Summary Historical and Pro Forma Financial Data and Operating Data of the Company

The following table summarizes historical financial data of Sonic and pro forma financial data of the Combined Company. The summary historical consolidated income statement data for the years ended December 31, 2020, 2019 and 2018 and the summary historical consolidated balance sheet data as of December 31, 2020 and 2019 have been derived from our audited historical consolidated financial statements, which are incorporated by reference into this offering memorandum from our Annual Report on Form 10-K for the year ended December 31, 2020. The summary historical consolidated balance sheet data as of December 31, 2018 has been derived from our audited historical consolidated financial statements as of and for the year ended December 31, 2018, which are not included in or incorporated by reference into this offering memorandum. This summary consolidated financial and operating data should be read in conjunction with “Management’s Discussion and Analysis of Financial Condition and Results of Operations” and our consolidated financial statements and the related notes thereto, which are incorporated by reference into this offering memorandum. The summary historical consolidated balance sheet data and income statement data for the six months ended June 30, 2021 and 2020 and as of June 30, 2021 have been derived from our unaudited historical interim consolidated financial statements incorporated by reference into this offering memorandum. The unaudited historical interim consolidated financial statements have been prepared on the same basis as the audited historical consolidated financial statements and, in the opinion of our management, include all adjustments (which include only normal recurring adjustments) necessary for a fair presentation of the information set forth herein. Interim financial results are not necessarily indicative of results to be expected for the full fiscal year or any future reporting period. The summary income statement data for the LTM Period has been calculated by taking our audited historical consolidated income statement for the year ended December 31, 2020, less our unaudited historical consolidated income statement data for the six months ended June 30, 2020, plus our unaudited historical consolidated income statement data for the six months ended June 30, 2021.

The summary unaudited pro forma condensed combined financial information of the Combined Company for the LTM Period and as of June 30, 2021 has been derived from the unaudited pro forma condensed combined financial statements included elsewhere in this offering memorandum. The summary unaudited pro forma condensed combined income statement data for the LTM Period has been calculated by taking the unaudited pro forma condensed combined income statement information for the year ended December 31, 2020, less the unaudited pro forma condensed combined income statement information for the six months ended June 30, 2020, plus the unaudited pro forma condensed combined income statement information for the six months ended June 30, 2021. The summary unaudited pro forma condensed combined income statement information for the LTM Period has been adjusted to give effect to the Transactions as if they occurred on January 1, 2020. The summary unaudited pro forma condensed combined balance sheet data have been adjusted to give effect to the Transactions as if they occurred as of July 1, 2020. For a further description of the pro forma adjustments, see “Unaudited Pro Forma Condensed Combined Financial Statements.”

The summary unaudited pro forma condensed combined financial information of the Combined Company is for informational purposes only and does not purport to present what our results of operations and financial condition would have been had the Acquisition actually occurred during such time period, and should not be considered representative of our future results of operations or financial position. The summary unaudited pro forma condensed combined financial information also does not reflect (1) future cost savings or run-rate synergies, restructuring or integration charges or operational improvements that are expected to result from the Acquisition, except as indicated below or (2) the impact of non-recurring items directly related to the Acquisition.

Other than as described above in respect of the pro forma financial data, we have accounted for all of our dealership acquisitions using the purchase method of accounting and, as a result, we do not include in our consolidated financial statements the results of operations of acquired dealerships prior to the date they were acquired. The summary consolidated financial and operating data provided below reflects the results of operations and financial position of each of the dealerships acquired prior to June 30, 2021 for the portions of the periods presented following the acquisition of such dealerships. As a result of the effects of our acquisitions and other potential factors in the future, the summary consolidated financial and operating data set forth below is not necessarily indicative of our results of operations and financial position in the future or the results of operations and financial position that would have resulted had such acquisitions occurred at the beginning of the periods presented below.


9


The following financial data for all periods presented reflects our classification of operating results between continuing operations and discontinued operations as of December 31, 2020, which we performed in accordance with the provisions of “Presentation of Financial Statements” in the Accounting Standards Codification and as reflected in our Annual Report on Form 10-K for the year ended December 31, 2020. Such classification of operating results between continuing operations and discontinued operations has not changed subsequent to December 31, 2020.


10


     Year Ended
December 31,
    Six Months Ended
June 30,
    Last Twelve
Months
Ended

June 30,
    Combined
Company
Pro Forma
Last Twelve
Months

Ended
June 30,
 
     2020     2019     2018     2021     2020     2021     2021  
     (Dollars in thousands)  

Income Statement Data:


Revenues:


New vehicles

   $ 4,281,223     $ 4,889,171     $ 4,974,097     $ 2,619,210     $ 1,859,492     $ 5,040,941     $ 6,946,467  

Used vehicles

     3,564,832       3,489,972       2,973,498       2,356,794       1,658,930       4,262,696       5,124,259  

Wholesale vehicles

     197,378       202,946       217,625       159,614       81,718       275,274       381,162  


Total vehicles

     8,043,433       8,582,089       8,165,220       5,135,618       3,600,140       9,578,911       12,451,888  

Parts, service and collision repair

     1,233,735       1,395,303       1,380,887       681,509       593,738       1,321,506       1,472,525  

Finance, insurance and other, net

     489,874       476,951       405,523       321,916       226,064       585,726       705,642  


Total revenues

     9,767,042       10,454,343       9,951,630       6,139,043       4,419,942       11,486,143       14,630,055  

Cost of sales

     (8,343,397     (8,933,326     (8,505,505     (5,227,342     (3,761,981     (9,808,758     (12,618,513


Gross profit

     1,423,645       1,521,017       1,446,125       911,701       657,961       1,677,385       2,011,542  

Selling, general and administrative expenses

     (1,028,666     (1,099,374     (1,145,325     (609,976     (512,515     (1,126,127     (1,340,088

Impairment charges

     (270,017     (20,768     (29,514     —         (268,833     (1,184     (2,548

Depreciation and amortization

     (91,023     (93,169     (93,623     (48,448     (44,944     (94,527     (101,264


Operating income (loss)

     33,939       307,706       177,663       253,277       (168,331     455,547     567,642  

Other income (expense):


Interest expense, floor plan

     (27,228     (48,519     (48,398     (9,441     (16,822     (19,847     (27,737

Interest expense, other, net

     (41,572     (52,953     (54,059     (20,363     (20,762     (41,173     (71,678

Other income (expense), net

     97       (6,589     106       100       100       97       (1,220


Total other income (expense)

     (68,703     (108,061     (102,351     (29,704     (37,484     (60,923     (100,635


Income (loss) from continuing operations before taxes

     (34,764     199,645       75,312       223,573       (205,815     394,624       467,007  

Provision for income taxes for continuing operations—benefit (expense)

     (15,900     (55,108     (22,922     (55,893     37,680       (109,473     (128,531


Income (loss) from continuing operations

     (50,664     144,537       52,390       167,680       (168,135     285,151       338,476  


Income (loss) from discontinued operations

     (721     (400     (740     387       (407     73       73  


Net income (loss)

   $ (51,385   $ 144,137     $ 51,650     $ 168,067     $ (168,542   $ 285,224     $ 338,549  


Other Financial Data:


Net cash provided by (used in) operating activities

   $ 281,079     $ 170,914     $ 143,675     $ (34,658   $ 227,748     $ 18,646     $ 83,657  

Adjusted Cash Flow from Operations (a)

     341,875       136,171       147,543       279,648       163,627       457,869       509,428  

Adjusted EBITDA (b)

     370,302       308,485       259,287       300,943       134,664       536,581     654,247  

EchoPark Revenue

     1,418,984       1,162,018       700,177       1,102,741       646,987       1,874,739  

EchoPark Adjusted EBITDA

     10,967       21,399       (10,608     (3,255     10,737       (3,025  

Capital Expenditures

     127,183       125,576       163,619       105,091       61,733       170,541     183,624  

Ratio of Adjusted EBITDA to interest expense, other, net (b)

     8.9x       5.8x       4.8x       14.8x       6.5x       13.0       9.1x  

Ratio of total long-term debt to Adjusted EBITDA (b)(c)

     1.9x       2.3x       3.6x       2.3x       5.3x       1.3x       2.2x  

Adjusted EBITDAR (b)

     425,797       363,642       324,055       327,828       162,325       591,300       714,380  

Margin Data:


Adjusted EBITDA Margin (b)(d)

     3.8     3.0     2.6     4.9     3.0     4.7 %     4.5

Gross Profit Margin (e)

     14.6     14.5     14.5     14.9     14.9     14.6 %     13.7

New vehicles

     5.5     4.8     4.9     7.2     4.9     6.6 %     5.9

Retail used vehicles

     3.0     4.2     4.8     2.8     3.6     2.6 %     3.6

Parts, service and collision repair

     48.2     47.9     48.3     48.6     47.5     48.7 %     48.0

Balance Sheet Data (at end of period):


Cash and cash equivalents (f)

   $ 170,313     $ 29,103     $ 5,854     $ 239,617         $ 239,617  


11


Inventories

     1,247,254        1,517,875        1,528,461        1,016,566              1,288,054  

Total assets

     3,745,993        4,071,035        3,796,807        3,656,345              4,755,875  

Notes payable-floor plan

     1,324,244        1,539,094        1,534,040        1,086,103              1,341,796  

Total long-term debt (b)

     720,067        706,886        945,083        686,393              1,413,197  

Stockholders’ equity

     814,805        944,764        823,116        946,354              936,480  

Other Operating Data:


Number of operating stores

     100        95        104        109        95           142  

New units sold

     93,281        114,131        122,717        54,860        41,615        106,526      151,475  

Used retail units sold

     159,025        162,149        139,605        96,717        77,204        178,538      207,913  


(a)

Adjusted Cash Flow from Operations is defined as Net cash provided by (used in) operating activities plus Floor plan non-trade borrowings/(repayments) in financing cash flows. The following table shows the calculation of Adjusted Cash Flow from Operations:


     Year Ended December 31,      Six Months Ended
June 30,
    Last
Twelve
Months
Ended

June 30,
     Pro Forma
Combined
Company

Last
Twelve
Months

Ended
June 30,
 
     2020      2019     2018      2021     2020     2021      2021  
     (Dollars in thousands)  

Net cash provided by (used in) operating activities

   $ 281,079      $ 170,914     $ 143,675      $ (34,685   $ 227,748     $ 18,646      $ 83,657  

Floor plan non-trade borrowings/(repayments) in financing cash flows

     60,796        (34,743     3,868        314,306       (64,121     439,223        409,982  

Adjusted cash flow from operations

   $ 341,875      $ 136,171     $ 147,543      $ 279,621     $ 163,627     $ 457,869      $ 493,639  


(b)

Adjusted EBITDA is defined as net income plus non-floor plan interest expense, income taxes, impairment charges, (gain) loss on disposal of dealerships and real estate, (gain) loss on exit of leased dealerships, (gain) loss on retirement of debt, long-term compensation expense, non-cash stock-based compensation expense, depreciation and amortization, and certain other non-recurring items, for all operations, continuing and discontinued. While Adjusted EBITDA should not be construed as a substitute for net income or as a better measure of liquidity than net cash provided by operating activities, which are determined in accordance with U.S. GAAP, it is included in our discussion of earnings to provide additional information regarding the amount of cash our business is generating with respect to our ability to meet future debt services, capital expenditures and working capital requirements. Adjusted EBITDAR is defined as Adjusted EBITDA plus rent expense. Adjusted EBITDA and Adjusted EBITDAR should not be used as indicators of our operating performance. Consistent with industry practices, Sonic’s management utilizes Adjusted EBITDA as one factor when valuing dealership operations. These measures may not be comparable to similarly titled measures reported by other companies. The following table shows the calculation of Adjusted EBITDA and Adjusted EBTIDAR and reconciles Adjusted EBITDA and Adjusted EBITDAR to net income (loss) its closest U.S. GAAP financial measure for the periods presented in the table below:


     Year Ended December 31,      Six Months Ended
June 30,
    Last
Twelve
Months
Ended

June 30,
     Pro Forma
Combined
Company

Last
Twelve
Months

Ended
June 30,
 
     2020      2019      2018      2021      2020     2021      2021  
     (Dollars in thousands)  

Adjusted EBITDAR

   $ 425,797      $ 363,642      $ 324,055      $ 327,828      $ 162,325     $ 591,300      $ 714,380  

Subtract: (1)


Rent expense

     55,495        55,157        64,768        26,885        27,661       54,719        60,133  

Adjusted EBITDA

     370,302        308,485        259,287        300,943        134,664       536,581        654,247  

Subtract: (1)


Non-floor plan interest(2)

     38,672        50,475        52,049        18,704        19,580       37,796        71,678  

Provision for income taxes

     15,619        54,954        22,645        56,022        (37,846     109,487        128,545  


12


Depreciation & amortization(3)

     93,922       95,646       96,652       50,106       46,124       97,904       101,264  

Stock-based compensation expense

     11,704       10,797       11,853       7,474       5,398       13,780       13,953  

Long-term compensation-related changes

     —         —         32,522       1,000       —         1,000       1,355  

Asset impairment charges

     270,017       20,768       29,514       —         268,833       1,184       2,548  

Loss (gain) on debt extinguishment

     —         6,690       —         —         —         —         231  

Loss (gain) on exit of leased dealerships

     —         (170     1,709       —         —         —         —    

Loss (gain) on franchise and real estate disposals

     (8,247     (74,812     (39,307     (430     1,117       (9,794     (9,815

Private equity management fees and costs

     —         —         —         —         —         —         3,828  

Acquisition related costs

     —         —         —         —         —         —         2,135  

Other

     —         —         —         —         —         —         (24


Net income (loss)

   $ (51,385   $ 144,137     $ 51,650     $ 168,067     $ (168,542   $ 285,224     $ 338,549  


Add/(subtract):


Depreciation and amortization(3)

   $ 87,571     $ 89,949     $ 93,617     $ 45,392     $ 43,462     $ 89,501   $ 101,264  

Deferred income taxes

     (33,677     (20,845     (20,606     (5,962     (60,035     20,396     20,374  

Net distributions from equity investee

     93       (101     (225     (262     465       (634     (634

Asset impairment charges

     270,017       20,768       29,514       —         268,833       1,184     2,548  

(Gain) loss on disposal of dealerships and property and equipment

     (7,298     (75,318     (43,164     (490     2,364       (10,152     (9,815

(Gain) loss on exit of leased dealerships

     —         (170     1,709       —         —         —         231  

(Gain) loss on retirement of debt

     —         6,690       —         —         —         —         —    

Other changes in assets and liabilities that relate to operations

     15,758       5,804       31,180       (241,403     141,201       (366,846     (368,860


Net cash provided by (used in) operating activities

   $ 281,079     $ 170,914     $ 143,675     $ (34,658   $ 227,748     $ 18,673   $ 83,657  


  (1)

Items include both continuing operations and discontinued operations.

  (2)

Includes the following, net of any amortization of debt issuance costs or net debt discount/premium included in footnote (3) below: interest expense, other, net; interest expense, non-cash, convertible debt; and interest expense/amortization, non-cash, cash flow swaps.

  (3)

Includes: depreciation and amortization of property and equipment; debt issuance cost amortization; and net debt discount/premium amortization and other amortization.


(c)

Long-term debt, including current portion. See our consolidated financial statements and the related notes which are incorporated by reference into this offering memorandum from our Annual Report on Form 10-K for the year ended December 31, 2020 and from our Quarterly Report on Form 10-Q for the three and six months ended June 30, 2021.


(d)

Adjusted EBITDA margin is calculated as Adjusted EBITDA (as defined above) divided by total revenues.


(e)

Gross profit margin is defined as gross profit divided by total revenues.


(f)

Cash and cash equivalents does not include cash deposited in floor plan accounts of $75,000, as of June 30, 2021, and $73,180, as of December 31, 2020, which are included in current assets in the Company’s consolidated financial statements incorporated by reference in this offering memorandum.


13


Summary Historical Financial Data and Operating Data of RFJ Auto

The following table summarizes historical consolidated financial data of RFJ Auto. The summary historical consolidated income statement data for the years ended December 31, 2020 and 2019 the summary historical consolidated balance sheet data as of December 31, 2020 and 2019 are derived from the audited historical consolidated financial statements of RFJ Auto, which are incorporated by reference into this offering memorandum from our Current Report on Form 8-K filed on October 13, 2021. The summary balance sheet data and income statement data as of and for the six months ended June 30, 2021 and 2020 have been derived from the unaudited historical interim consolidated financial statements of RFJ Auto incorporated by reference into this offering memorandum from our Current Report on Form 8-K filed on October 13, 2021. The summary income statement data for the LTM Period has been derived by taking the historical audited consolidated income statement of RFJ Auto for the year ended December 31, 2020, less the historical unaudited consolidated income statement data of RFJ Auto for the six months ended June 30, 2020, plus the historical unaudited consolidated income statement data of RFJ Auto for the six months ended June 30, 2021.

This information is only a summary and should be read in conjunction with “Special Note Regarding Non-GAAP Financial Measures,” “Risk Factors,” “Summary—The Transactions,” “Capitalization” and the audited and unaudited consolidated financial statements of RFJ Auto and the accompanying notes incorporated by reference in this offering memorandum, as well as the other financial information included herein.


     Year Ended
December 31,
    Six Months Ended
June 30,
    Last Twelve
Months

Ended
June 30,
 
     2020     2019     2021     2020     2021  
     (Dollars in thousands)  

Income Statement Data:


Sales

   $ 2,729,076     $ 2,180,143     $ 1,500,336     $ 1,130,159     $ 3,099,253  

Cost of sales

     2,551,942       2,060,065       1,382,025       1,053,584       2,880,383  


Gross profit from sales

     177,134       120,078       118,311       76,575       218,870  

Financing, insurance, service contract and other income, net

     105,516       71,110       65,893       50,233       121,176  


Gross profit

     282,650       191,188       184,204       126,808       340,046  

Expenses:


Variable selling

     70,082       48,618       45,511       32,151       83,442  

Advertising

     12,038       12,741       6,872       5,918       12,992  

Floor plan interest

     13,226       21,121       3,545       8,453       8,318  

Personnel

     62,547       49,891       37,362       29,293       70,616  

Semi-fixed

     29,872       21,386       15,863       13,147       32,588  

Fixed

     24,123       16,290       13,460       11,343       26,240  


Total expenses

     211,888       170,047       122,613       100,305       234,196  


Income from operations

     70,762       21,141       61,591       26,503       105,850  

Other Expenses:


Interest expense, other than floor plan

     8,985       8,646       4,461       4,564       8,882  

Amortization expense

     17,151       12,696       8,980       8,168       17,963  

Other expense/(income)

     279       (3,078     482       (556     1,317  


Total other expenses

     26,415       18,264       13,923       12,176       28,162  


Income before income taxes

     44,347       2,877       47,668       14,327       77,688  

Income tax expense

     11,713       2,119       12,582       4,002       20,293  


Net income

   $ 32,634     $ 758     $ 35,086     $ 10,325     $ 57,395  


Other Financial Data:


Net cash provided by (used in) operating activities

   $ 254,661     $ 10,970     $ 46,399     $ 220,287     $ 80,773  

Adjusted Operating Cash Flows (a)

     71,807       21,239       25,183       45,458       51,532  

Adjusted EBITDA (b)

     83,484       27,307       66,986       31,959       118,511  

Adjusted EBITDA Margin (c)(d)

     2.9     1.2     4.3     2.8     3.7

Adjusted EBITDAR (c)

   $ 88,530     $ 28,470     $ 69,551     $ 34,156     $ 123,925  

Balance Sheet Data (at end of period):


Cash and cash equivalents

   $ 18,389     $ 20,100     $ 35,827      


19


Inventories, net

     301,255        422,282        278,541        

Total Assets

     698,891        752,319        663,145        

Floor plan notes payable – trade

     53,578        35,541        10,431        

Other Operating Data:


New units sold

     41,232        38,130        19,467        15,171        45,528  

Used retail units sold

     28,448        19,474        16,133        14,619        29,962  


(a)

Adjusted Cash Flow from Operations is defined as Net cash provided by (used in) operating activities plus Floor plan non-trade borrowings/(repayments) in financing cash flows. The following table shows the calculation of Adjusted Cash Flow from Operations:


     Year Ended
December 31,
     Six Months Ended
June 30,
    Last
Twelve
Months
Ended

June 30,
 
     2020     2019      2021     2020     2021  
     (Dollars in thousands)  

Net cash provided by (used in) operating activities

   $ 254,661     $ 10,970      $ 46,399     $ 220,287     $ 80,773  

Floor plan non-trade borrowings/(repayments) in financing cash flows

     (182,854     10,269        (21,216     (174,829     (29,241


Adjusted cash flow from operations

   $ 71,807     $
 
 
21,239
 
 
   $ 25,183     $ 45,458     $ 51,532  


(c)

Adjusted EBITDA for RFJ Auto is defined as net income plus non-floor plan interest expense, income taxes, impairment charges, (gain) loss on disposal of dealerships and real estate, non-cash stock-based compensation expense, depreciation and amortization, and certain other non-recurring items, for all operations, continuing and discontinued. While Adjusted EBITDA for RFJ Auto should not be construed as a substitute for net income or as a better measure of liquidity than net cash provided by operating activities, which are determined in accordance with U.S. GAAP, it is included in the discussion of earnings to provide additional information regarding the amount of cash the business is generating with respect to its ability to meet future debt services, capital expenditures and working capital requirements. Adjusted EBITDAR is defined as Adjusted EBITDA plus rent expense. Adjusted EBITDA and Adjusted EBITDAR for RFJ Auto should not be used as indicators of its operating performance. These measures may not be comparable to similarly titled measures reported by other companies. The following table shows the calculation of Adjusted EBITDA and Adjusted EBITDAR for RFJ Auto and reconciles Adjusted EBITDA and Adjusted EBITDAR to its closest U.S. GAAP financial measure for the periods presented in the table below:


     Year Ended
December 31,
     Six Months Ended
June 30,
     Last
Twelve
Months
Ended

June 30,
 
     2020      2019      2021      2020      2021  
     (Dollars in thousands)  

Adjusted EBITDAR

   $ 88,530      $ 28,470      $ 69,551      $ 34,156      $ 123,925  

Subtract: (1)


Rent expense

     5,046        1,163        2,565        2,197        5,414  

Adjusted EBITDA

     83,484        27,307        66,986        31,959        118,511  

Subtract/(add):


Non-floor plan interest

     8,985        8,646        4,461        4,564        8,882  

Provision for income taxes

     11,713        2,119        12,582        4,002        20,293  

Depreciation & amortization

     23,018        17,965        11,963        11,081        23,900  

Stock-based compensation expense

     175        128        87        89        173  

Long-term compensation-related charges

     565        347        —          210        355  

Impairment

     871        232        493        —          1,364  

Loss (gain) on retirement of debt

     450      —          —          219        231  


20


Loss (gain) on franchise and real estate disposals

     (21     (3,334     —         —         (21 )) 

Private equity management fees and costs

     2,327       682       2,165       664       3,828  

Acquisition related costs (benefits)

     2,791       (236     149       805       2,135  

Other

     (24     —         —         —         (24


Net income

     32,634       758       35,086       10,325       57,395  


Add/(subtract):


Depreciation & amortization (1)

     23,018       17,695       11,963       11,081       23,900  

Deferred income taxes

     (22     (65     —         —         (22

Impairment

     871       232       493       —         1,364  

(Gain) loss on disposal of dealerships and real estate disposals

     (21     (3,334     165       (6     150  

Other changes in assets and liabilities that relate to operations

     198,181       (4,586     (1,308     198,887       (2,008


Net cash provided by (used in) operating activities

   $ 254,661     $ 10,970     $ 46,399     $ 220,287     $ 80,773  


  (1)

Includes amortization of goodwill and property and equipment.


(d)

Adjusted EBITDA margin is calculated as Adjusted EBITDA (as defined above) divided by total revenues (defined as Sales plus Financing, insurance, service contract and other income, net).


21


RISK FACTORS

This section describes some, but not all, of the risks of acquiring the notes. Before making an investment decision, you should carefully consider the risk factors described below, the risk factors included in our Annual Report on Form 10-K for the year ended December 31, 2020, which are incorporated by reference herein, and the risks described in our other filings with the SEC that are incorporated by reference herein.

Risks Related to the Acquisition

The Acquisition may not be completed within the expected timeframe, or at all, and the pendency of the Acquisition could adversely affect our business, financial condition, results of operations and cash flows.

Completion of the Acquisition is subject to the satisfaction (or waiver) of a number of conditions, many of which are beyond our control and may prevent, delay or otherwise negatively affect its completion. Such conditions include, among others, (i) the expiration or termination of all applicable waiting periods under the HSR Act and (ii) the consent to or the approval of the transactions contemplated by the Merger Agreement by each Manufacturer whose consent or approval is required. The Merger Agreement may be terminated under certain circumstances, including by Sonic or RFJ Auto if the closing of the Acquisition does not occur on or before 5:00 p.m., Eastern Time, on December 15, 2021, unless such party’s breach of the Merger Agreement has prevented the consummation of the Acquisition by such time.

The conditions to the closing of the Acquisition may not be satisfied and the Merger Agreement could be terminated. In addition, satisfying the conditions to the Acquisition may take longer, and could cost more, than we and RFJ Auto expect; in particular, we could be required to take certain actions which we would not ordinarily take in order to obtain consents that may be required under the HSR Act or any other applicable regulatory laws. The occurrence of any of these events individually or in combination may adversely affect the benefits we expect to achieve from the Acquisition and adversely affect our business, financial condition, results of operations and cash flows.

In addition, if the Acquisition does not close, the attention of our management will have been diverted to the Acquisition, rather than our operations and pursuit of other opportunities. Failure to complete the Acquisition would, and any delay in completing the Acquisition could, prevent us from realizing the anticipated benefits from the Acquisition. Additionally, if we fail to close the Acquisition and are otherwise in breach of our obligations, we could be liable for damages.

We may fail to realize the benefits of the Acquisition.

The success of the Acquisition will depend on, among other things, our ability to combine the RFJ Auto and Sonic businesses in a manner that facilitates growth opportunities and realizes anticipated cost synergies and performance improvements. Our ability to realize the expected benefits of the Acquisition is therefore subject to a number of risks and uncertainties, many of which are outside of our control. These risks and uncertainties could adversely impact our business, financial condition and operating results, and include, among other things:


our ability to retain the service of senior management and other key personnel;


our ability to preserve customer, supplier and other important relationships;


the risk that certain of our customers and suppliers will opt to discontinue business with us or exercise their right to terminate their agreements as a result of the Acquisition pursuant to change of control provisions in their agreements or otherwise; and


22


difficulties in achieving anticipated cost savings, business opportunities, and growth prospects following the Acquisition

We must successfully combine the businesses of RFJ Auto and Sonic in a manner that permits these cost synergies and performance improvements to be realized. In addition, we must achieve the anticipated synergies and improvements without adversely affecting current revenues and investments in future growth. If we are not able to successfully achieve these objectives, the anticipated benefits of the Acquisition may not be realized fully, or at all, or may take longer to realize than expected.

The failure to integrate successfully certain business and operations of RFJ Auto and Sonic in the expected time frame may adversely affect our future results.

Historically, RFJ Auto and Sonic have operated as independent companies, and they will continue to do so until the consummation of the Acquisition. Our management may face significant challenges in consolidating certain businesses and the functions of RFJ Auto and Sonic, integrating their technologies, organizations, procedures, policies and operations, addressing differences in the business cultures of the two companies and retaining key personnel. The integration may also be complex and time consuming and require substantial resources and effort. The integration process and other disruptions resulting from the Acquisition may also disrupt RFJ Auto’s and Sonic’s ongoing businesses or cause inconsistencies in standards, controls, procedures and policies that adversely affect our relationships with manufacturers, employees, suppliers, customers and others with whom RFJ Auto and Sonic have business or other dealings or limit our ability to achieve the anticipated benefits of the Acquisition. In addition, difficulties in integrating the businesses or regulatory functions of RFJ Auto and Sonic could harm our reputation.

Combining the business of RFJ Auto and Sonic may be more difficult, costly or time consuming than expected, which may adversely affect our results.

We have entered into the Merger Agreement because we believe that the Acquisition will be beneficial to us and our stockholders and that combining the businesses of RFJ Auto and Sonic will produce cost synergies and performance improvements. If we are not able to successfully combine the businesses of RFJ Auto and Sonic in an efficient, effective and timely manner, the anticipated synergies and improvements of the Acquisition may not be realized fully, or at all, or may take longer to realize than expected, and our cash flow and financial condition may be negatively affected.

An inability to realize the full extent of the anticipated benefits of the Acquisition and the other transactions contemplated by the Merger Agreement, as well as any delays encountered in the integration process, could have an adverse effect upon our revenues, level of expenses and operating results.

In addition, the actual integration may result in additional and unforeseen expenses, and the anticipated benefits of the integration plan may not be realized. Actual synergies, if achieved, may be lower than what we expect and may take longer to achieve than anticipated. If we are not able to adequately address integration challenges, we may be unable to successfully integrate RFJ Auto’s and Sonic’s operations or to realize the anticipated benefits of the integration of the two businesses.

Third parties may terminate or alter existing contracts or relationships with Sonic or RFJ Auto.

Each of Sonic and RFJ Auto has contracts with customers, suppliers, vendors, landlords, licensors and other business partners which may require Sonic or RFJ Auto, as applicable, to obtain consent from these other parties in connection with the Acquisition. If these consents cannot be obtained, we may suffer a loss of potential future revenue and may lose rights that are material to our business. In addition, third parties with which we or RFJ Auto currently have relationships may terminate or otherwise reduce the scope of their relationships with either or both parties in anticipation of the Acquisition, or with us following the Acquisition. Any such disruptions could limit our ability to achieve the anticipated benefits of the Acquisition. The adverse effect of such disruptions could also be exacerbated by a delay in the completion of the Acquisition or the termination of the Merger Agreement.


23

If the Acquisition is consummated, our post-closing recourse for liabilities related to RFJ Auto is limited.

As part of the Acquisition, we will assume certain liabilities of RFJ Auto. There may be liabilities that we failed or were unable to discover in the course of performing due diligence investigations into RFJ Auto. In addition, as RFJ Auto is integrated, we may learn additional information about RFJ Auto, such as unknown or contingent liabilities or other issues relating to the operations of RFJ Auto. Any such liabilities or issues, individually or in the aggregate, could have a material adverse effect on our business, financial condition and results of operations. Under the Merger Agreement, the sellers will be liable for certain breaches of representations, warranties and covenants but our recovery may be contingent upon the aggregate damages arising out of any such breaches exceeding specified dollar thresholds and is subject to other time-based and monetary-based limitations. Accordingly, we may not be able to enforce certain claims against the sellers with respect to liabilities of RFJ Auto.

The pro forma financial information included in this offering memorandum may not be reflective of our operating results and financial condition following the Transactions.

The unaudited pro forma condensed combined financial information presented herein was not required to be prepared in compliance with Article 11 of Regulation S-X as promulgated by the SEC under the Securities Act, is for illustrative purposes only. The pro forma financial information included in this offering memorandum is derived from our and RFJ Auto’s historical audited and unaudited financial statements. We prepared the pro forma information based upon available information and assumptions and estimates that we believe are reasonable. This pro forma information may not necessarily reflect what the Combined Company’s results of operations and financial position would have been had the Transactions occurred during the periods presented or what the Combined Company’s results of operations and financial position will be in the future. For example, the financing, integration, restructuring and transaction costs related to the Acquisition could be higher or lower than currently estimated. In addition, our customers may not buy products or services from us following completion of the Transactions in the expected amounts, and, as a result, our revenue could materially decline or any anticipated increases in our revenue could be lower than expected.

Additional Risk Related to our Business

Changes in customer demand towards fuel efficient vehicles and electric vehicles, and resulting shifts by manufacturers to meet demand, could disrupt our ongoing business or have a material adverse effect on our overall business and results of operations.

Variability in customer behavior, including due to volatile fuel prices and initiatives to increase the use of fuel efficient and electric vehicles, has affected and may continue to affect purchases of new and used vehicles. Manufacturers have also announced increased production focus on the manufacture of fuel efficient and electric vehicles. The rate at which our customers will continue to demand fuel efficient and electric vehicles, as well as the ability of manufacturers to accurately predict and meet such demand, is dependent on various factors. The inability of manufacturers to produce fuel efficient and electric vehicles that meet customer demand, or our inability to maintain adequate vehicle inventories to meet demand or tailor our selling plans to meet fluctuations in demand for these vehicles, could disrupt our ongoing business or have a material adverse effect on our overall business and results of operations.

Certain fuel efficient and electric vehicles generally require less frequent or less costly maintenance and repairs than traditional combustion engine vehicles due to their mechanical features. In addition, advances in technology by manufacturers and their suppliers and their continued research and development investments with respect to fuel efficient and electric vehicles have contributed to an increase in the overall durability and efficiency of vehicles. The effects of increased adoption of fuel-efficient and electric vehicles are uncertain and may include reduced maintenance and repairs revenues, changes in manufacturer warranties and complimentary maintenance


24


programs from which we realize parts, service and collision repair revenues, and changes in the level of sales or profitability of certain warranty and maintenance products we offer our customers. To the extent that the adoption of fuel efficient and electric vehicles increases rapidly or such vehicles comprise a significant percentage of new or use vehicles being sold nationwide, we may experience a disruption in our parts, service and repair revenues or revenues from certain warranty and maintenance products that we sell, any of which could have a material adverse effect on our overall business and results of operations.


25


USE OF PROCEEDS

The net proceeds to us from the sale of the notes, after deducting estimated offering expenses and the initial purchasers’ commissions and discounts, are expected to be approximately $             million. We intend to use the net proceeds from this offering, together with the additional borrowings set forth below, to (i) fund, if consummated, the Acquisition; (ii) redeem all of our outstanding 6.125% Notes pursuant to the terms of the indenture governing the 6.125% Notes; and (iii) pay related fees and expenses, with any remaining amount to be used for general corporate purposes, which may include the acquisition and development of dealerships and related real property. If the Acquisition is not consummated, we will be required to redeem the notes at par in an amount equal to the Mandatory Redemption Amount on a pro rata basis in proportion to the aggregate principal amount of the notes pursuant to a Special Mandatory Redemption as described under “Description of Notes – Special Mandatory Redemption.” For more information about the Acquisition and the retirement of the 6.125% Notes, see “Offering Memorandum Summary – The Transactions.” Pending application as set forth above, the net proceeds of this offering may be deposited in floor plan deposit accounts or with banks or invested in short term, interest bearing obligations.

The following table sets forth the estimated sources and uses of funds in connection with the Transactions. The actual sources and uses of funds may vary from the estimated sources and uses of funds in the table and accompanying footnotes set forth below.

Sources and Uses of Funds (dollars in millions)


Sources

   Amount  

Notes issued hereby

   $ 1,000.0  


Floor Plan Facilities:(2)


2021 New Vehicle Floor Plan Facility

     92.0  

2021 Used Vehicle Floor Plan Facility

     163.7  


Total Sources

   $ 1,255.7  

Uses

   Amount  

Acquisition cash purchase price:(1)

   $ 699.2  

Acquired vehicle inventory:(2)


New vehicles

     92.0  

Used vehicles

     173.7  

Redemption price for the 6.125% Notes(3)

     264.8  

Estimated fees & expenses(4)

     26.0  


Total Uses

   $ 1,255.7  


(1)

Pre-acquisition preliminary purchase price allocation presented represents the allocation of the assumed purchase price to the estimated fair market value of the net assets to be acquired, based on certain assumptions developed by management. The pre-acquisition preliminary purchase price allocation should not be viewed as a substitute for the purchase price allocation required by U.S. GAAP. Upon the consummation of the Acquisition, the actual purchase price allocation may differ from these estimates and could differ materially.

(2)

Reflects estimated borrowings under (i) the 2021 Floor Plan Facilities (as defined below) expected to be used to fund the purchase of the RFJ Auto new and used vehicle inventory, subject to actual vehicle inventories at the RFJ Auto dealerships on the closing date of the Acquisition. New and used vehicle inventories at the RFJ Auto dealerships vary significantly from time to time, and the actual value of vehicle inventories acquired will depend on the actual new and used vehicle inventories at the RFJ Auto dealerships on the closing date of the Acquisition.

(3)

On October 13, 2021, the Company issued a notice to redeem the entire $250.0 million aggregate principal amount of the Company’s outstanding 6.125% Notes with such redemption occurring on October 28, 2021. The redemption of the 6.125% Notes is conditioned on the successful completion of the offering. Until we are able to apply a portion of the net proceeds of the offering to redeem the 6.125% Notes, the 6.125% Notes will remain outstanding and the net proceeds of this offering may be deposited in floor plan deposit accounts or with banks.

(4)

Consists of our estimate of fees and expenses associated with the Transactions, including initial purchaser discounts and commissions in connection with the issuance of the notes offered hereby, and other financing fees and transaction costs, including advisory and professional fees.


21


UNAUDITED PRO FORMA CONDENSED COMBINED FINANCIAL STATEMENTS

The unaudited pro forma condensed combined financial statements (referred to as the “pro forma financial statements”) presented below are derived from the historical consolidated financial statements of the Company and RFJ Auto, as adjusted to reflect the issuance of $1.0 billion of the Notes hereby and the other Transactions. For summaries of the Transactions, see the section of this offering memorandum entitled “Summary–The Transactions.”

The unaudited pro forma condensed combined balance sheet as of June 30, 2021, assumes that the Acquisition and Financing occurred on June 30, 2021.

The unaudited pro forma condensed combined statements of income for the twelve months ended December 31, 2021 and the six months ended June 30, 2021 and June 30, 2020, assume that the Transactions occurred on January 1, 2020.

The following unaudited pro forma condensed combined financial information should be read in conjunction with the following financial statements, all of which are included in or incorporated by refence into this offering memorandum:


the audited consolidated financial statements of Sonic as of December 31, 2020 and for the three years ended December 31, 2020;


the unaudited consolidated financial statements of Sonic as of and for the six months ended June 30, 2021 and 2020;


the audited combined and consolidated financial statements of RFJ Auto as of and for the two years ended December 31, 2020;


the unaudited combined and consolidated financial statements of RFJ Auto as of and for the six months ended June 30, 2021; and


the unaudited condensed combined and consolidated financial statements of RFJ Auto as of and for the six months ended June 30, 2020.

The consummation of the Transactions is subject to the satisfaction of customary closing conditions, including the absence of a material adverse change in RFJ Auto and the receipt of competition clearances in certain jurisdictions. If the Acquisition is consummated, our post-closing recourse is limited. See “Risk Factors—Risks Related to the Acquisition—If the Acquisition is consummated, our post-closing recourse for liabilities related to RFJ is limited.”

The pro forma adjustments reported in these financial statements are based upon available information and certain assumptions that the Company’s management believes are reasonable. The unaudited pro forma condensed combined financial information of the Combined Company is presented for informational purposes only and is not intended to represent or be indicative of what the results of operations or financial condition would have been had the Transactions actually occurred on the dates indicated, nor is it meant to be indicative of future results of operations or financial condition for any future period or as of any future date. The unaudited pro forma condensed combined financial information of the Combined Company should be read in conjunction with “Summary—The Transactions,” “Risk Factors,” “Use of Proceeds,” “Summary— Summary Historical Consolidated Financial Information of Sonic and Unaudited Pro Forma Condensed Combined Financial Information of the Combined Company,” “Summary—Summary Historical Combined Financial Information of RFJ Auto,” “Management’s Discussion and Analysis of Financial Condition and Results of


22


Operations of the Company,” as well as the audited and unaudited historical financial statements and related notes of the Company and RFJ Auto included in this offering memorandum. Assumptions underlying the pro forma adjustments are described in the accompanying notes, which should be read in conjunction with the unaudited pro forma condensed combined financial statements.

COMBINED COMPANY

Pro Forma Condensed Combined Balance Sheet

As of June 30, 2021

(in thousands)

(unaudited)


     Sonic      RFJ Auto
Reported
     Reclass     RFJ Auto
Reclassed
     Pro Forma
Adjustments
           Pro Forma
Combined
 

ASSETS


Current Assets:


Cash and cash equivalents

   $ 239,617      $ 35,827        $ 35,827      $ (35,827     a      $ 239,617  

Contracts in transit

     —          34,981        (34,981     —          —            —    

Receivables, net

     356,850        34,028        34,981       69,009        (2,014     b        423,845  

Inventories

     1,016,566        280,970          280,970        (9,482     b        1,288,054  

Other current assets

     106,341        2,230          2,230        (4     b        108,567  


Total current assets

     1,719,374        388,036          388,036        (47,327        2,060,083  

Property and Equipment, net

     1,177,928        120,591          120,591        15,872       c        1,314,391  

Goodwill

     223,398        91,359          91,359        484,716       c        799,473  

Other Intangible Assets, net

     68,200        62,683          62,683        (62,683     c        68,200  

Operating Right-of-Use Lease Assets

     313,941        —            —          45,807       d        359,748  

Finance Right-of-Use Lease Assets

     70,486        —            —          —            70,486  

Other Assets

     83,018        476          476        —            83,494  


Total assets

   $ 3,656,345      $ 663,145        $ 663,145      $ 436,385        $ 4,755,875  


LIABILITIES AND STOCKHOLDERS’ EQUITY


Current Liabilities:


Notes payable – floor plan—trade

   $ 32,778      $ 10,431        $ 10,431      $ —          $ 43,209  

Notes payable – floor plan – non-trade

     1,053,325        245,262          245,262        —            1,298,587  

Trade accounts payable

     146,634        31,542          31,542        (109     b        178,067  

Operating short-term lease liabilities

     40,413        —            —          2,639       d        43,052  

Finance short-term lease liabilities

     12,920        —            —          —            12,920  

Accrued interest

     7,365        —          3,711       3,711        (8,177     e f        2,899  

Other accrued liabilities

     290,686        43,766        5,526       49,292        (4,468     b        335,510  

Allowance for contingent charges

     —          9,237        (9,237     —          —            —    

Current maturities of long-term debt

     51,681        14,898          14,898        (14,898     a        51,681  


Total current liabilities

     1,635,802        355,136          355,136        (25,013        1,965,925  

Long-Term Debt

     634,712        175,155          175,155        551,649       a f        1,361,516  

Other Long-Term Liabilities

     92,974        6,558          6,558        —            99,532  

Operating Long-Term Lease Liabilities

     281,636        —            —          43,168       d        324,804  

Finance Long-Term Lease Liabilities

     64,382        —            —          —            64,382  

Deferred Income Taxes

     485        2,751          2,751        —            3,236  

Commitments and Contingencies


Stockholders’ Equity


Total Stockholders’ Equity

     946,354        123,545          123,545        (133,419     g        936,480  


Total Liabilities and Stockholders’ Equity

   $ 3,656,345      $ 663,145        $ 663,145      $ 436,385        $ 4,755,875  


23


COMBINED COMPANY

Pro Forma Condensed Statements of Income

For the Six Months Ended June 30, 2021

(in thousands, except per share amounts)

(unaudited)


     Sonic     RFJ Auto
Reported
          RFJ Auto
Reclassed
                

Pro Forma

Combined
Company

 
     For the Six
Months
Ended

June 30,
2021
    For the Six
Months
Ended

June 30,
2021
    Reclasses     For the Six
Months
Ended

June 30,
2021
    Pro Forma
Adjustments
           For the
Six Months
Ended
June 30,
2021
 

Revenues:


Revenues

   $ —       $ 1,500,336     $ (1,500,336   $ —       $ —          $ —    

New vehicles

     2,619,210         867,113       867,113       (18,848     b        3,467,475  

Used vehicles

     2,356,794         493,466       493,466       (9,399     b        2,840,861  

Wholesale vehicles

     159,614         59,919       59,919       (2,679     b        216,854  


Total vehicles

     5,135,618           1,420,498       (30,926        6,525,190  

Parts, service and collision repair

     681,509         79,838       79,838       (2,032     b        759,315  

Finance, insurance and other, net

     321,916       65,893       —         65,893       (669     b        387,140  


Total revenues

     6,139,043           1,566,229       (33,627        7,671,645  

Cost of sales:


Cost of sales

     —         (1,382,025     1,382,025       —         —            —    

New vehicles

     (2,431,319       (823,934     (823,934     17,856       b        (3,237,397

Used vehicles

     (2,291,171       (452,266     (452,266     8,781       b        (2,734,656

Wholesale vehicles

     (154,240       (58,847     (58,847     2,667       b        (210,420


Total vehicles

     (4,876,730         (1,335,047     29,304          (6,182,473

Parts, service and collision repair

     (350,612       (46,978     (46,978     1,109       b        (396,481


Total cost of sales

     (5,227,342     (1,382,025       (1,382,025     30,413          (6,578,954


Gross profit

     911,701       184,204         184,204       (3,214        1,092,691  

Total expenses

     —         (122,613     122,613       —         —            —    

Selling, general and administrative expenses

     (609,976       (115,592     (115,592     2,350       b d        (723,218

Impairment charges

     —           (493     (493     —            (493

Depreciation and amortization

     (48,448       (11,963     (11,963     8,577       b e        (51,834


Operating income (loss)

     253,277       61,591         56,156       7,713          317,146  

Other income (expense):


Interest expense, floor plan

     (9,441       (3,545     (3,545     230       b        (12,756

Interest expense, other, net

     (20,363     (4,461       (4,461     (10,789     f        (35,613

Amortization expense

       (8,980     8,980       —         —            —    


Other income (expense), net

     100       (482       (482     —            (382


Total other income (expense)

     (29,704     (13,923       (8,488     (10,559        (48,751


Income (loss) from continuing operations before taxes

     223,573       47,668         47,668       (2,846        268,395  

Provision for income taxes for continuing

operations – benefit (expense)

     (55,893     (12,582       (12,582     611       h        (67,864


Income (loss) from continuing operations

     167,680           35,086       (2,235        200,531  

Discontinued operations:


Income (loss) from discontinued operations

     516           —         —            516  

Provision for income taxes for discontinued operations – benefit (expense)

     (129         —         —            (129


Income (loss) from discontinued operations

     387           —         —            387  


Net income (loss)

   $ 168,067     $ 35,086       $ 35,086     $ (2,235      $ 200,918  


Basic earnings (loss) per common shares:


24


Earnings (loss) per share from continuing operations

   $ 4.03                                                                                          $ 4.82  

Earnings (loss) per share from discontinued operations.

     0.01                       0.01  


Earnings (loss) per common share

   $ 4.04                     $ 4.83  


Weighted Average common shares outstanding

     41,561                       41,561  

Diluted earnings (loss) per common share:


Earnings (loss) per share from continuing operations

   $ 3.86                     $ 4.61  

Earnings (loss) per share from discontinued operations.

     0.01                       0.01  


Earnings (loss) per common share

   $ 3.87                     $ 4.62  


Weighted average common shares outstanding

           43,483                             43,483  


25


COMBINED COMPANY

Pro Forma Condensed Statements of Income

For the Six Months Ended June 30, 2020

(in thousands, except per share amounts)

(unaudited)


     Sonic     RFJ Auto
Reported
          RFJ Auto
Reclassified
                

Pro Forma

Combined
Company For

 
     For the Six
Months
Ended

June 30,
2020
    For the Six
Months
Ended

June 30,
2020
    Reclasses     For the Six
Months
Ended

June 30,
2020
    Pro Forma
Adjustments
           the
Six Months
Ended
June 30,
2020
 

Revenues:


Revenue

   $ —       $ 1,130,159     $ (1,130,159   $ —       $ —          $ —    

New vehicles

     1,859,492         669,807       669,807       (20,229     b        2,509,070  

Used vehicles

     1,658,930         348,794       348,794       (8,293     b        1,999,431  

Wholesale vehicles

     81,718         44,603       44,603       (1,362     b        124,959  


Total vehicles

     3,600,140           1,063,204       (29,884        4,633,460  

Parts, service and collision repair

     593,738         66,955       66,955       (2,353     b        658,340  

Finance, insurance and other, net

     226,064       50,233       —         50,233       (544     b        275,753  


Total revenues

     4,419,942           1,180,392       (32,781        5,567,553  

Cost of sales:


Cost of sales

       (1,053,584     1,053,584       —         —            —    

New vehicles

     (1,768,690       (642,724     (642,724     19,642       b        (2,391,772

Used vehicles

     (1,599,428       (325,775     (325,775     7,931       b        (1,917,272

Wholesale vehicles

     (82,303       (46,008     (46,008     1,470       b        (126,841


Total vehicles

     (3,450,421         (1,014,507     29,043          (4,435,885

Parts, service and collision repair

     (311,560       (39,077     (39,077     1,528       b        (349,109


Total cost of sales

     (3,761,981         (1,053,584     30,571          (4,784,994


Gross profit

     657,961       126,808         126,808       (2,210        782,559  

Total expenses

       (100,305     100,305       —         —            —    

Selling, general and administrative expenses

     (512,515       (88,939     (88,939     2,549       b d        (598,905

Impairment charges

     (268,833         —         —            (268,833

Depreciation and amortization

     (44,944       (11,081     (11,081     7,773       b e        (48,252


Operating income (loss)

     (168,331     26,503         26,788       8,112          (133,431

Other income (expense):


Interest expense, floor plan

     (16,822       (8,453     (8,453     387       b        (24,888

Interest expense, other, net

     (20,762     (4,564       (4,564     (23,864     f        (49,190

Amortization expense

       (8,168     8,168           

Other income (expense), net

     100       556         556       —            656  


Total other income (expense)

     (37,484     (12,176       (12,461     (23,477        (73,422


Income (loss) from continuing operations before taxes.

     (205,815     14,327         14,327       (15,365        (206,853

Provision for income taxes for continuing

operations – benefit (expense)

     37,680       (4,002       (4,002     4,072       h        37,750  


Income (loss) from continuing operations

     (168,135     10,325         10,325       (11,293        (169,103

Discontinued operations:


Income (loss) from discontinued operations

     (573         —         —            (573


26


Provision for income taxes for discontinued operations – benefit (expense)

     166                       166  


Income (loss) from discontinued operations

     (407                     (407


Net income (loss)

   $ (168,542     10,325      $ 10,325      $ (11,293   $ (169,510


Basic earnings (loss) per common shares:


Earnings (loss) per share from continuing operations

   $ (3.93           $ (3.95

Earnings (loss) per share from discontinued operations.

     (0.01             (0.01


Earnings (loss) per common share

   $ (3.94           $ (3.96


Weighted Average common shares outstanding

     42,779               42,779  

Diluted earnings (loss) per common share:


Earnings (loss) per share from continuing operations

   $ (3.93           $ (3.95

Earnings (loss) per share from discontinued operations

     (0.01             (0.01


Earnings (loss) per common share

   $ (3.94           $ (3.96


Weighted average common shares outstanding

     42,779               42,779  


27


COMBINED COMPANY

Pro Forma Condensed Statements of Income

For the Twelve Months Ended December 31, 2020

(in thousands, except per share amounts)

(unaudited)


     Sonic     RFJ Auto
Reported
          RFJ Auto
Reclassified
                

Pro Forma

Combined

 
     For the
Twelve
Months
Ended

December 31,
2020
    For the
Twelve
Months
Ended

December 31,
2020
    Reclasses     For the
Twelve
Months
Ended

December 31,
2020
    Pro Forma
Adjustments
           Company For
the

Twelve Months
Ended
December 31,
2020
 

Revenues:


Revenue

   $ —       $ 2,729,076     $ (2,729,076   $ —       $ —          $ —    

New vehicles

     4,281,223         1,755,603       1,755,603       (48,764     b        5,988,062  

Used vehicles

     3,564,832         734,591       734,591       (16,594     b        4,282,829  

Wholesale vehicles

     197,378         96,582       96,582       (4,693     b        289,267  


Total vehicles

     8,043,433           2,586,776       (70,051        10,560,158  

Parts, service and collision repair

     1,233,735         142,300       142,300       (4,485     b        1,371,550  

Finance, insurance and other, net

     489,874       105,516       —         105,516       (1,135     b        594,255  


Total revenues

     9,767,042           2,834,592       (75,671        12,525,963  

Cost of sales:


Cost of sales

       (2,551,942     2,551,942       —         —            —    

New vehicles

     (4,047,132       (1,692,621     (1,692,621     47,500       b        (5,692,253

Used vehicles

     (3,458,834       (678,968     (678,968     15,783       b        (4,122,019

Wholesale vehicles

     (198,249       (98,183     (98,183     4,815       b        (291,617


Total vehicles

     (7,704,215         (2,469,772     68,098          (10,105,889

Parts, service and collision repair

     (639,182       (82,170     (82,170     2,688       b        (718,664


Total cost of sales

     (8,343,397     (2,551,942       (2,551,942     70,786          (10,824,553


Gross profit

     1,423,645       282,650         282,650       (4,885        1,701,410  

Total expenses

       (211,888     211,888       —         —            —    

Selling, general and administrative expenses

     (1,028,666       (191,924     (191,924     4,815      
b
d
 
 
     (1,215,775

Impairment charges

     (270,017       (871     (871     —            (270,888

Depreciation and amortization

     (91,023       (23,018     (23,018     16,359      
b
e
 
 
     (97,682


Operating income (loss)

     33,939       70,762         66,837       16,289          117,065  

Other income (expense):


Interest expense, floor plan

     (27,228       (13,226     (13,226     585       b        (39,869

Interest expense, other, net

     (41,572     (8,985     —         (8,985     (34,698     f        (85,255

Amortization expense.

       (17,151     17,151       —         —            —    

Other income (expense), net

     97       (279     —         (279     —            (182


Total other income (expense)

     (68,703     (26,415       (22,490     (34,113        (125,306


Income (loss) from continuing operations before taxes.

     (34,764     44,347         44,347       (17,824        (8,241

Provision for income taxes for continuing

operations – benefit (expense)

     (15,900     (11,713       (11,713     4,696       h        (22,917 )) 


Income (loss) from continuing operations

     (50,664     32,634         32,634       (13,128        (31,158

Discontinued operations:


Income (loss) from discontinued operations

     (1,002         —         —            (1,002

Provision for income taxes for discontinued operations – benefit (expense)

     281           —         —            281  


33


Income (loss) from discontinued operations

     (721)           —          —          (721)  


Net income (loss)

   $ (51,385)      $ 32,634      $ 32,634      $ (13,128)      $ (31,879)  


Basic earnings (loss) per common shares:


Earnings (loss) per share from continuing operations

   $ (1.19)               $ (0.73)  

Earnings (loss) per share from discontinued operations

     (0.02)                 (0.02)  


Earnings (loss) per common share

   $ (1.21)               $ (0.75)  


Weighted Average common shares outstanding

     42,483                 42,483  

Diluted earnings (loss) per common share:


Earnings (loss) per share from continuing operations

   $ (1.19)               $ (0.73)  

Earnings (loss) per share from discontinued operations

     (0.02)                 (0.02)  


Earnings (loss) per common share

   $ (1.21)               $ (0.75)  


Weighted average common shares outstanding

     42,483                 42,483  


34


1. Basis of Presentation

The unaudited pro forma condensed combined financial information includes pro forma adjustments that are (1) directly attributable to the Transactions, (2) factually supportable and (3) with respect to the unaudited pro forma condensed combined statements of income, expected to have a continuing impact on the operating results of the Combined Company.

The Acquisition is accounted for by Sonic as a business combination using the acquisition method of accounting under ASC Topic 805, Business Combinations. Under the acquisition method of accounting, the purchase price is allocated to the underlying tangible and intangible assets acquired and liabilities assumed based on their respective fair values at the date of acquisition, with any excess purchase price allocated to goodwill. To date, Sonic has estimated a preliminary allocation of the purchase price to the assets acquired and liabilities assumed in the Transactions, and upon consummation of the Transactions will complete the allocation of such purchase price as further information becomes available. The final purchase price allocation may differ from that reflected in the following unaudited pro forma condensed combined financial statements, and these differences may be material.

The unaudited pro forma condensed combined consolidated balance sheet as of June 30, 2021, assumes that the Transactions occurred on June 30, 2021. The unaudited pro forma condensed combined statements of income for the twelve months ended December 30, 2020 and the six months ended June 30, 2021 and 2020, assume that the Transactions occurred on January 1, 2020.

The pro forma adjustments reported in these financial statements are based upon available information and certain assumptions that the Company’s management believes are reasonable. The unaudited pro forma condensed combined financial information is presented for informational purposes only and is not intended to represent or be indicative of what the results of operations or financial condition would have been had the Transactions actually occurred on the dates indicated, nor is it meant to be indicative of future results of operations or financial condition for any future period or as of any future date. The unaudited pro forma condensed combined financial information of the Combined Company should be read in conjunction with “Summary—The Transactions,” “Summary—Recent Developments,” “Summary—Summary Historical Consolidated Financial Information of Sonic and Unaudited Pro Forma Condensed Combined Financial Information of the Combined Company,” “Summary—Summary Historical Combined and Consolidated Financial Information of RFJ Auto,” “Risk Factors,” “Use of Proceeds,” “Management’s Discussion and Analysis of Financial Condition and Results of Operations of the Company” as well as the audited and unaudited historical financial statements and related notes of the Company and the RFJ Auto included in this offering memorandum.

Assumptions underlying the pro forma adjustments are described in the accompanying notes, which should be read in conjunction with the unaudited pro forma condensed combined financial information.

2. Sources of Purchase Price

The Company will acquire substantially all of the assets of, and certain real property related to, RFJ Auto including goodwill and franchise rights intangible assets, real estate and leaseholds, and parts and fixed assets, and assume substantially all of the liabilities of RFJ Auto in each case subject to certain adjustments described in the Merger Agreement. We anticipate that approximately $990.9 million will be required to (i) fund the purchase consideration (including vehicle inventory that we will acquire) and (ii) pay approximately $30.0 million in estimated transaction fees and expenses related to the Acquisition. We intend to finance the Acquisition from the following sources


30


     (in millions)  

Proceeds of the notes offered hereby

   $ 1,000.0  

New Vehicle Floorplan Facility

     92.0  

Used Vehicle Floorplan Facility

     163.7  


     $ 1,255.7  


31G


3. Purchase Price Allocation

Under the acquisition method of accounting, the purchase price is allocated to the tangible and intangible assets acquired and liabilities assumed based on information currently available. The following table summarizes the allocation of the estimated purchase price based on preliminary estimates of fair value:


     (in millions)  

Accounts receivable, including contracts in transit

   $ 67.0  

Inventories

     271.5  

Other current assets

     2.2  

Property and equipment

     136.5  

Goodwill and intangible franchise assets

     576.1  

Operating lease right-of-use assets

     45.8  

Other assets

     0.5  


Total assets acquired

     1,099.6  


Trade accounts payable

     (31.4

Other accrued liabilities

     (48.1

Operating lease liabilities

     (45.8

Other long-term liabilities

     (6.6

Deferred income taxes

     (2.8


Total liabilities assumed

     (134.7


Net assets acquired

   $ 964.9  


The fair value of the property and equipment acquired is summarized below:


     Fair Value
(in millions)
     Estimated
Life
 

Land

   $ 31.7        N/A

Buildings

     89.0        20 years  

Furniture, fixtures and equipment

     15.8        3–10 years  


Total

   $ 136.5     


The final purchase price allocation will be determined once the Company has completed the detailed valuations and necessary calculations, subject to consummation of the Acquisition. New and used vehicle inventories at the RFJ Auto dealerships vary significantly from time to time, and the actual value of vehicle inventories acquired will depend on the actual new and used vehicle inventories at the RFJ Auto dealerships on the closing date of the Acquisition. If the net assets acquired, including inventory, increases significantly from the estimate of net assets acquired as of June 30, 2021, the Company intends to use borrowings under its 2021 Floor Plan Facilities and cash on hand to pay the additional purchase price of such net assets.

The estimated fair values of assets acquired and liabilities assumed were based upon preliminary analysis performed for the preparation of the pro forma financial information and are subject to the final valuations that will be completed after consummation of the Acquisition. These estimates and assumptions are subject to change within the measurement period as additional information is obtained. A decrease in the fair value of the assets acquired or liabilities assumed in the Acquisition from the preliminary valuations presented would result in a dollar-for-dollar corresponding increase in the amount of goodwill resulting from the Acquisition. In addition, if the value of the property and equipment and other intangible assets is higher than the amount included in these unaudited pro forma condensed combined financial statements, it may result in higher depreciation and amortization expense than is presented herein. Any such increases could be material, and could result in the Company’s actual future financial condition or results of operations differing materially from that presented herein. As a result, the final purchase price allocation may differ materially from the preliminary purchase price allocation.


32


4. Reclassifications

Upon consummation of the Acquisition, the accounting policies applicable to RFJ Auto will be conformed to those of the Company. The Company has identified preliminary adjustments to the presentation of the historical financial statements of RFJ Auto to those of the Company based upon currently available information and assumptions management believes to be reasonable. The following reclassifications were made in the statements of income in order to conform with the corresponding treatment for the Company’s financial reporting:


Contracts in transit of $35.0 million were reclassified to receivables, net to conform to RFJ Auto reported amounts to the Company’s presentation.


Accrued interest of $3.7 million was reclassified from other accrued liabilities to accrued interest to conform RFJ Auto reported amounts to the Company’s presentation.


Allowance for contingent charges of $9.2 million were reclassified from allowance for contingent charges to other accrued liabilities to conform RFJ Auto reported amounts to the Company’s presentation.


RFJ Auto’s revenues and cost of sales were reclassified to conform with the Company’s presentation to separately reflect revenues and cost of sales from new vehicles, used vehicles, wholesale vehicles, parts, and service and collision repair. F&I revenues was reclassified to be a separate caption within total revenues.


RFJ Auto’s total expenses were reclassified to selling, general and administrative expenses, impairment, depreciation and amortization, and interest expense, floor plan to conform with the Company’s presentation as follows:


Six Months
Ended

June 30,

     Six Months
Ended
June 30,
    

Twelve
Months

Ended

December 31,

 
     2021      2020      2020  

(in thousands)


Selling, general and administrative expenses

   $ 115,592      $ 88,939      $ 191,924  

Impairment charges

     493        —          871  

Depreciation and Amortization

     2,983        2,913        5,867  

Interest expense, floor plan

     3,545        8,453        13,226  


RFJ Auto total expenses, as presented

   $ 122,613      $ 100,305      $ 211,888  


RFJ Auto’s amortization expense was reclassified to depreciation and amortization to conform with the Company’s presentation.

Management of the Company is currently in the process of conducting a more detailed review of accounting policies used in the historical financial statements of RFJ Auto to determine if differences in accounting policies require any further reclassification to conform to the Company’s accounting policies and classifications. As a result, we may identify additional differences between the accounting policies of the two companies that, when conformed, could have a material impact on these unaudited pro forma condensed combined financial statements.


33


5. Pro forma adjustments

The pro forma adjustments set forth in the unaudited pro forma condensed combined financial information reflect the following:


  a.

RFJ Auto’s cash and cash equivalents of $35.8 million not included in the Transaction and RFJ Auto’s long-term debt $175.2 million and current maturities of long-term debt of $14.9 million that will not be assumed by the Company and is expected to be repaid by the seller with proceeds from the Transaction have been eliminated from the proforma condensed combined proforma balance sheet as of June 30, 2021.


  b.

Two RFJ Auto dealerships have been or will be divested by RFJ Auto prior to the anticipated transaction date and, therefore, have been excluded from the Merger Agreement. The financial position and results of operations of these dealerships have been eliminated from the condensed combined proforma financial statements for all periods presented.


  c.

The preliminary estimate of fair value of assets acquired and liabilities assumed, as described in Footnote 3 to the unaudited condensed combined financial statements, and the elimination of the historical intangible assets and goodwill of RFJ Auto of $91.4 million and $62.7 million, respectively.


  d.

The historical financial statements of RFJ Auto do not reflect the adoption of ASC 842, Leases. In order to conform the presentation of lease accounting, the unaudited condensed consolidated proforma financial statements reflect the right of use assets and lease liabilities for operating leases and related incremental rent expense of RFJ Auto.


  e.

Adjustment to eliminate goodwill amortization to conform with the Company’s policies.


  f.

Adjustments as a result of the additional indebtedness expected to be incurred in connection with the Acquisition of $1,000 million and related debt issuance costs of $26.0 million less the redemption of the of the Company’s 6.125% Notes of $247.2 million and related elimination of accrued interest of $4.5 million.

The resulting interest expense adjustments related to the financing transactions, including interest on incremental borrowings, amortization of estimated debt issuance costs, write-off of costs associated with the 6.125% and reductions as a result of the RFJ Auto indebtedness which were not assumed by the Company.

The impact on interest includes the following:


     Six
Months
Ended

June 30,
2021
     Six
Months
Ended
June 30,
2020
     Twelve
Months

Ended
December 31,
2020
 

(in thousands)


Premium on redemption of 6.125% notes

   $ 0      $ (13,165    $ (13,165

Elimination of interest on 6.125% notes

     7,856        7,843        15,694  

Interest on RFJ Auto debt not assumed

     4,461        4,564        8,985  


39


Interest on new borrowings

     (21,250     (21,250     (42,500

Amortization of deferred financing costs of new borrowings

     (1,856     (1,856     (3,712


Total pro forma adjustment to interest expense, other, net

   $ (10,789   $ (23,864   $ (34,698


  g.

Represents the elimination of RFJ Auto’s stockholders’ equity and the premium on redemption of the 6.125% Notes, net of tax of $9.9 million


  h.

Tax impact of applicable pro forma adjustments affecting income utilizing a fully blended rate of 25%.

The $1.3 billion of indebtedness the Company expects to incur in connection with the Transactions includes $255.7 million of borrowings under the New Vehicle Floorplan Facility and Used Vehicle Floorplan Facility and assumes an estimated interest rate of 4.25% per annum for the notes issued hereby. A change of 0.125% per annum in the assumed interest rate for the variable interest rate Financings would increase or decrease interest expense on a pro forma basis by $1.3 million.


40