
Q4 2017 Investor Presentation Exhibit 99.2
FORWARD-LOOKING STATEMENTS This presentation contains “forward-looking statements” within the meaning of the Private Securities Litigation Reform Act of 1995. These statements relate to future events, are not historical facts and are based on our current expectations and assumptions regarding our business, the economy and other future conditions. These statements can generally be identified by lead-in words such as “believe”, “expect”, “anticipate”, “intend”, “plan”, “foresee”, “may”, “will” and other similar words. Statements that describe our Company’s objectives, plans or goals are also forward-looking statements. Examples of such forward-looking information we may be discussing in this presentation include, without limitation, earnings expectations, anticipated 2018 industry new vehicle sales volume, the implementation of growth and operating strategies, including acquisitions of dealerships and properties, the development of open points and stand-alone pre-owned stores, the return of capital to stockholders, anticipated future success and impacts from the implementation of our strategic initiatives and earnings per share expectations. You are cautioned that these forward-looking statements are not guarantees of future performance, involve risks and uncertainties and actual results may differ materially from those projected in the forward-looking statements as a result of various factors. These risks and uncertainties include, without limitation, economic conditions in the markets in which we operate, new and used vehicle industry sales volume, the success of our operational strategies, the rate and timing of overall economic recovery or decline, and the risk factors described in the Company’s Annual Report on Form 10-K for the year ended December 31, 2016. These forward-looking statements, risks, uncertainties and additional factors speak only as of the date of this presentation. We undertake no obligation to update any such statements, except as required under federal securities laws and the rules and regulations of the Securities and Exchange Commission.
CONTENT COMPANY OVERVIEW FINANCIAL & OPERATIONS REVIEW OUTLOOK

COMPANY OVERVIEW
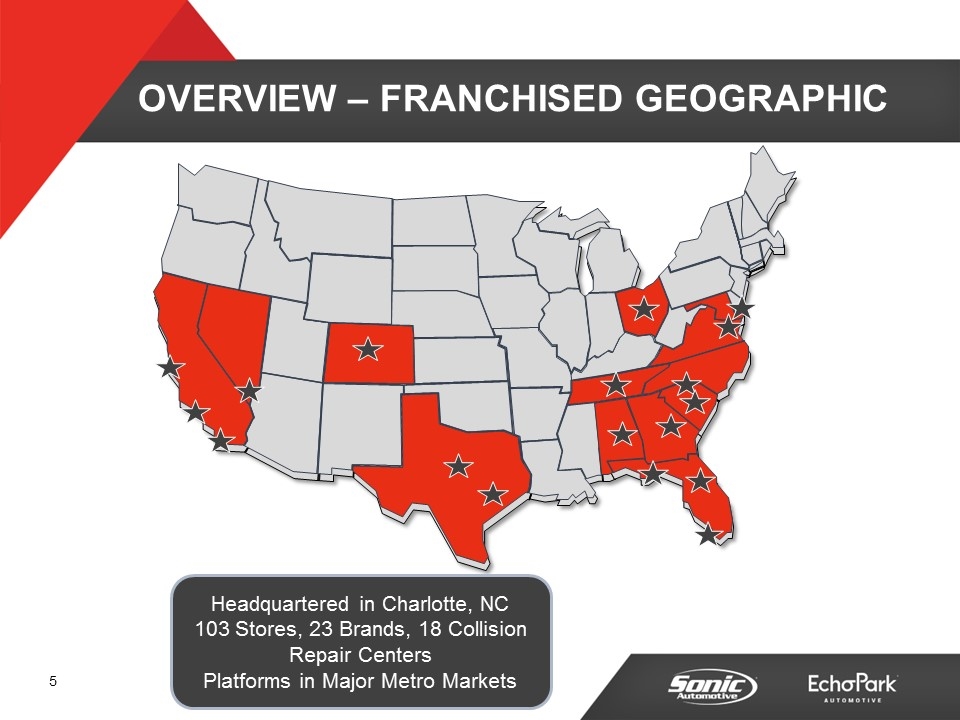
OVERVIEW – FRANCHISED GEOGRAPHIC Headquartered in Charlotte, NC 103 Stores, 23 Brands, 18 Collision Repair Centers Platforms in Major Metro Markets
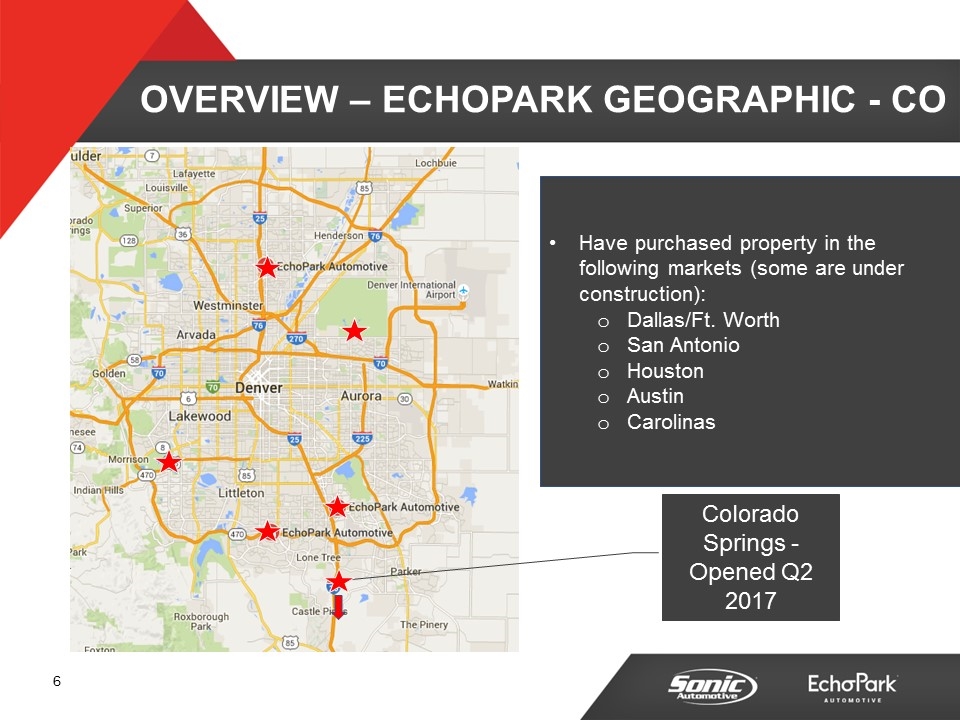
OVERVIEW – ECHOPARK GEOGRAPHIC - CO Colorado Springs - Opened Q2 2017 Have purchased property in the following markets (some are under construction): Dallas/Ft. Worth San Antonio Houston Austin Carolinas
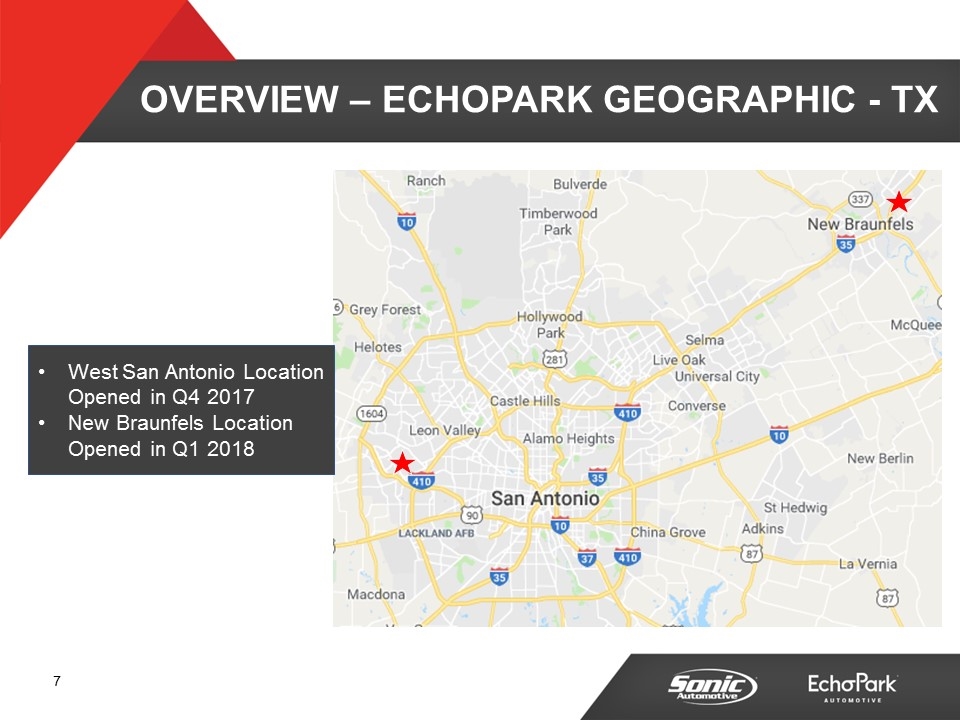
OVERVIEW – ECHOPARK GEOGRAPHIC - TX West San Antonio Location Opened in Q4 2017 New Braunfels Location Opened in Q1 2018
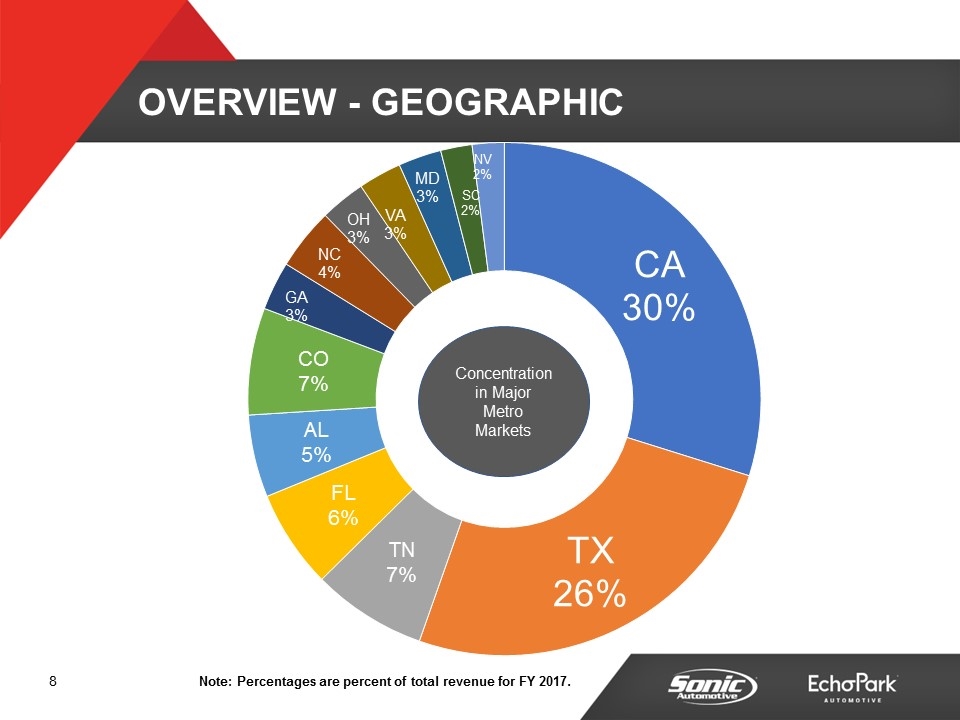
Note: Percentages are percent of total revenue for FY 2017. Concentration in Major Metro Markets
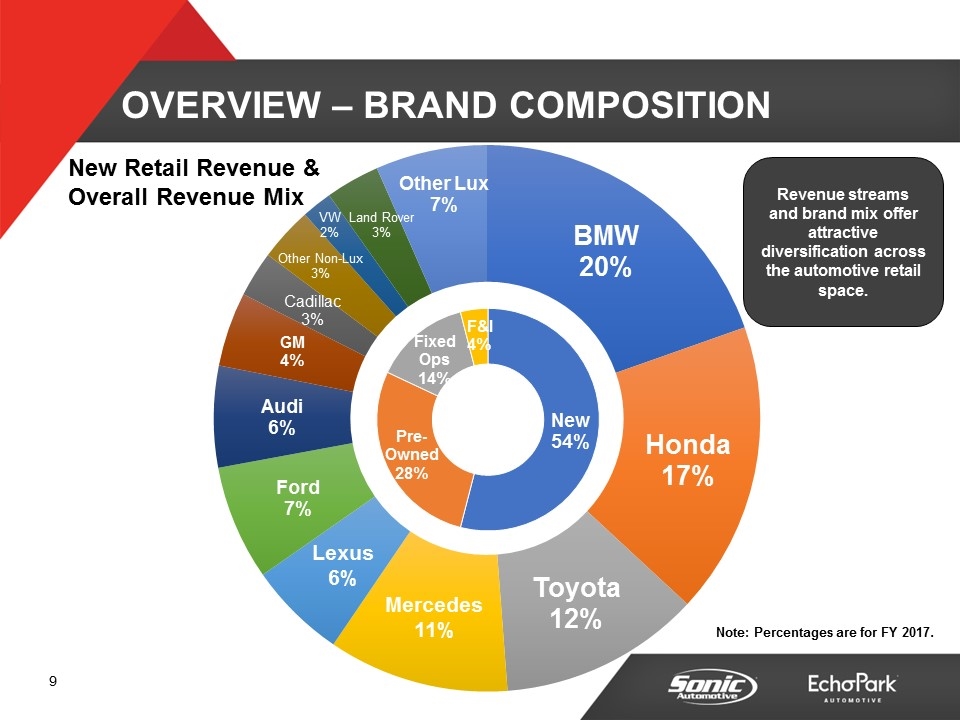
Revenue streams and brand mix offer attractive diversification across the automotive retail space. Note: Percentages are for FY 2017.
FRANCHISED SEGMENT Q4 2017 FINANCIAL REVIEW
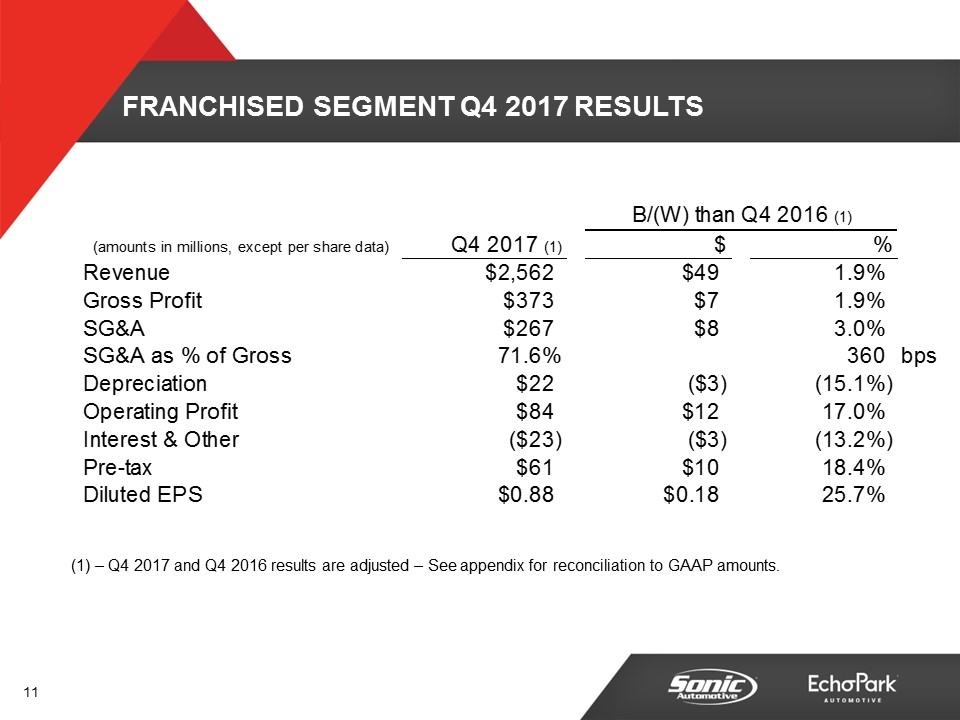
FRANCHISED SEGMENT Q4 2017 RESULTS – Q4 2017 and Q4 2016 results are adjusted – See appendix for reconciliation to GAAP amounts. B/(W) than Q4 2016 (1) (amounts in millions, except per share data) Q4 2017 (1) $ % Revenue $2,561.60804396 $48.521291280000007 1.930744779433% Gross Profit $372.60642311833698 $6.8342058041519484 1.868432177363% SG&A $266.73780734053901 $8.2053185009199652 2.984369394873% SG&A as % of Gross 0.71587012673644945 360 bps Depreciation $21.840304899999804 $-2.8596441499997018 -0.15066093787065271 Operating Profit $84.029445917788394 $12.181015195080603 0.1695376652287936 Interest & Other $-22.65100018 $-2.6435733700000017 -0.13212960342699873 Pre-tax $61.378445737790599 $9.5374418250821034 0.18397486748407779 Diluted EPS $0.88 $0.18000000000000005 0.25714285714285723 Diluted EPS Keyed $0.88 $0.18000000000000005 0.25714285714285723 CY 0.88 PY 0.7 change 0.18000000000000005 % 0.25714285714285723
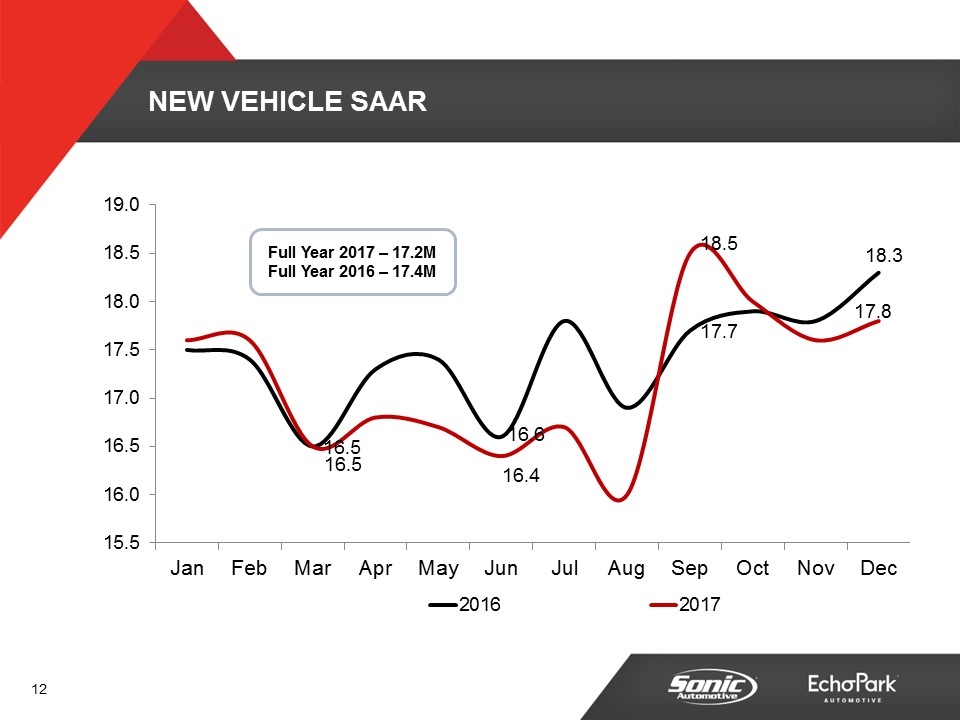
NEW VEHICLE SAAR Full Year 2017 – 17.2M Full Year 2016 – 17.4M
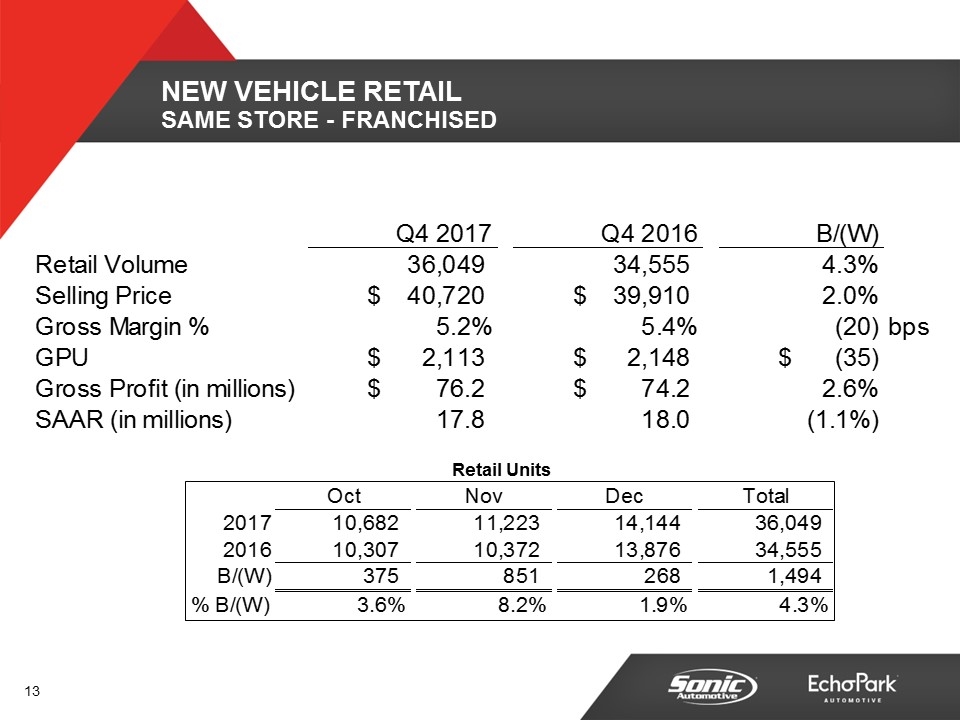
NEW VEHICLE RETAIL SAME STORE - Franchised Retail Units Oct Nov Dec Total 2017 10,682 11,223 14,144 36,049 2016 10,307 10,372 13,876 34,555 B/(W) 375 851 268 1,494 % B/(W) 3.6% 8.2% 1.9% 4.3% Q4 2017 Q4 2016 B/(W) Retail Volume 36,049 34,555 4.3235421791% Selling Price $40,720.31519320648 $39,910.233413109534 2.2904878513% Gross Margin % 5.2% 5.4% -20 bps GPU $2,112.5826954977838 $2,148.6939660975 $-35.417998468313726 Gross Profit (in millions) $76.156493589999599 $74.224163979998494 2.6033699895% SAAR (in millions) 17.8 18 -1.1111111111% SAAR - Keyed 17.8 18 -1.1% -0.19999999999999929 -1.1111111111111072E-2
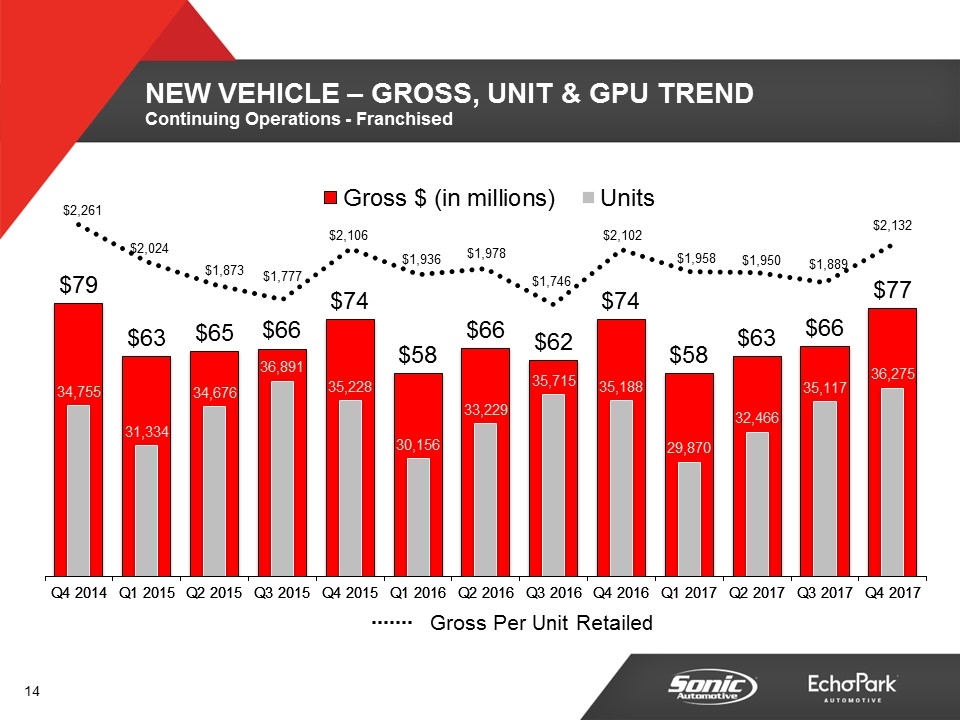
NEW VEHICLE – GROSS, UNIT & GPU TREND Continuing Operations - Franchised Gross Per Unit Retailed
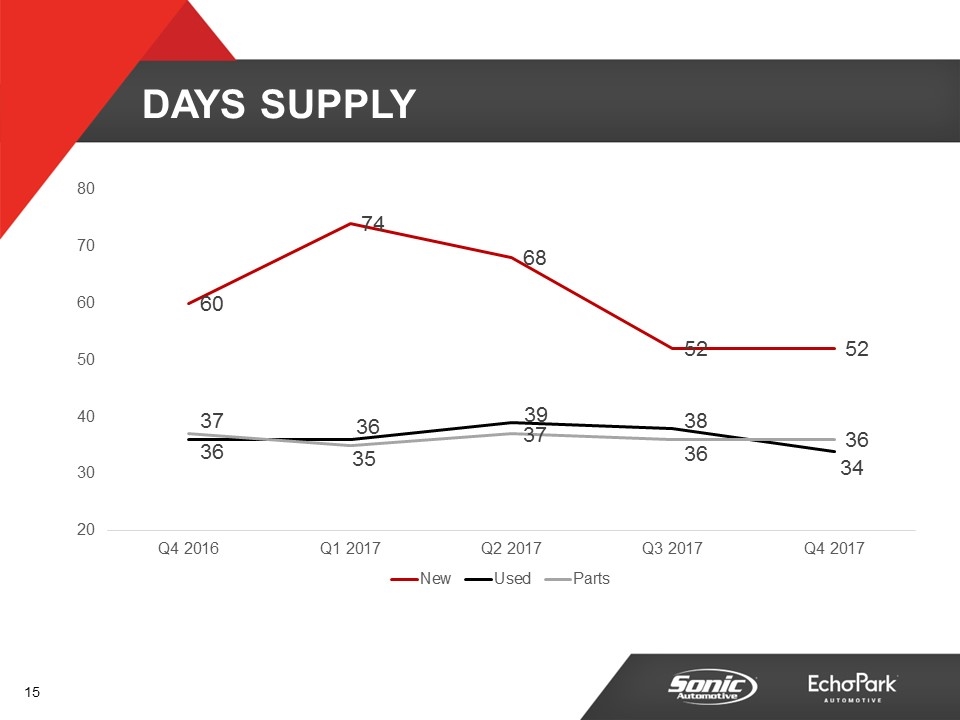
Days Supply
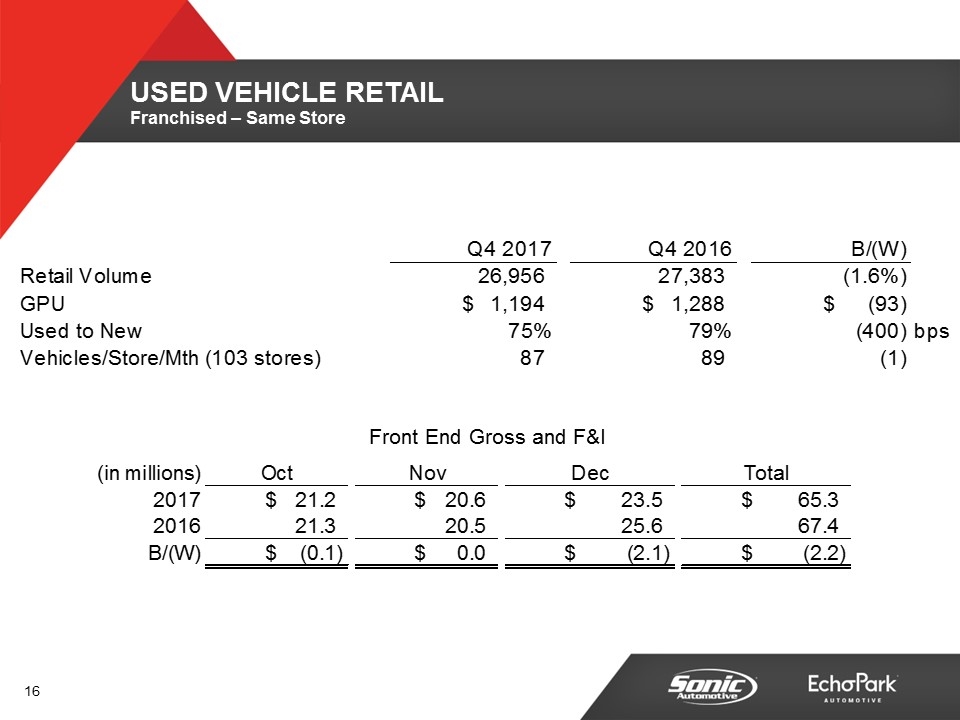
USED VEHICLE RETAIL Franchised – Same Store Front End Gross and F&I Q4 2017 Q4 2016 B/(W) Retail Volume 26,956 27,383 -1.5593616477% GPU $1,194.2215788692129 $1,287.5365679436218 $-93.314989074408913 Used to New 0.75 0.79 -,400.34 bps Vehicles/Store/Mth (103 stores) 87.236245954692563 88.618122977346275 -1.3818770226537112 Number of Stores 103 103 0.0% Vehicles/Store/Mth 87.236245954692563 88.618122977346275 (in millions) Oct Nov Dec Total 2017 $21.221464825228981 $20.579268389436109 $23.451863641313508 $65.252596855978595 2016 21.306801102979893 20.541557811146784 25.560019635334172 67.408378549460849 B/(W) $-8.5336277750911904E-2 $3.7710578289324559E-2 $-2.1081559940206631 $-2.1557816934822505
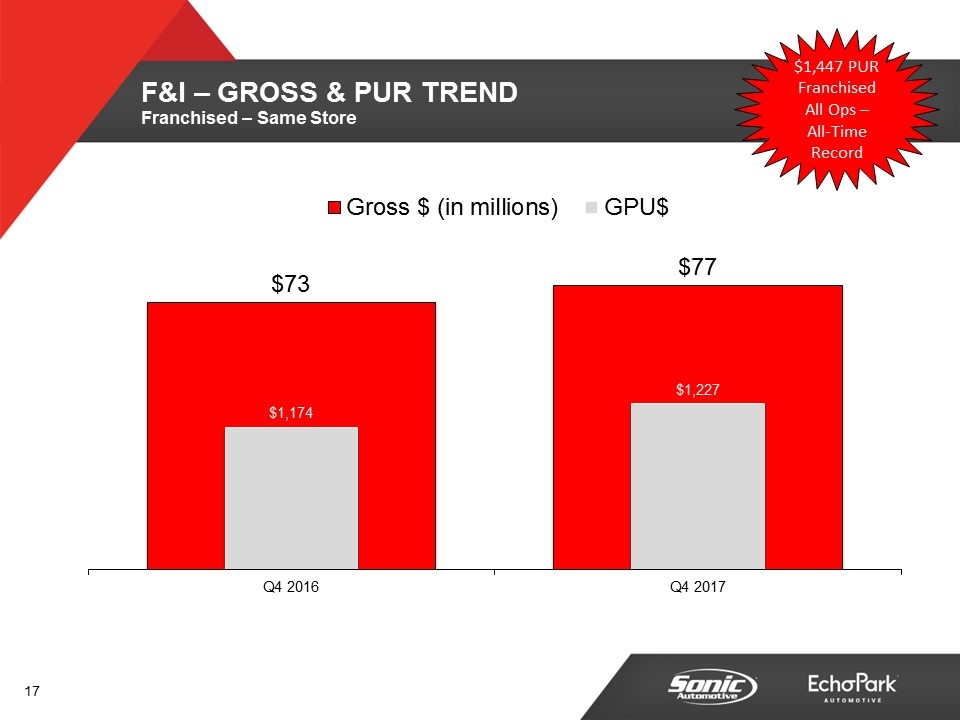
F&I – GROSS & PUR TREND Franchised – Same Store $1,447 PUR Franchised All Ops – All-Time Record
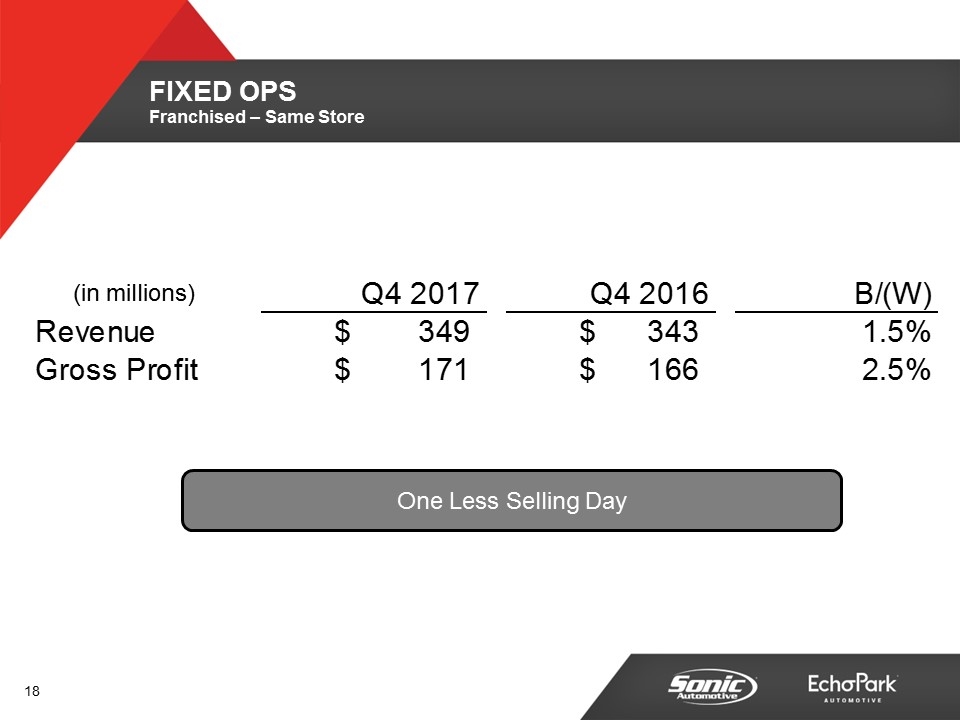
One Less Selling Day FIXED OPS Franchised – Same Store (in millions) Q4 2017 Q4 2016 B/(W) Revenue $348.60663786999902 $343.489100809999 1.4898688337% Gross Profit $170.646423910001 $166.42572632 2.5360848249%
Q4 2017 FINANCIAL REVIEW PRE-OWNED SEGMENT
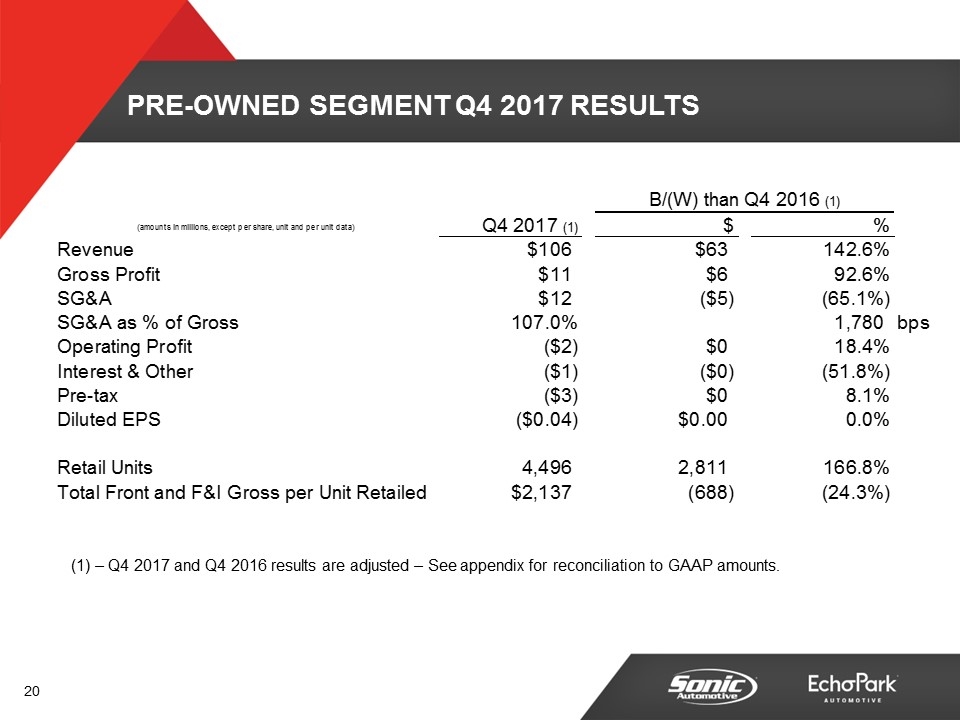
PRE-OWNED SEGMENT Q4 2017 RESULTS – Q4 2017 and Q4 2016 results are adjusted – See appendix for reconciliation to GAAP amounts. B/(W) than Q4 2016 (1) (amounts in millions, except per share, unit and per unit data) Q4 2017 (1) $ % Revenue $106.33129334 $62.505442930000008 1.4262231615644307 Gross Profit $11.48303845 $5.5207220900000102 0.92593578680887367 SG&A $12.285606119999999 $-4.8464841400000287 -0.65148604271172983 SG&A as % of Gross 1.0698915773464122 1,780 bps Operating Profit $-2.1550180800000498 $0.48511813999994002 0.18374739012517388 Interest & Other $-0.68691049999999998 $-0.23447391999999997 -0.51824704359669582 Pre-tax $-2.84192858000005 $0.25064421999992009 8.1047152714% Diluted EPS $-0.04 $0 0.0000000000% Retail Units 4,496 2,811 1.6682492581602373 Total Front and F&I Gross per Unit Retailed $2,136.8092437722485 -,687.63669094585202 -0.24345896747160889 Diluted EPS Keyed $-0.04 $0 0.0000000000% CY -0.04 PY -0.04 Change 0 % Change 0.0%
Q4 2017 FINANCIAL REVIEW TOTAL ENTERPRISE
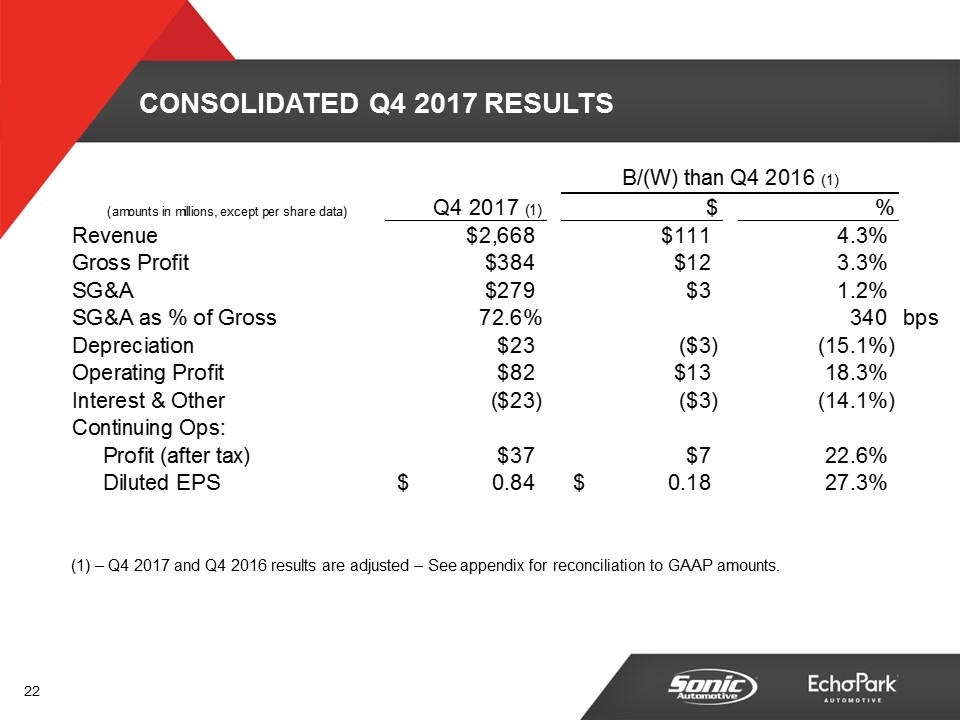
CONSOLIDATED Q4 2017 RESULTS – Q4 2017 and Q4 2016 results are adjusted – See appendix for reconciliation to GAAP amounts. B/(W) than Q4 2016 (1) (amounts in millions, except per share data) Q4 2017 (1) $ % Revenue $2,667.9393373000098 $111.0267342099999 4.342218583296% Gross Profit $384.08946156833304 $12.354927894149034 3.323588952588% SG&A $279.02341346053703 $3.3588343609209406 1.189463709859% SG&A as % of Gross 0.72645422845296215 340 bps Depreciation $23.192755789999897 $-3.0487644399997991 -0.15134857769881757 Operating Profit $81.874427837793107 $12.666133335086094 0.18301467224554527 Interest & Other $-23.33791068 $-2.8780472899999987 -0.14066796220187266 Continuing Ops: Profit (after tax) $36.569380457795994 $6.7411940350856963 0.22600080137467396 Diluted EPS $0.84 $0.17999999999999994 0.2727272727272726 KEYED CY $0.84 PY $0.66 Change $0.17999999999999994 % 0.2727272727272726
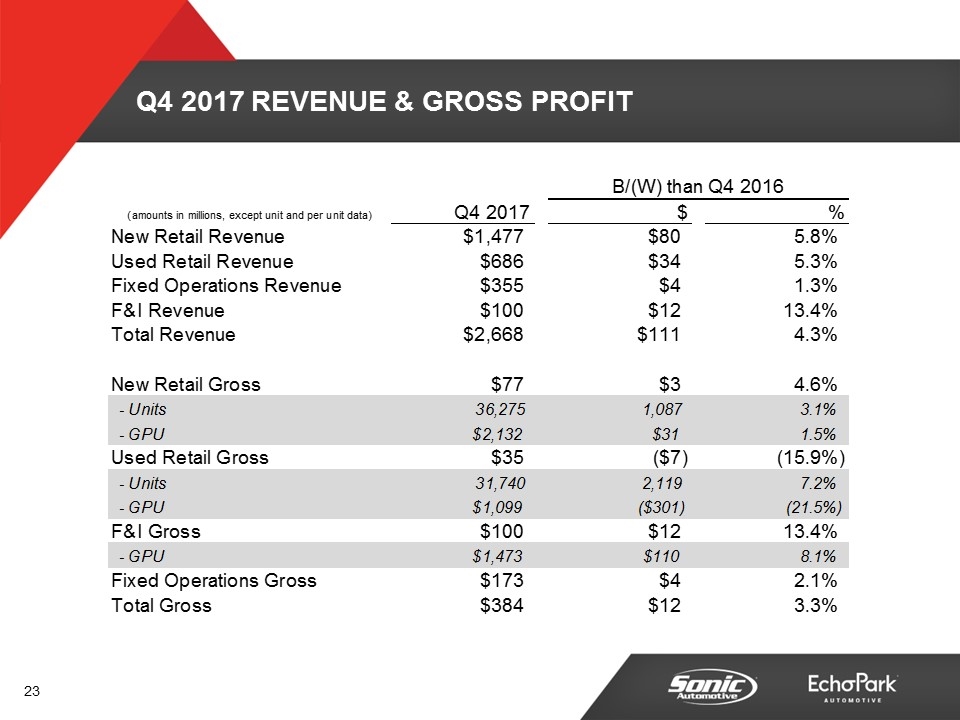
Q4 2017 REVENUE & GROSS PROFIT B/(W) than Q4 2016 (amounts in millions, except unit and per unit data) Q4 2017 $ % New Retail Revenue $1,476.84615172999 $80.432670969990085 5.759946611674% Used Retail Revenue $685.96489710999799 $34.356789239995067 5.272615368814% Fixed Operations Revenue $355.13723601999993 $4.4109807100009641 1.257670517453% F&I Revenue $100.19829759 $11.852684669999814 0.13416268536993231 Total Revenue $2,667.9393373000098 $111.0267342099999 4.342218583296% New Retail Gross $77.355403939993806 $3.4070735599947075 4.607370501114% - Units 36,275 1,087 3.891212913493% - GPU $2,132.4715076497255 $30.950239603826503 1.472754050812% Used Retail Gross $34.890724448332897 $-6.573004105833796 -0.15852419295208978 - Units 31,740 2,119 7.153708517606% - GPU $1,099.2666807918367 $-,300.54185214650761 -0.21470211466395256 F&I Gross $100.19829759 $11.852684669999814 0.13416268536993231 - GPU $1,473.1794102771448 $110.01051521627073 8.702043316032% Fixed Operations Gross $173.44690398000199 $3.5470514900019627 2.877307649286% Total Gross $384.08946156833304 $12.354927894149034 3.323588952588%
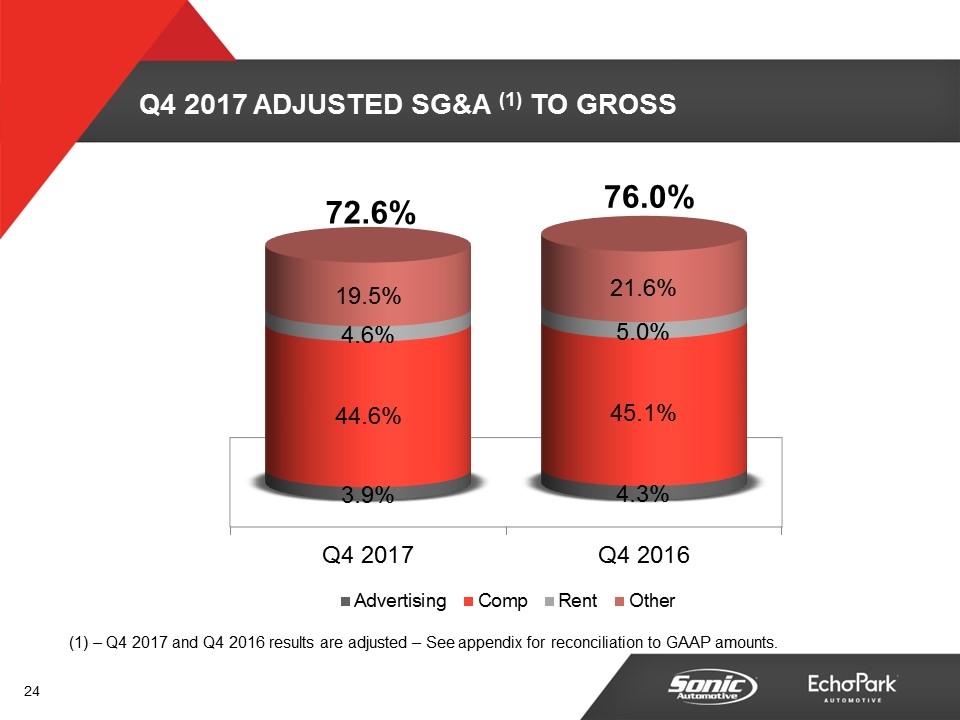
Q4 2017 ADJUSTED SG&A (1) TO GROSS 72.6% 76.0% – Q4 2017 and Q4 2016 results are adjusted – See appendix for reconciliation to GAAP amounts.
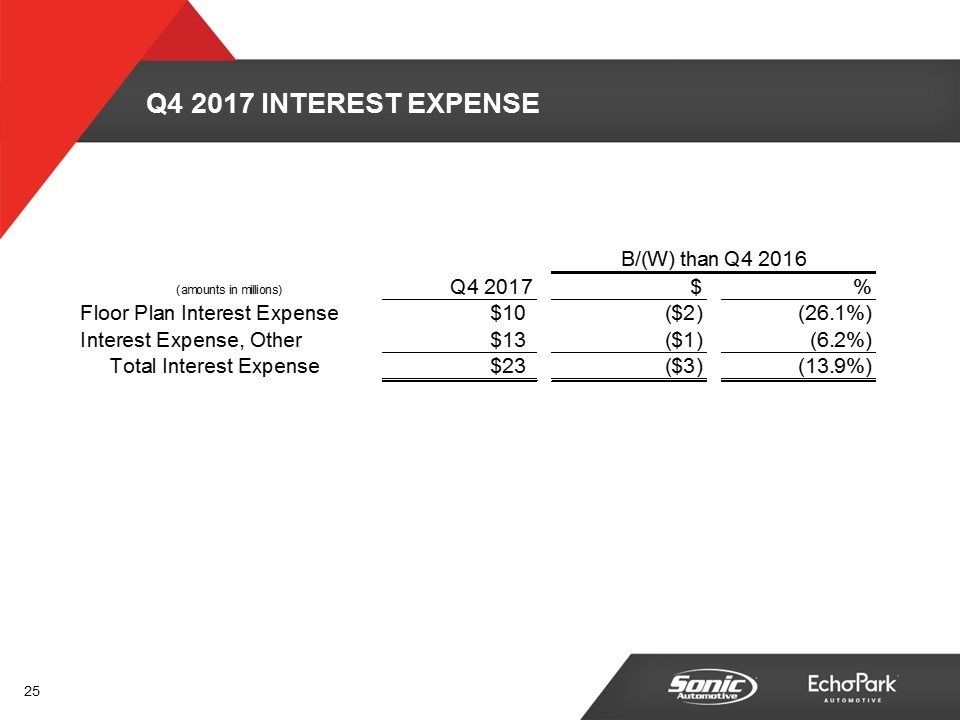
Q4 2017 INTEREST EXPENSE B/(W) than Q4 2016 (amounts in millions) Q4 2017 $ % Floor Plan Interest Expense $9.9824982899999988 $-2.06385141000001 -0.26063182779530802 Interest Expense, Other $13.32371302 $-0.77811851000000021 -6.20232472347% Total Interest Expense $23.306211309999998 $-2.8419699200000106 -0.13887492166647142

FY 2017 FINANCIAL REVIEW
FY 2017 FINANCIAL REVIEW FRANCHISED SEGMENT
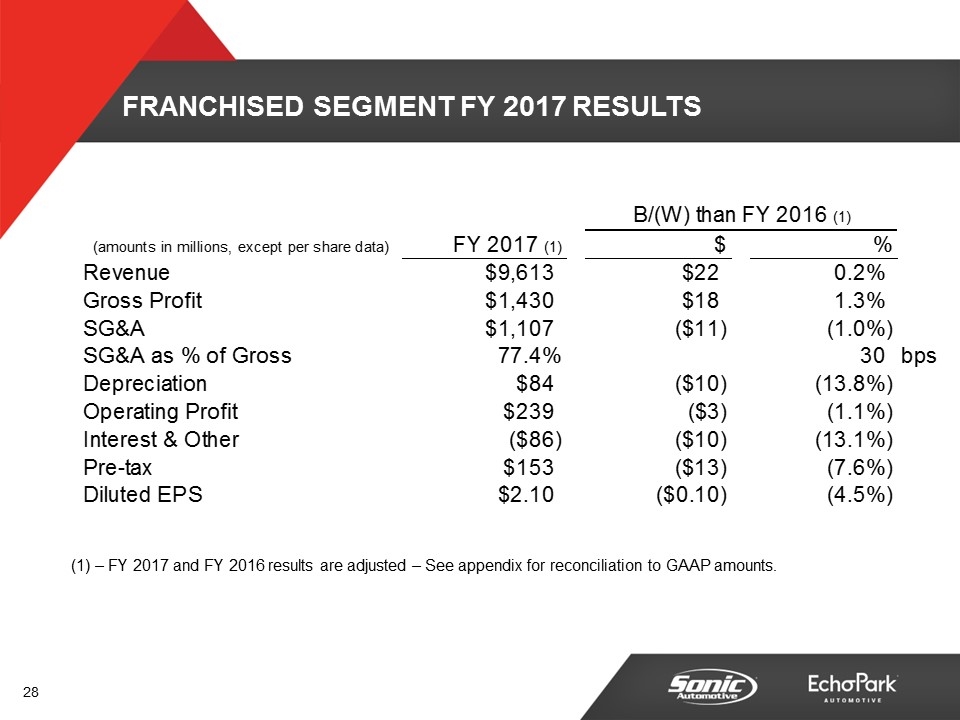
FRANCHISED SEGMENT FY 2017 RESULTS – FY 2017 and FY 2016 results are adjusted – See appendix for reconciliation to GAAP amounts. B/(W) than FY 2016 (1) (amounts in millions, except per share data) FY 2017 (1) $ % Revenue $9,612.8989921099801 $22.146659369980917 .230916810294% Gross Profit $1,429.9841177383298 $17.973696912469808 1.27291531616% SG&A $1,107.7699280054 $-10.575126149080228 -0.964442147406% SG&A as % of Gross 0.77418831374959518 30 bps Depreciation $83.740846039999909 $-10.149498259999906 -0.13791700473188298 Operating Profit $239.16627951780302 $-2.6003838865769793 -1.755758672268% Interest & Other $-85.906317559999991 $-9.9261785299999907 -0.13064175265697706 Pre-tax $153.25996195780502 $-12.526562416572997 -7.55583872926% Diluted EPS $2.1 $-0.10000000000000009 -4.545454545455% Diluted EPS Keyed $2.1 $-0.10000000000000009 -4.5454545455% CY 2.1 PY 2.2000000000000002 change -0.10000000000000009 % -4.5454545454545491E-2
FY 2017 FINANCIAL REVIEW PRE-OWNED SEGMENT
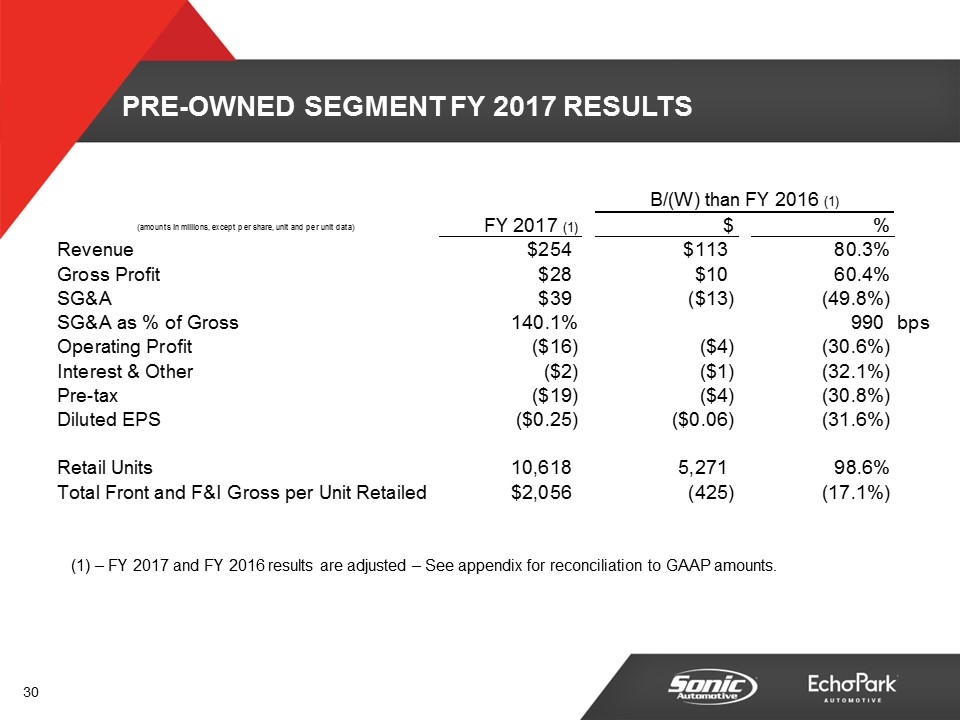
Pre-Owned SEGMENT FY 2017 RESULTS – FY 2017 and FY 2016 results are adjusted – See appendix for reconciliation to GAAP amounts. B/(W) than FY 2016 (1) (amounts in millions, except per share, unit and per unit data) FY 2017 (1) $ % Revenue $254.30946813 $113.28287451999998 0.80327313891787322 Gross Profit $27.691801920000003 $10.42815264 0.60405262357137035 SG&A $38.802895960000001 $-12.902879510000002 -0.49818035964992613 SG&A as % of Gross 1.4012412797151772 990 bps Operating Profit $-16.313818740000102 $-3.8228402000001025 -0.30604809605253736 Interest & Other $-2.2665355900000002 $-0.55031620999999997 -0.32065609817318341 Pre-tax $-18.580354330000102 $-4.3731564100000995 -0.3078127322942299 Diluted EPS $-0.25 $-0.06 -0.31578947368421051 Retail Units 10,618 5,271 0.9857864222928745 Total Front and F&I Gross per Unit Retailed $2,055.5086014315334 -,424.88048777736867 -0.17129590257667215 Diluted EPS Keyed $-0.25 $-0.06 -0.31578947368421051 CY -0.25 PY -0.19 Change -0.06 % Change -0.31578947368421051
FY 2017 FINANCIAL REVIEW TOTAL ENTERPRISE
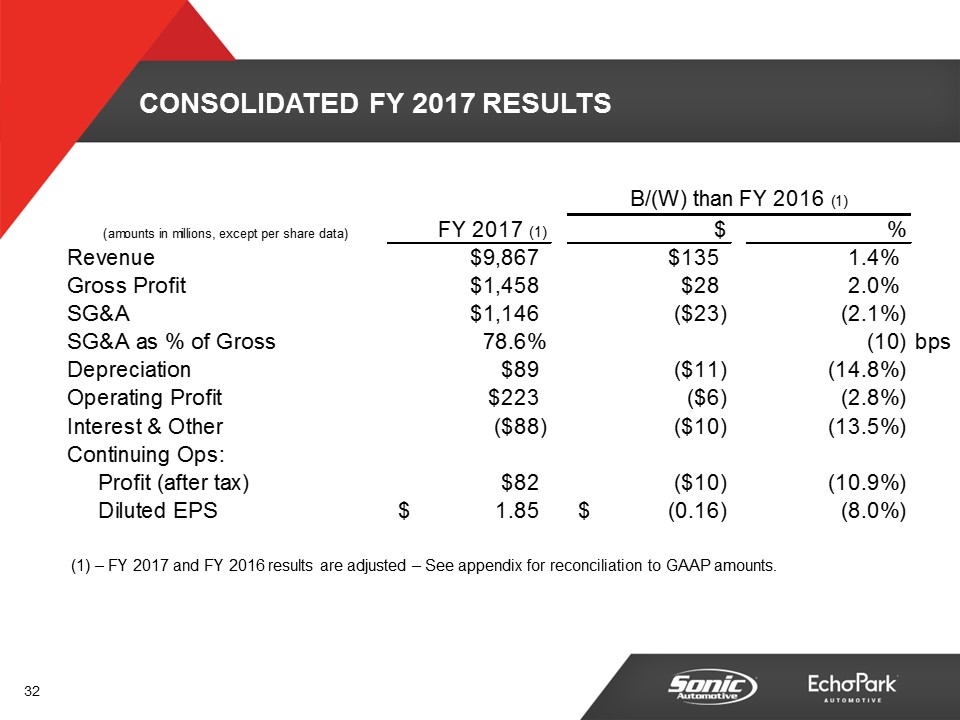
CONSOLIDATED FY 2017 RESULTS – FY 2017 and FY 2016 results are adjusted – See appendix for reconciliation to GAAP amounts. B/(W) than FY 2016 (1) (amounts in millions, except per share data) FY 2017 (1) $ % Revenue $9,867.20846023999 $135.42953388997913 1.391621561843% Gross Profit $1,457.67591965833 $28.401849552480037 1.987152089758% SG&A $1,145.8798887605299 $-23.478005659069865 -2.917646355149% SG&A as % of Gross 0.78610058196551458 -10 bps Depreciation $88.943571540000008 $-11.497612389999908 -0.14845981012038242 Operating Profit $222.85246077780801 $-6.4232240865719792 -2.801528688213% Interest & Other $-88.172853150000009 $-10.476494740000009 -0.13483894167492436 Continuing Ops: Profit (after tax) $82.229652707807702 $-10.047099546574696 -0.10888007326999895 Diluted EPS $1.85 $-0.1599999999999997 -7.960199004975% KEYED CY $1.85 PY $2.0099999999999998 Change $-0.1599999999999997 % -7.9601990049751103
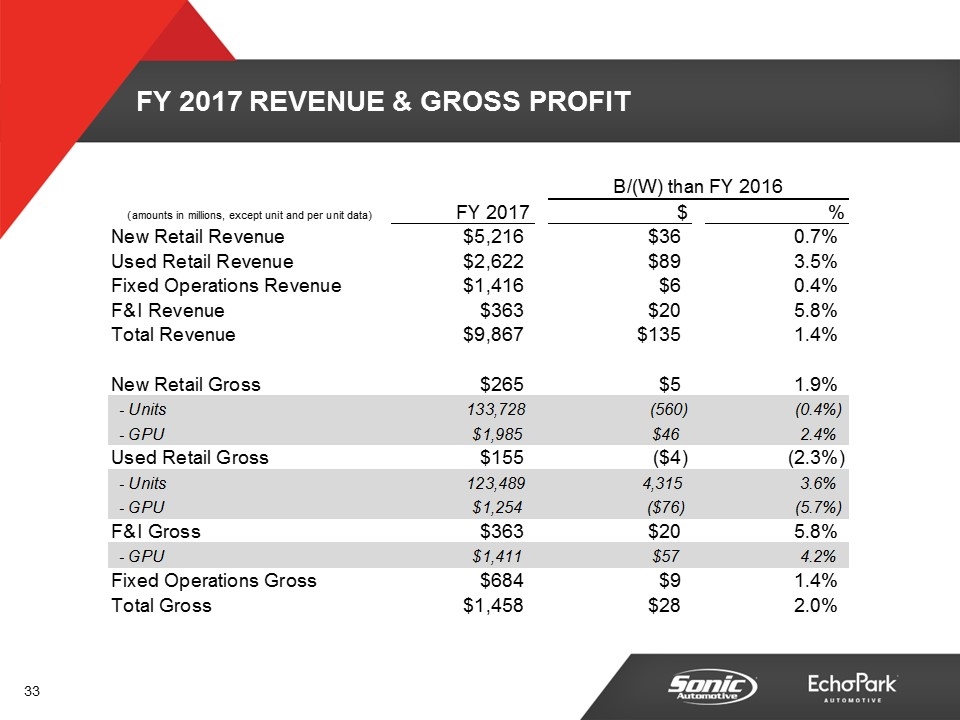
FY 2017 REVENUE & GROSS PROFIT B/(W) than FY 2016 (amounts in millions, except unit and per unit data) FY 2017 $ % New Retail Revenue $5,216.4861895699905 $35.951100989989939 .693965012789% Used Retail Revenue $2,622.526565300001 $88.930190919999959 3.510694493745% Fixed Operations Revenue $1,416.1048012 $6.1912165399999362 .439149662651% F&I Revenue $363.02995713000001 $19.744801819999992 5.751720257804% Total Revenue $9,867.20846023999 $135.42953388997913 1.391621561843% New Retail Gross $265.47885605999699 $5.0657232299969763 1.945264117422% - Units ,133,728 -,560 -0.417014178482% - GPU $1,985.2151835067973 $46.001457559579194 2.372170583576% Used Retail Gross $154.902531368333 $-3.6821707775009855 -2.321895320089% - Units ,123,489 4,315 3.620756205213% - GPU $1,254.3832354973561 $-76.315592651686529 -5.735001116507% F&I Gross $363.02995713000001 $19.744801819999992 5.751720257804% - GPU $1,411.3762198066224 $56.991123381911848 4.207896523105% Fixed Operations Gross $683.5317802400009 $9.4061568700008795 1.395312170895% Total Gross $1,457.67591965833 $28.401849552480037 1.987152089758%
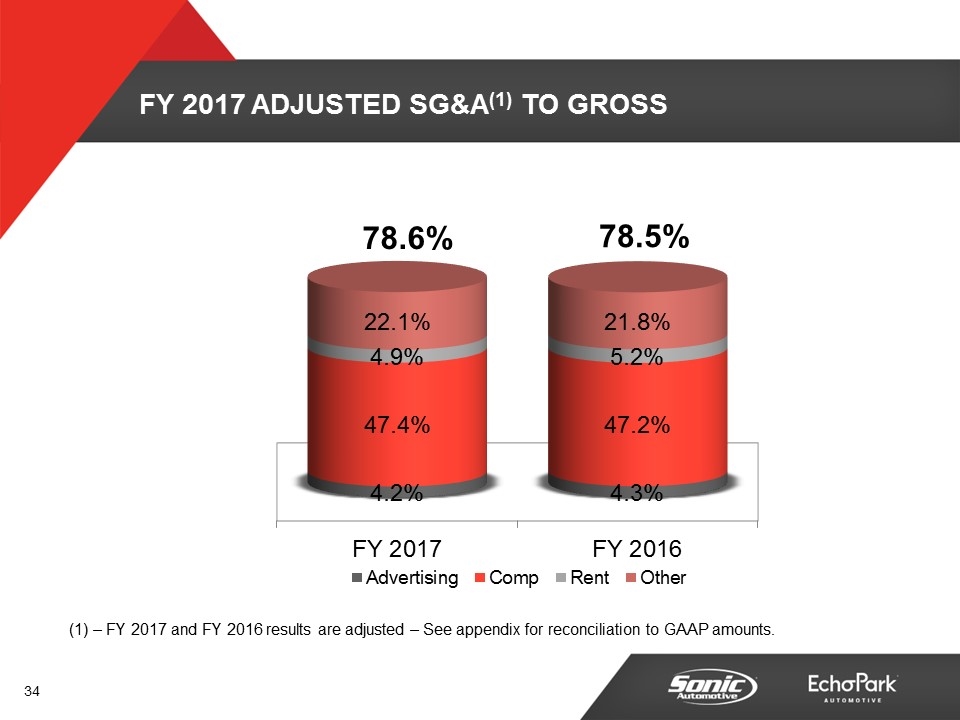
FY 2017 ADJUSTED SG&A(1) TO GROSS 78.6% 78.5% – FY 2017 and FY 2016 results are adjusted – See appendix for reconciliation to GAAP amounts.
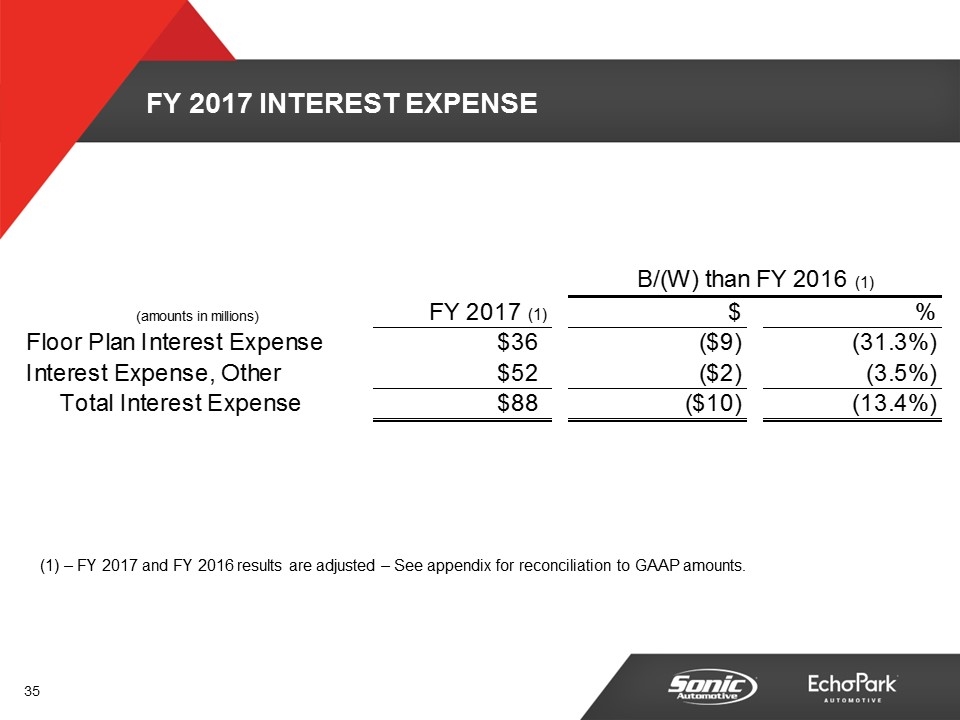
FY 2017 INTEREST EXPENSE – FY 2017 and FY 2016 results are adjusted – See appendix for reconciliation to GAAP amounts. B/(W) than FY 2016 (1) (amounts in millions) FY 2017 (1) $ % Floor Plan Interest Expense $36.395427080000005 $-8.6793051699999992 -0.31315005750745017 Interest Expense, Other $51.862908929999996 $-1.7571867399999901 -3.506958213948% Total Interest Expense $88.258336009999994 $-10.436491909999983 -0.13410748653796012
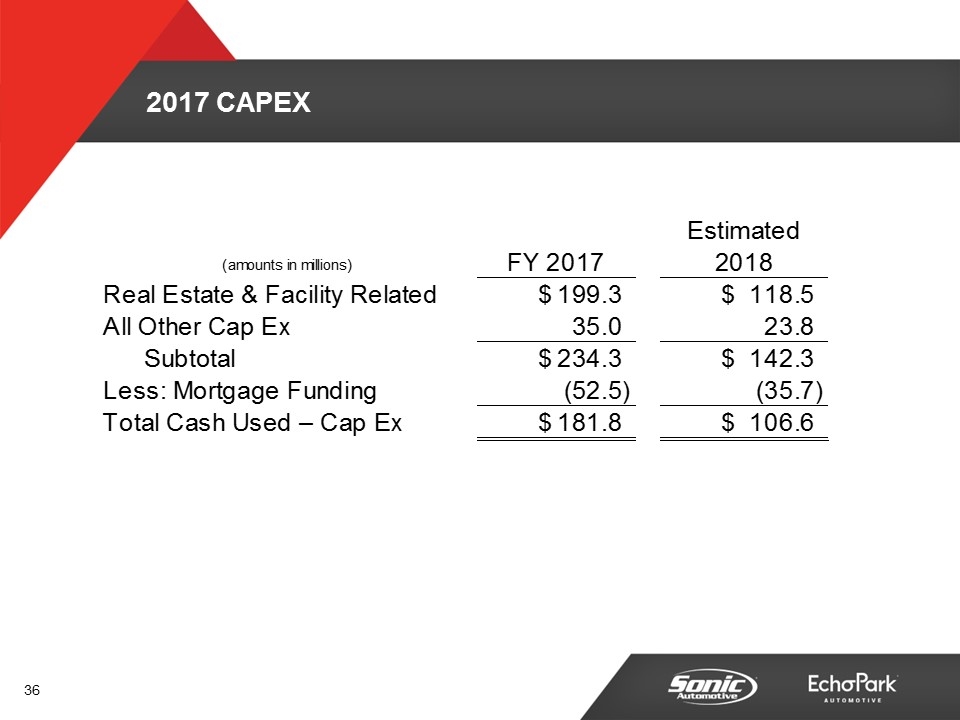
2017 CAPEX (amounts in millions) FY 2017 Estimated 2018 Real Estate & Facility Related $199.3 $118.5 All Other Cap Ex 35 23.8 Subtotal $234.3 $142.30000000000001 Less: Mortgage Funding -52.5 -35.700000000000003 Total Cash Used – Cap Ex $181.8 $106.60000000000001
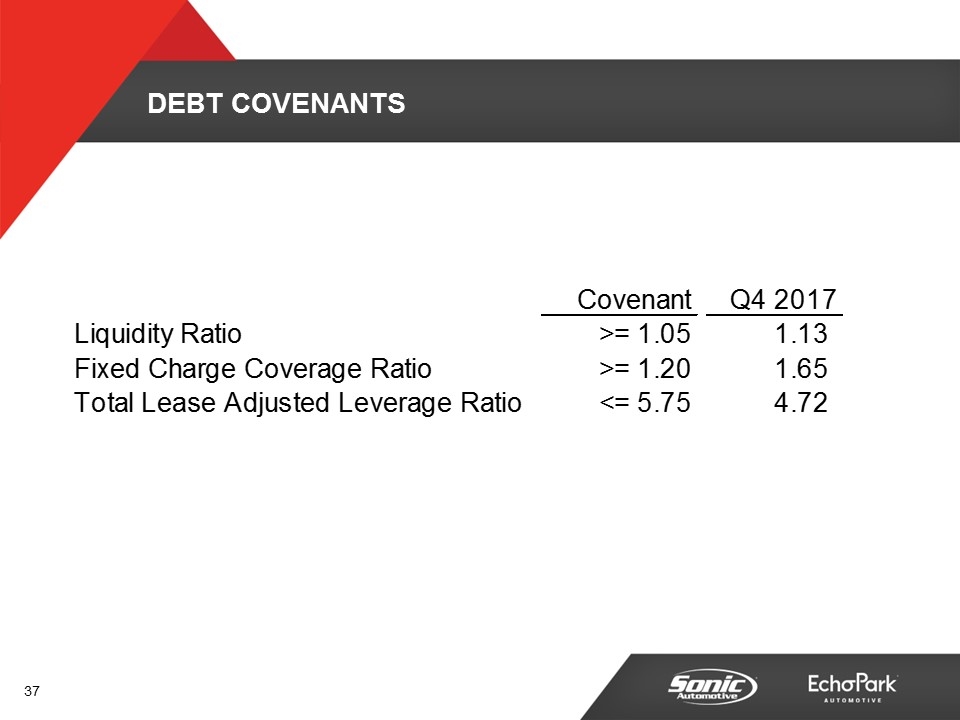
DEBT COVENANTS Covenant Q4 2017 Liquidity Ratio >= 1.05 1.1299999999999999 Fixed Charge Coverage Ratio >= 1.20 1.65 Total Lease Adjusted Leverage Ratio <= 5.75 4.72
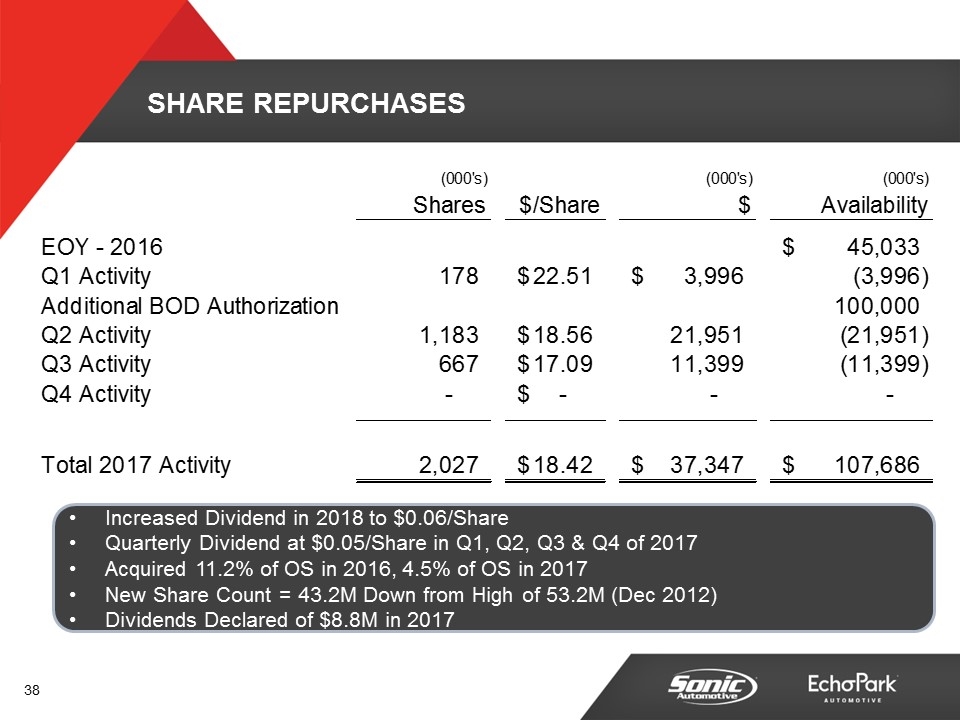
SHARE REPURCHASES Increased Dividend in 2018 to $0.06/Share Quarterly Dividend at $0.05/Share in Q1, Q2, Q3 & Q4 of 2017 Acquired 11.2% of OS in 2016, 4.5% of OS in 2017 New Share Count = 43.2M Down from High of 53.2M (Dec 2012) Dividends Declared of $8.8M in 2017 (000's) (000's) (000's) Shares $/Share $ Availability EOY - 2016 $45,032.523000000001 Q1 Activity 177.53200000000001 $22.509677128630329 $3,996.1880000000001 -3,996.1880000000001 Additional BOD Authorization ,100,000 Q2 Activity 1,182.6500000000001 $18.561160952099097 21,951.357 ,-21,951.357 Q3 Activity 667.11500000000001 $17.087182869520248 11,399.116 ,-11,399.116 Q4 Activity 0 $0 0 0 Total 2017 Activity 2,027.297 $18.421899208650732 $37,346.661 $,107,685.86199999999
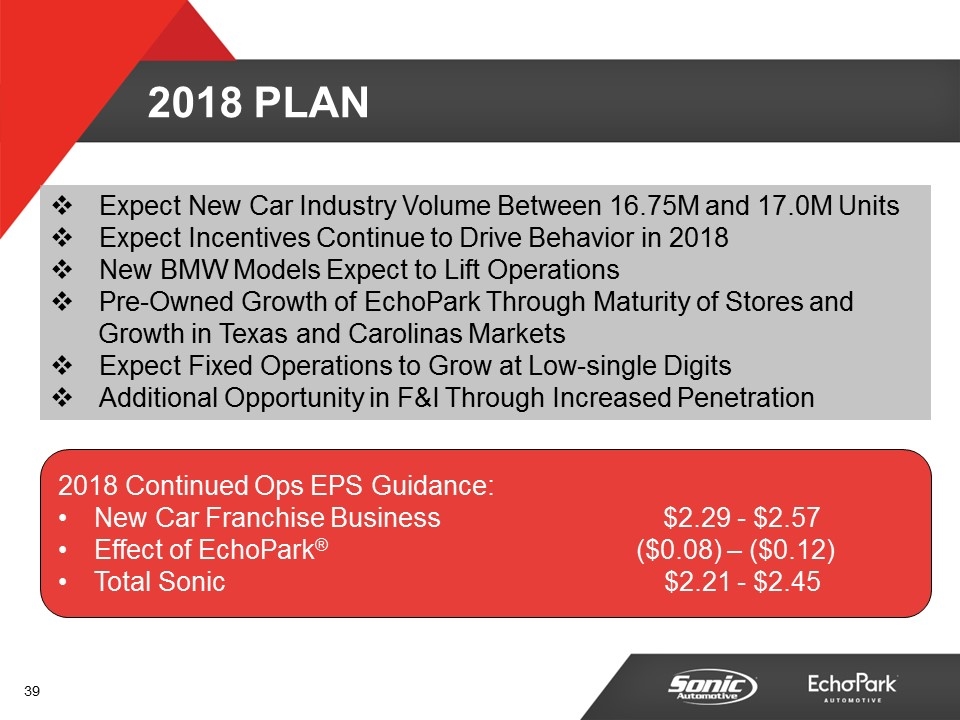
2018 Plan Expect New Car Industry Volume Between 16.75M and 17.0M Units Expect Incentives Continue to Drive Behavior in 2018 New BMW Models Expect to Lift Operations Pre-Owned Growth of EchoPark Through Maturity of Stores and Growth in Texas and Carolinas Markets Expect Fixed Operations to Grow at Low-single Digits Additional Opportunity in F&I Through Increased Penetration 2018 Continued Ops EPS Guidance: New Car Franchise Business $2.29 - $2.57 Effect of EchoPark® ($0.08) – ($0.12) Total Sonic $2.21 - $2.45

APPENDIX
NON-GAAP RECONCILIATIONS
NON-GAAP RECONCILIATIONS
NON-GAAP RECONCILIATIONS
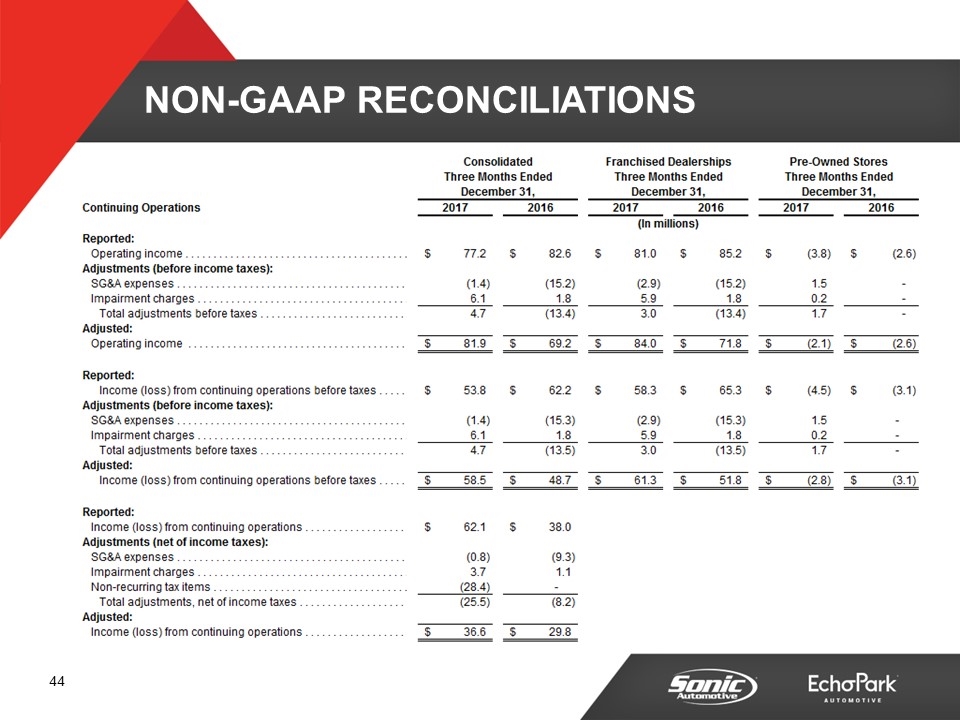
NON-GAAP RECONCILIATIONS
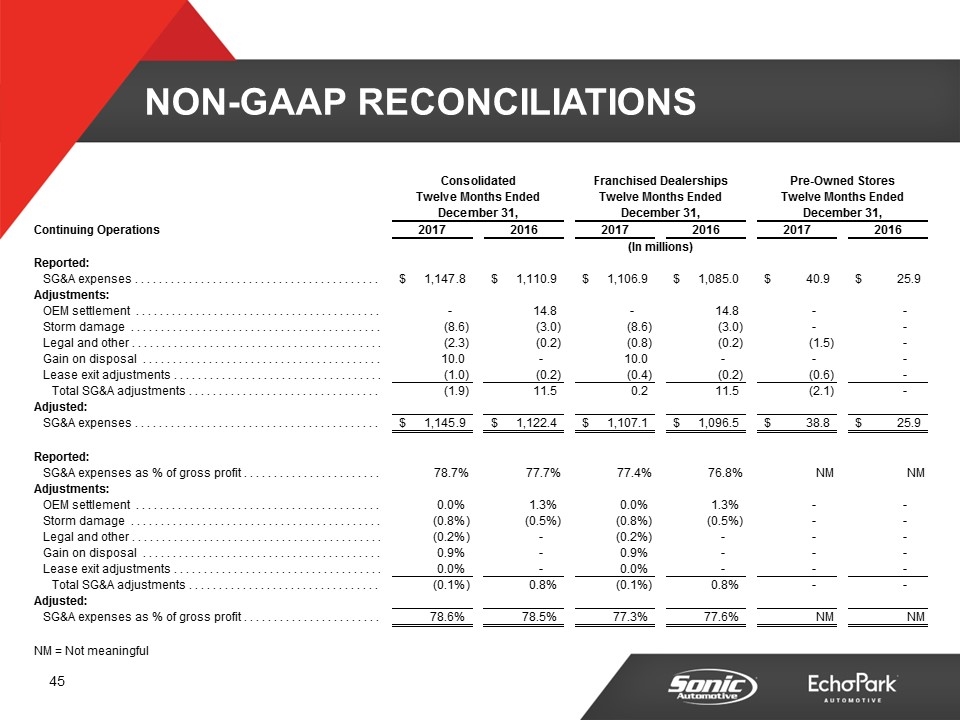
NON-GAAP RECONCILIATIONS
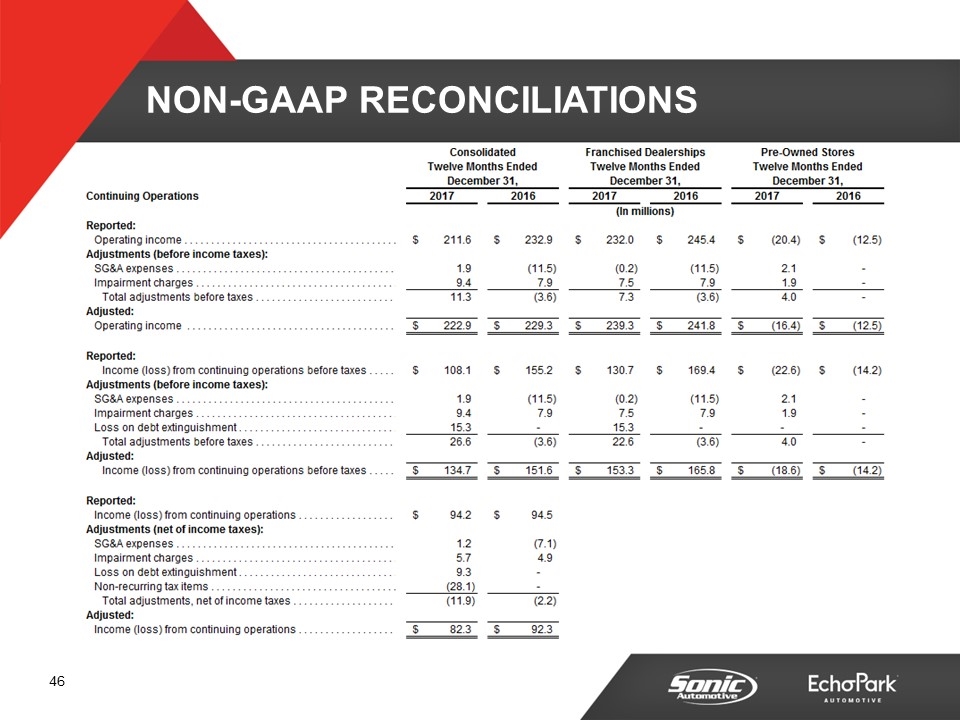
NON-GAAP RECONCILIATIONS
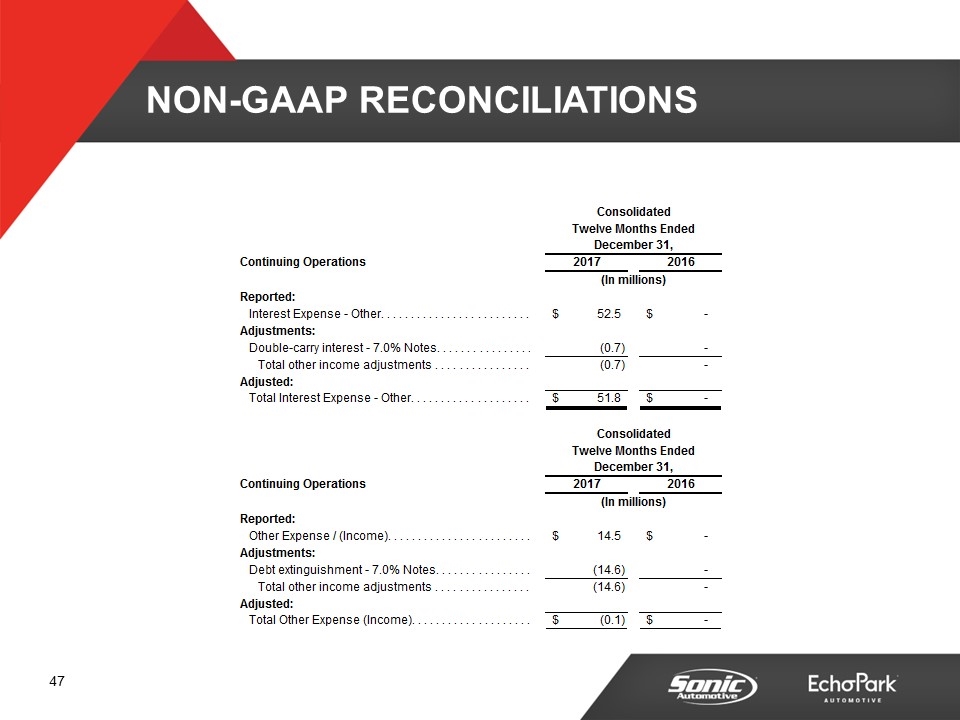
NON-GAAP RECONCILIATIONS
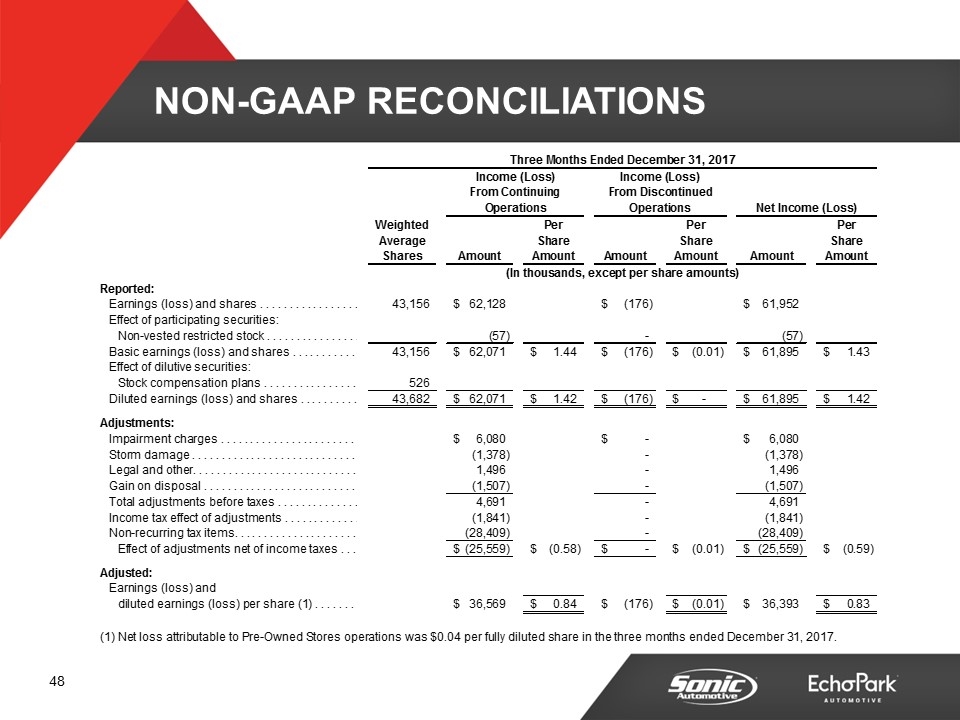
NON-GAAP RECONCILIATIONS
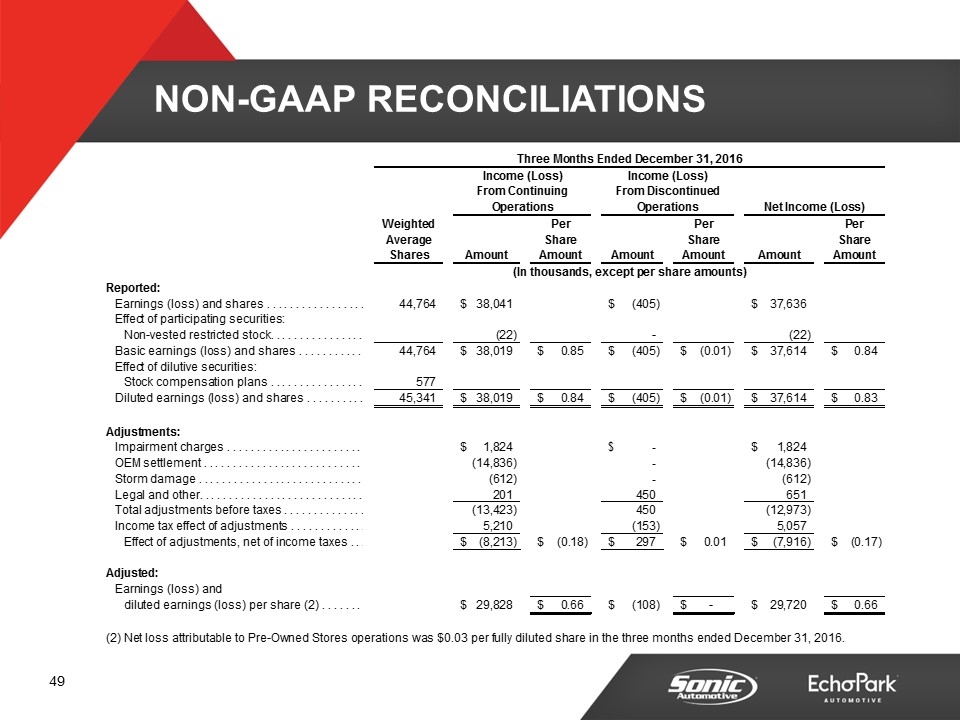
NON-GAAP RECONCILIATIONS
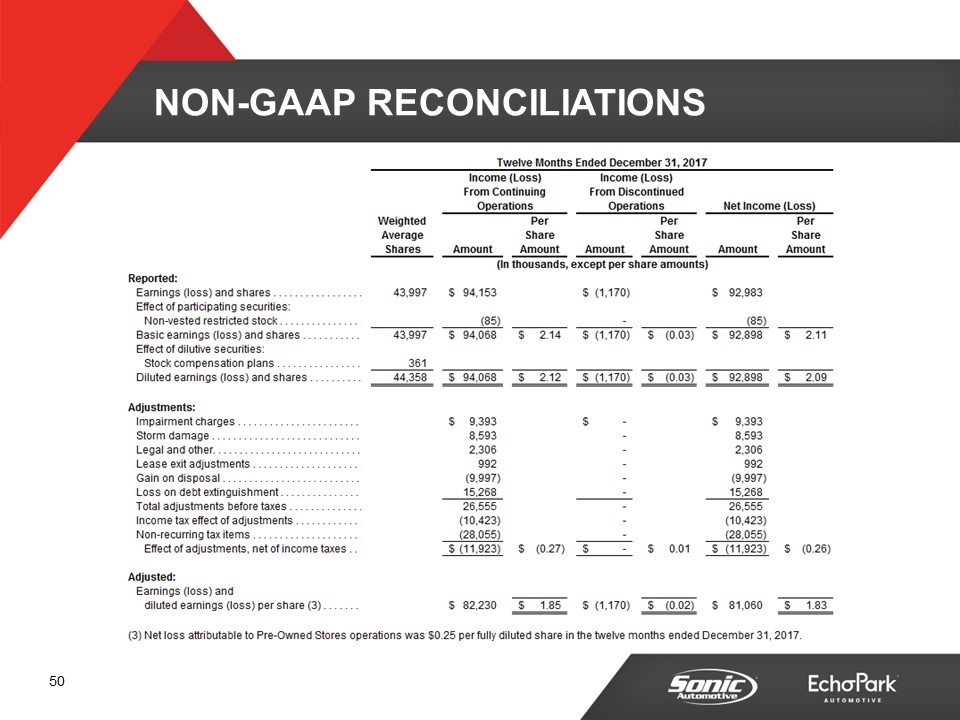
NON-GAAP RECONCILIATIONS
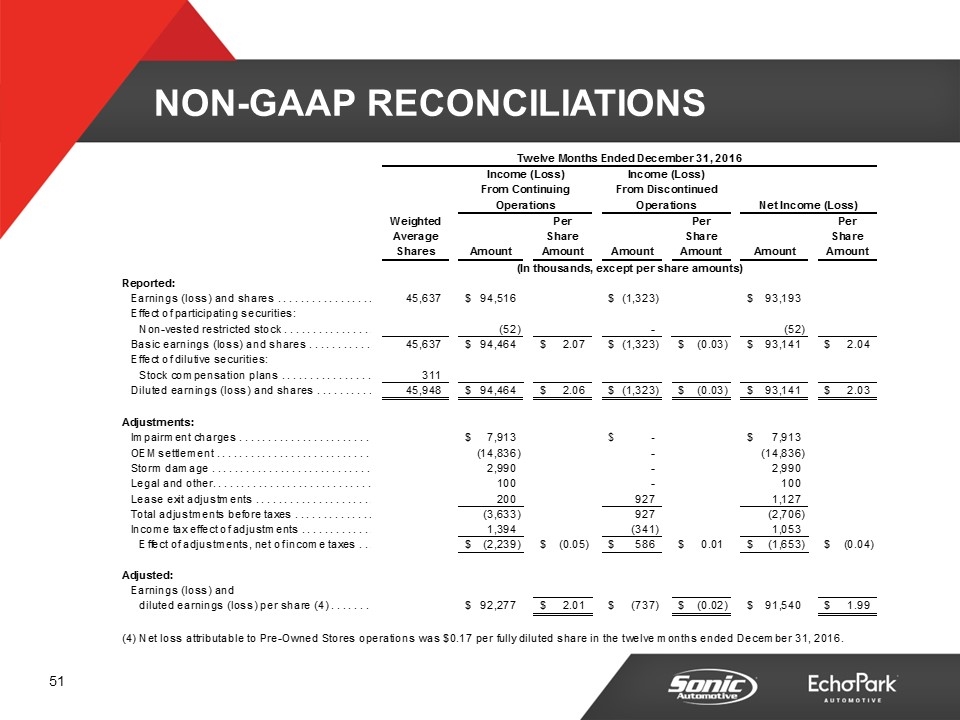
NON-GAAP RECONCILIATIONS