Exhibit 99.2 Q4 2018 Investor Presentation
FORWARD-LOOKING STATEMENTS This presentation contains “forward-looking statements” within the meaning of the Private Securities Litigation Reform Act of 1995. These statements relate to future events, are not historical facts and are based on our current expectations and assumptions regarding our business, the economy and other future conditions. These statements can generally be identified by lead-in words such as “believe”, “expect”, “anticipate”, “intend”, “plan”, “foresee”, “may”, “will” and other similar words. Statements that describe our Company’s objectives, plans or goals are also forward-looking statements. Examples of such forward-looking information we may be discussing in this presentation include, without limitation, earnings expectations, anticipated 2018 industry new vehicle sales volume, the implementation of growth and operating strategies, including acquisitions of dealerships and properties, the development of open points and stand-alone pre-owned stores, the return of capital to stockholders, anticipated future success and impacts from the implementation of our strategic initiatives and earnings per share expectations. You are cautioned that these forward-looking statements are not guarantees of future performance, involve risks and uncertainties and actual results may differ materially from those projected in the forward-looking statements as a result of various factors. These risks and uncertainties include, without limitation, economic conditions in the markets in which we operate, new and used vehicle industry sales volume, the success of our operational strategies, the rate and timing of overall economic recovery or decline, and the risk factors described in the Company’s Annual Report on Form 10-K for the year ended December 31, 2017 and the Company's other periodic reports and information filed with the Securities and Exchange Commission. These forward-looking statements, risks, uncertainties and additional factors speak only as of the date of this presentation. We undertake no obligation to update any such statements, except as required under federal securities laws and the rules and regulations of the Securities and Exchange Commission. 2
CONTENT • COMPANY OVERVIEW • FINANCIAL & OPERATIONS REVIEW • OUTLOOK 3

COMPANY OVERVIEW 4
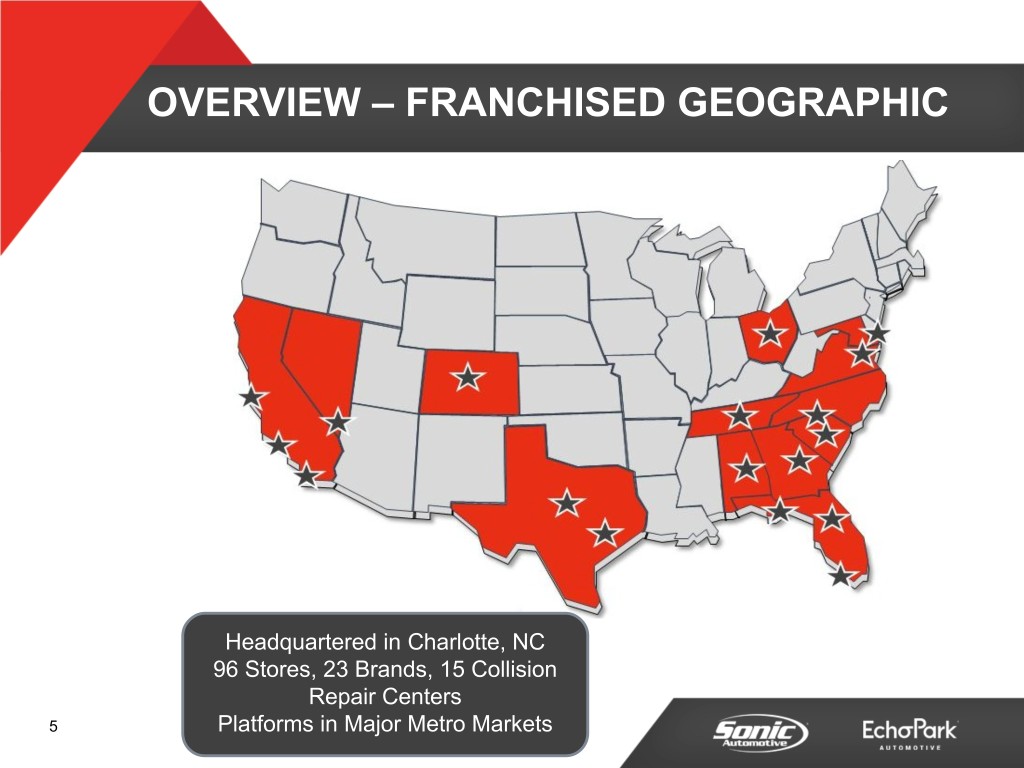
OVERVIEW – FRANCHISED GEOGRAPHIC Headquartered in Charlotte, NC 96 Stores, 23 Brands, 15 Collision Repair Centers 5 Platforms in Major Metro Markets
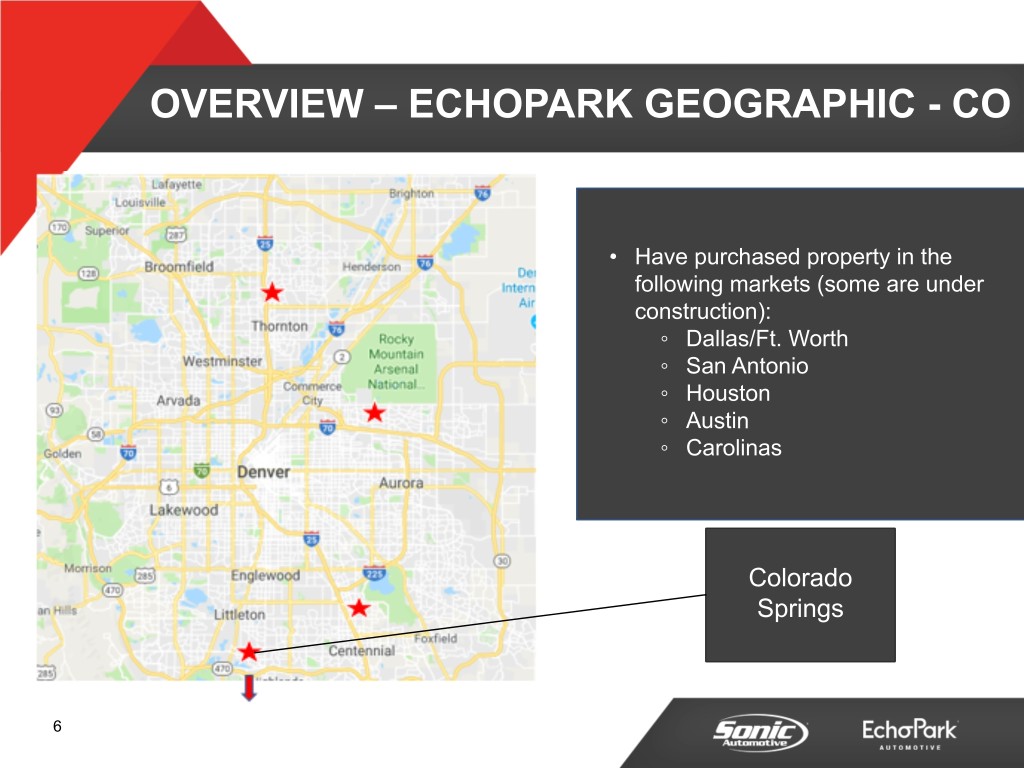
OVERVIEW – ECHOPARK GEOGRAPHIC - CO • Have purchased property in the following markets (some are under construction): ◦ Dallas/Ft. Worth ◦ San Antonio ◦ Houston ◦ Austin ◦ Carolinas Colorado Springs 6
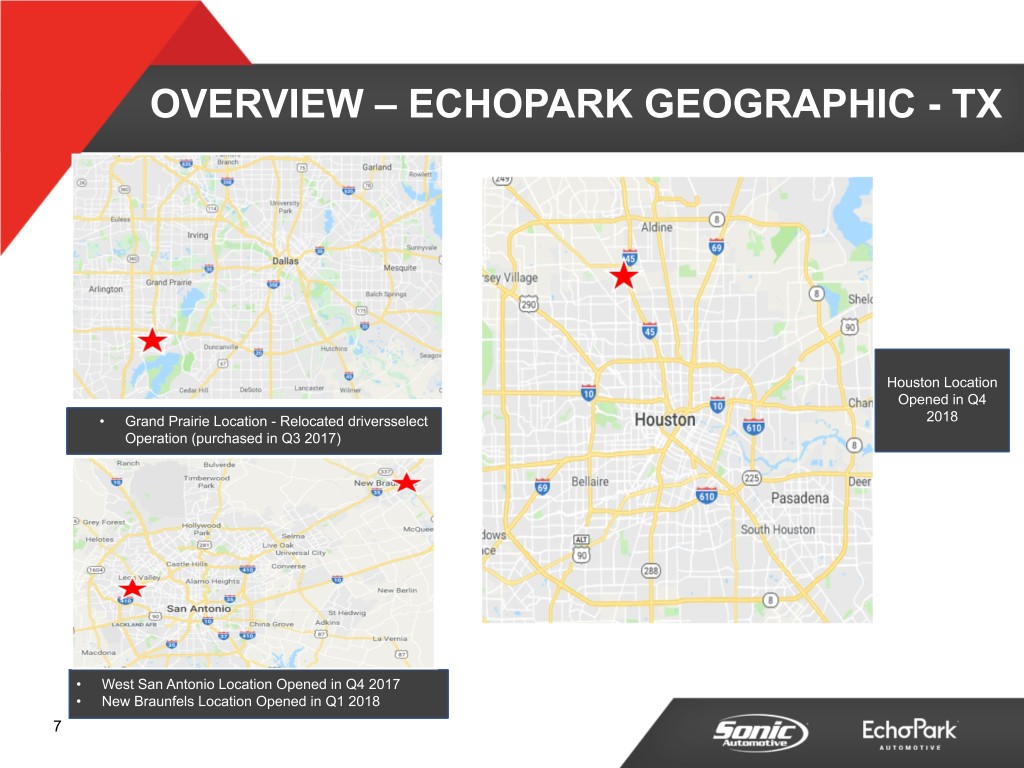
OVERVIEW – ECHOPARK GEOGRAPHIC - TX Houston Location Opened in Q4 • Grand Prairie Location - Relocated driversselect 2018 Operation (purchased in Q3 2017) • West San Antonio Location Opened in Q4 2017 • New Braunfels Location Opened in Q1 2018 7
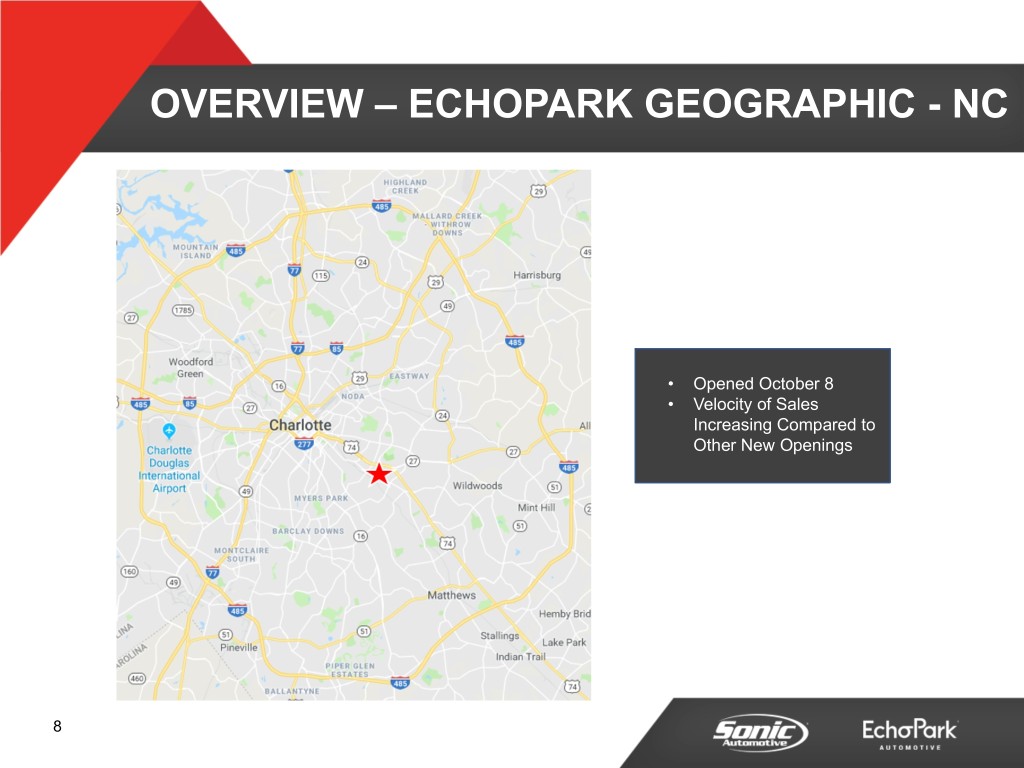
OVERVIEW – ECHOPARK GEOGRAPHIC - NC • Opened October 8 • Velocity of Sales Increasing Compared to Other New Openings 8
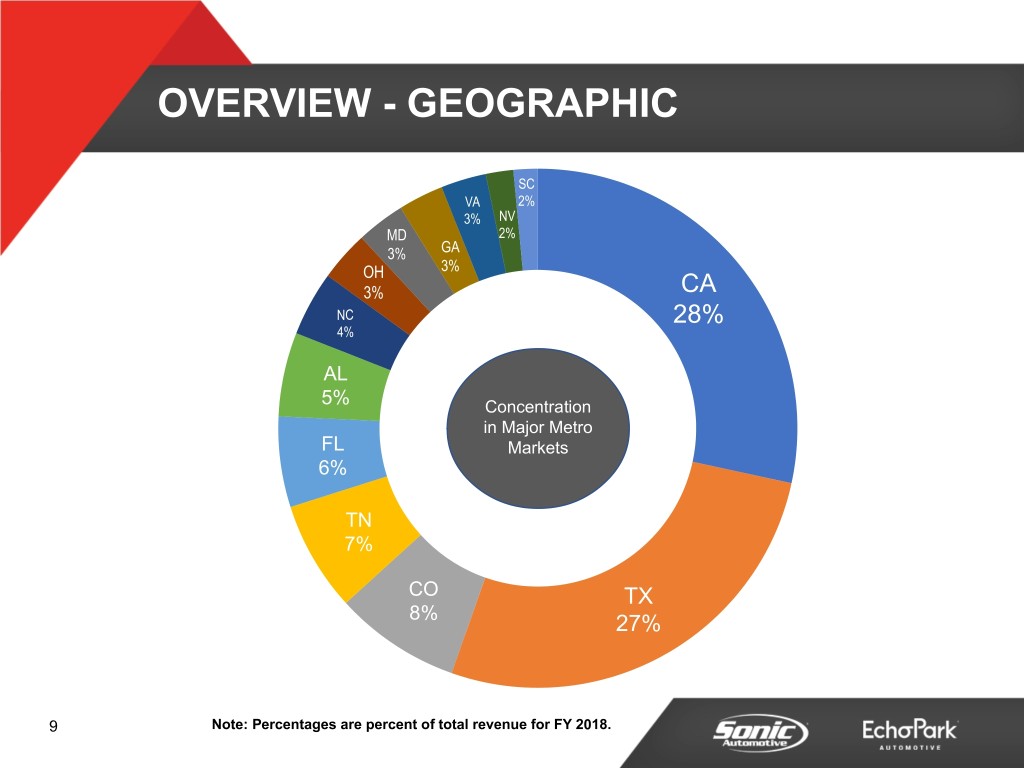
OVERVIEW - GEOGRAPHIC SC VA 2% 3% NV MD 2% 3% GA OH 3% 3% CA NC 28% 4% AL 5% Concentration in Major Metro FL Markets 6% TN 7% CO TX 8% 27% 9 Note: Percentages are percent of total revenue for FY 2018.
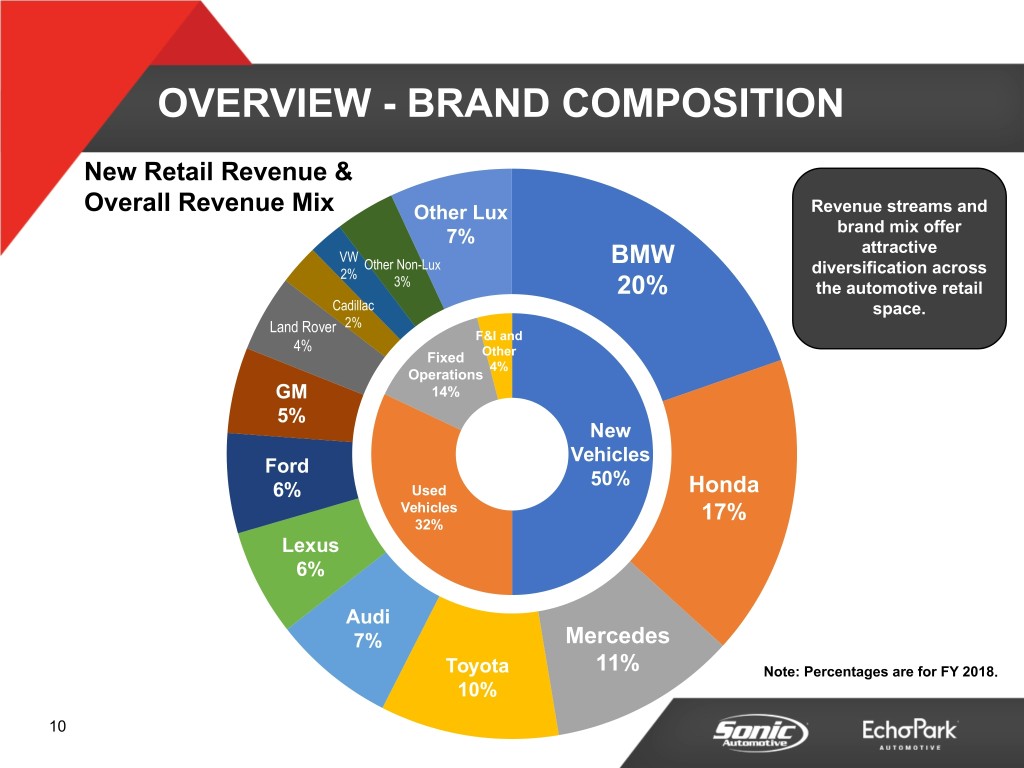
OVERVIEW - BRAND COMPOSITION New Retail Revenue & Overall Revenue Mix Other Lux Revenue streams and 7% brand mix offer attractive VW Other Non-Lux BMW 2% diversification across 3% 20% the automotive retail Cadillac space. Land Rover 2% F&I and 4% Fixed Other 4% Operations GM 14% 5% New Vehicles Ford 50% 6% Used Honda Vehicles 17% 32% Lexus 6% Audi 7% Mercedes Toyota 11% Note: Percentages are for FY 2018. 10% 10
Q4 2018 FINANCIAL REVIEW FRANCHISED SEGMENT 11
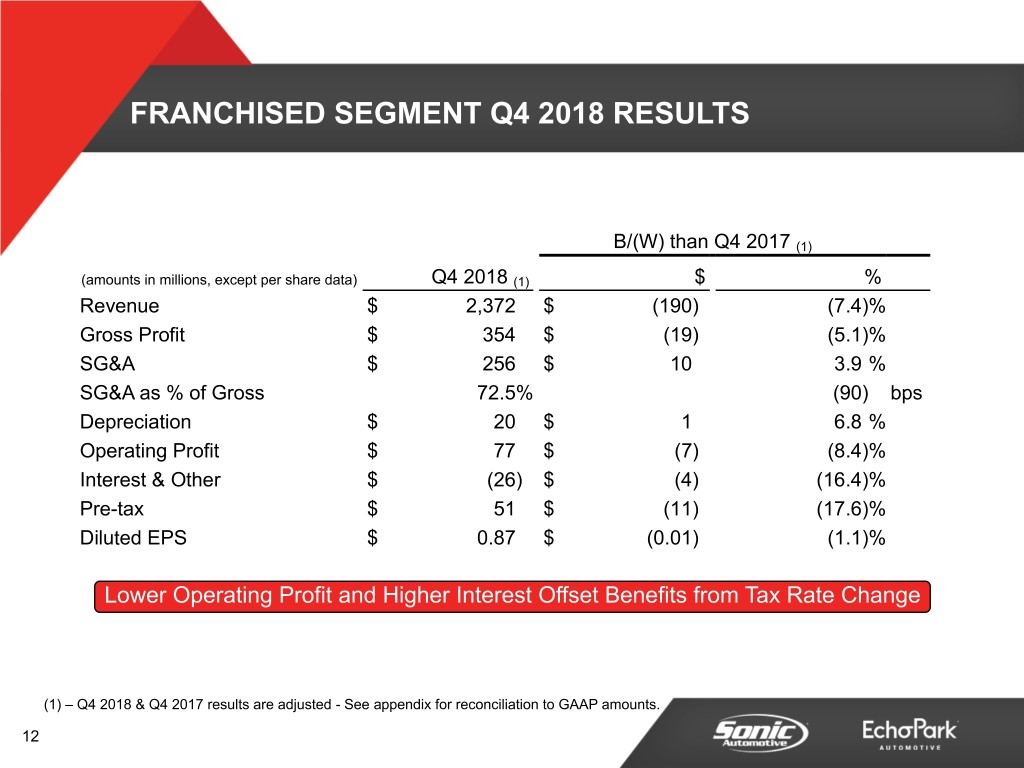
FRANCHISED SEGMENT Q4 2018 RESULTS B/(W) than Q4 2017 (1) (amounts in millions, except per share data) Q4 2018 (1) $ % Revenue $ 2,372 $ (190) (7.4)% Gross Profit $ 354 $ (19) (5.1)% SG&A $ 256 $ 10 3.9 % SG&A as % of Gross 72.5% (90) bps Depreciation $ 20 $ 1 6.8 % Operating Profit $ 77 $ (7) (8.4)% Interest & Other $ (26) $ (4) (16.4)% Pre-tax $ 51 $ (11) (17.6)% Diluted EPS $ 0.87 $ (0.01) (1.1)% Lower Operating Profit and Higher Interest Offset Benefits from Tax Rate Change (1) – Q4 2018 & Q4 2017 results are adjusted - See appendix for reconciliation to GAAP amounts. 12
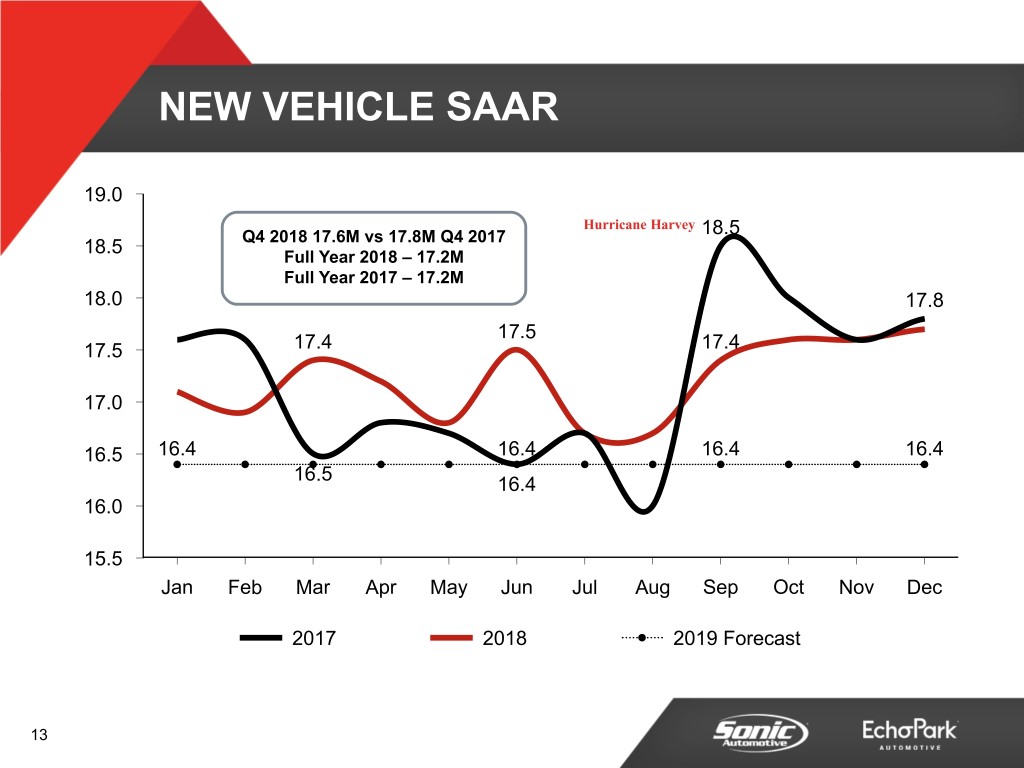
NEW VEHICLE SAAR 19.0 Hurricane Harvey Q4 2018 17.6M vs 17.8M Q4 2017 18.5 18.5 Full Year 2018 – 17.2M Full Year 2017 – 17.2M 18.0 17.8 17.5 17.5 17.4 17.4 17.0 16.5 16.4 16.4 16.4 16.4 16.5 16.4 16.0 15.5 Jan Feb Mar Apr May Jun Jul Aug Sep Oct Nov Dec 2017 2018 2019 Forecast 13
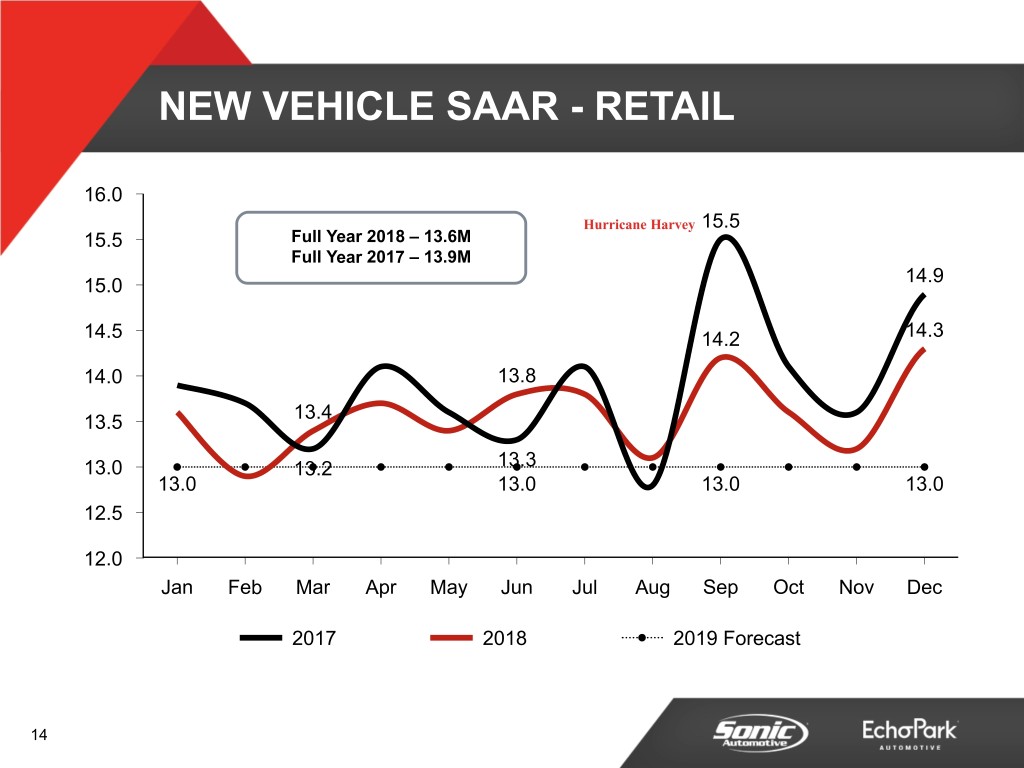
NEW VEHICLE SAAR - RETAIL 16.0 Hurricane Harvey 15.5 15.5 Full Year 2018 – 13.6M Full Year 2017 – 13.9M 14.9 15.0 14.5 14.2 14.3 14.0 13.8 13.4 13.5 13.0 13.2 13.3 13.0 13.0 13.0 13.0 12.5 12.0 Jan Feb Mar Apr May Jun Jul Aug Sep Oct Nov Dec 2017 2018 2019 Forecast 14
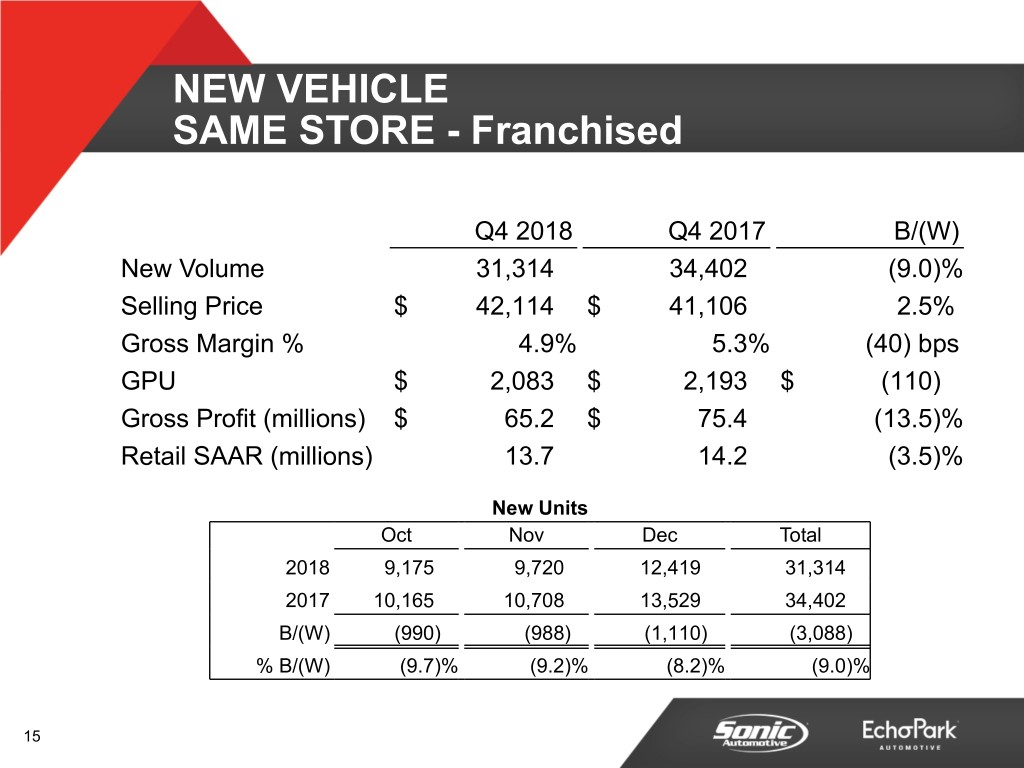
NEW VEHICLE SAME STORE - Franchised Q4 2018 Q4 2017 B/(W) New Volume 31,314 34,402 (9.0)% Selling Price $ 42,114 $ 41,106 2.5% Gross Margin % 4.9% 5.3% (40) bps GPU $ 2,083 $ 2,193 $ (110) Gross Profit (millions) $ 65.2 $ 75.4 (13.5)% Retail SAAR (millions) 13.7 14.2 (3.5)% New Units Oct Nov Dec Total 2018 9,175 9,720 12,419 31,314 2017 10,165 10,708 13,529 34,402 B/(W) (990) (988) (1,110) (3,088) % B/(W) (9.7)% (9.2)% (8.2)% (9.0)% 15
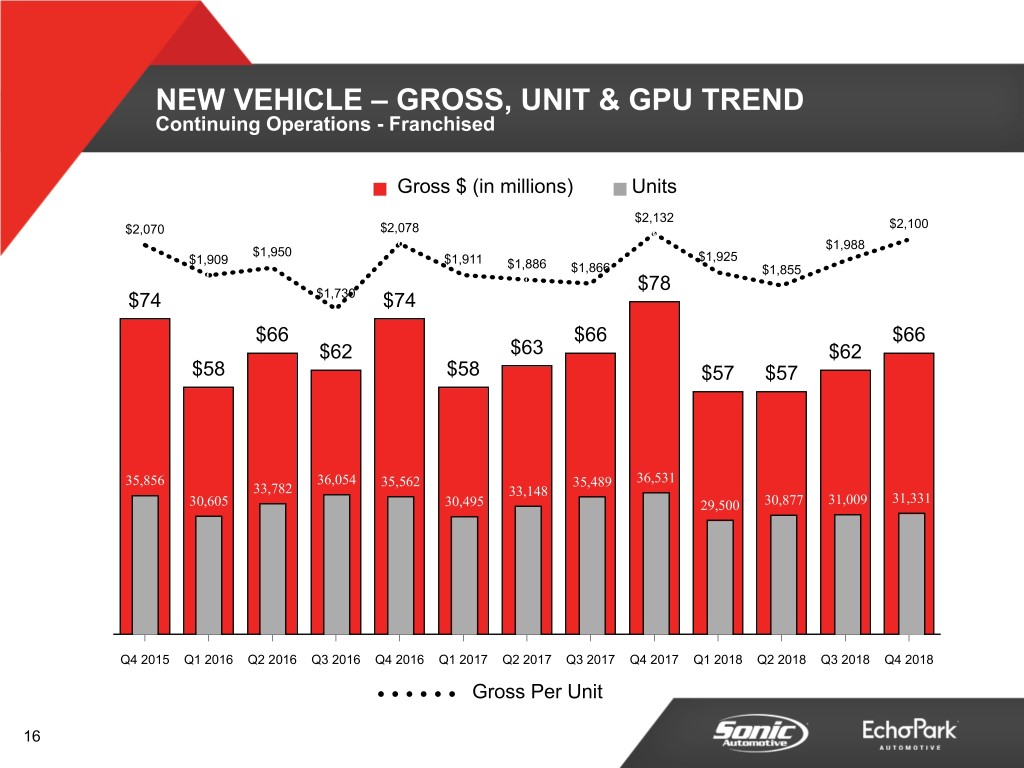
NEW VEHICLE – GROSS, UNIT & GPU TREND Continuing Operations - Franchised ▪ Gross $ (in millions) ▪Units $2,132 $2,070 $2,078 $2,100 $1,988 $1,950 $1,909 $1,911 $1,925 $1,886 $1,866 $1,855 $78 $74 $1,730 $74 $66 $66 $66 $62 $63 $62 $58 $58 $57 $57 35,856 36,054 35,562 35,489 36,531 33,782 33,148 31,331 30,605 30,495 29,500 30,877 31,009 Q4 2015 Q1 2016 Q2 2016 Q3 2016 Q4 2016 Q1 2017 Q2 2017 Q3 2017 Q4 2017 Q1 2018 Q2 2018 Q3 2018 Q4 2018 Gross Per Unit 16
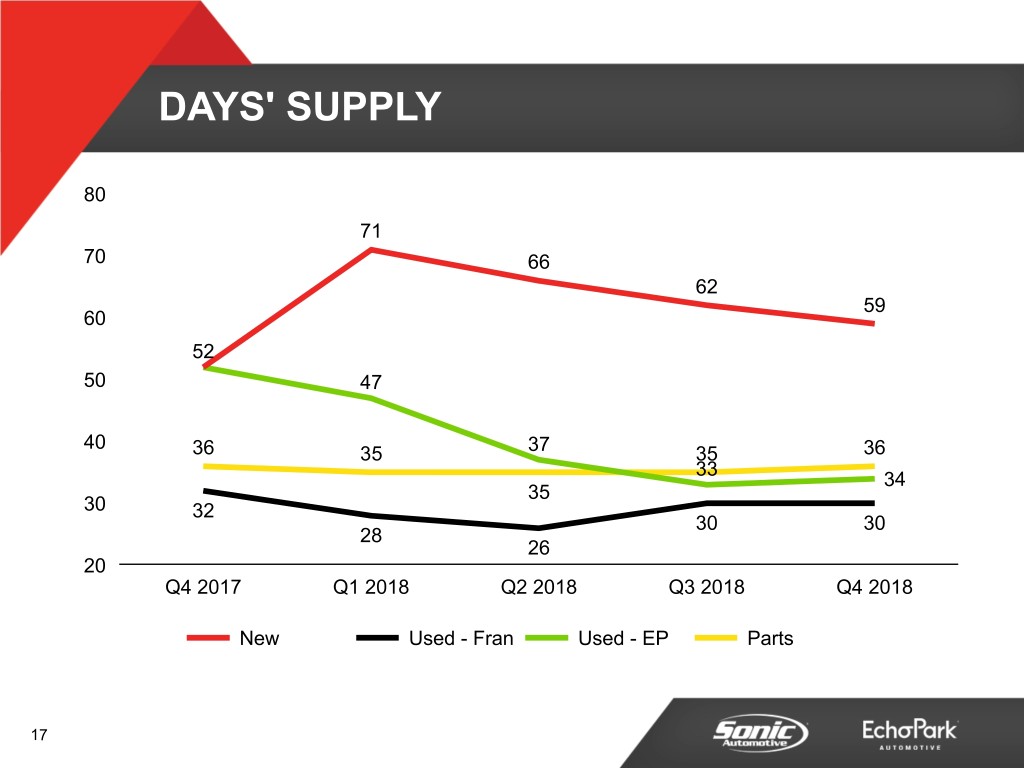
DAYS' SUPPLY 80 71 70 66 62 59 60 52 50 47 40 36 35 37 35 36 33 34 35 30 32 30 30 28 26 20 Q4 2017 Q1 2018 Q2 2018 Q3 2018 Q4 2018 New Used - Fran Used - EP Parts 17
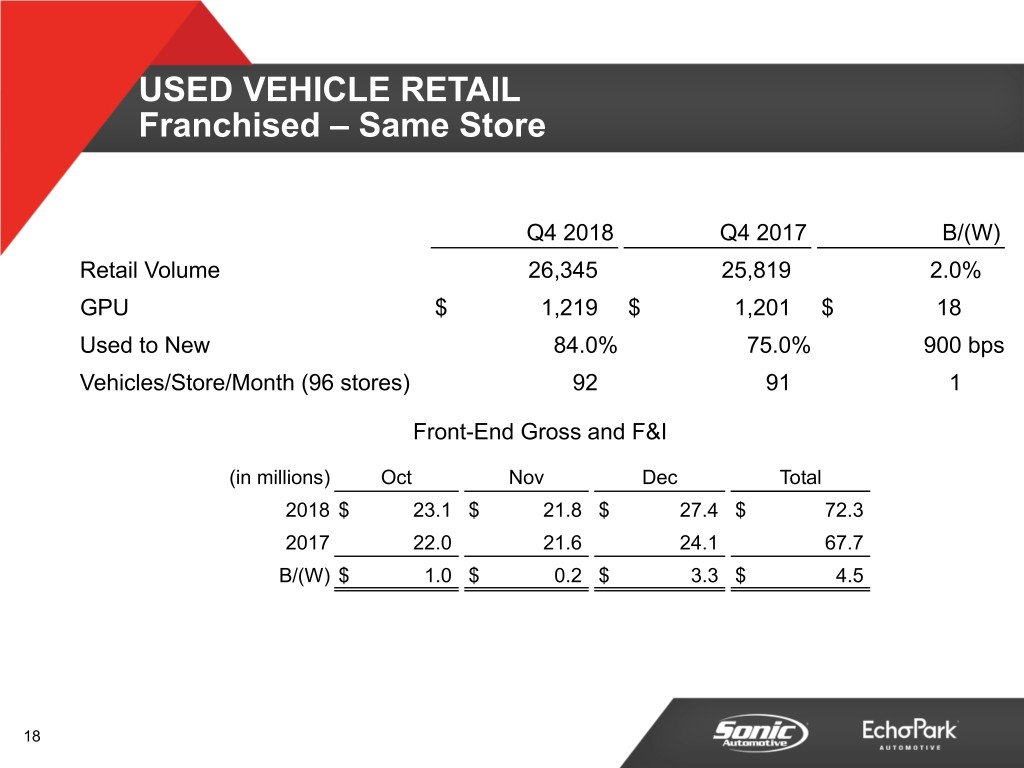
USED VEHICLE RETAIL Franchised – Same Store Q4 2018 Q4 2017 B/(W) Retail Volume 26,345 25,819 2.0% GPU $ 1,219 $ 1,201 $ 18 Used to New 84.0% 75.0% 900 bps Vehicles/Store/Month (96 stores) 92 91 1 Front-End Gross and F&I (in millions) Oct Nov Dec Total 2018 $ 23.1 $ 21.8 $ 27.4 $ 72.3 2017 22.0 21.6 24.1 67.7 B/(W) $ 1.0 $ 0.2 $ 3.3 $ 4.5 18
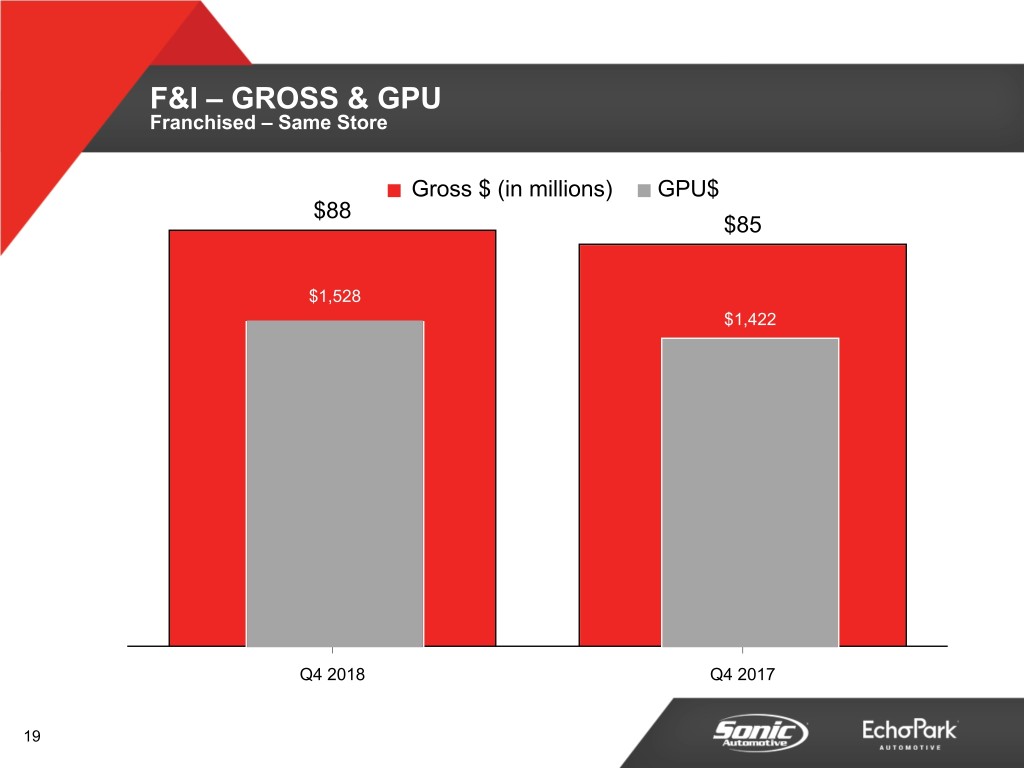
F&I – GROSS & GPU Franchised – Same Store Gross $ (in millions) GPU$ $88 ▪ ▪ $85 $1,528 $1,422 Q4 2018 Q4 2017 19
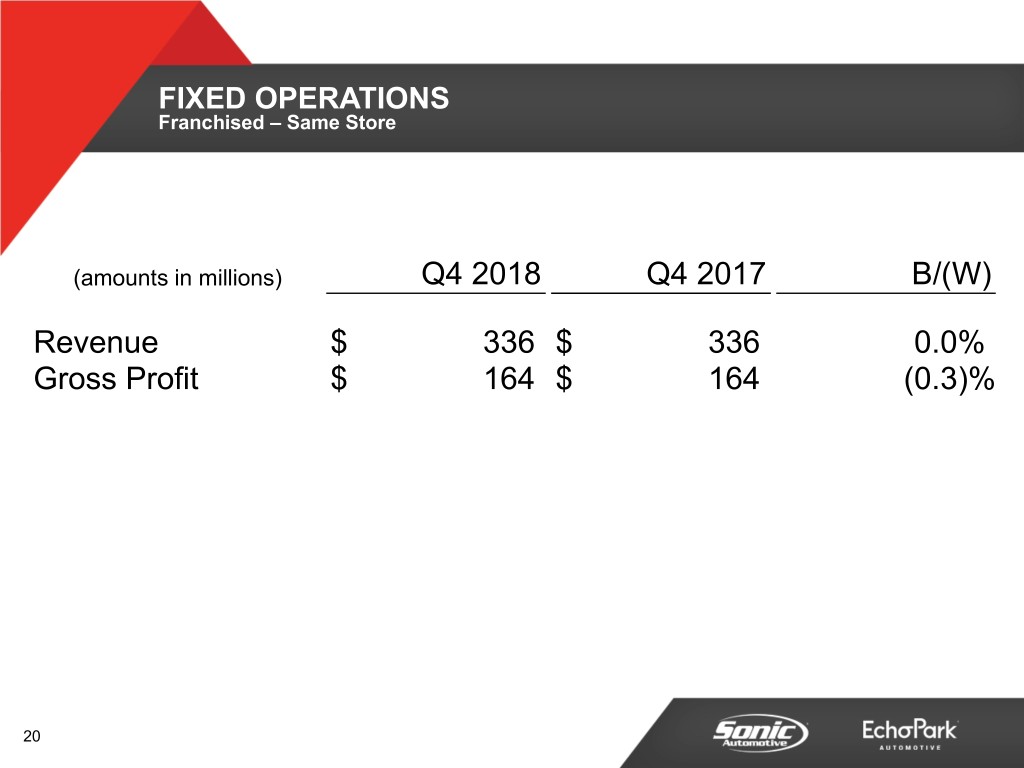
FIXED OPERATIONS Franchised – Same Store (amounts in millions) Q4 2018 Q4 2017 B/(W) Revenue $ 336 $ 336 0.0% Gross Profit $ 164 $ 164 (0.3)% 20
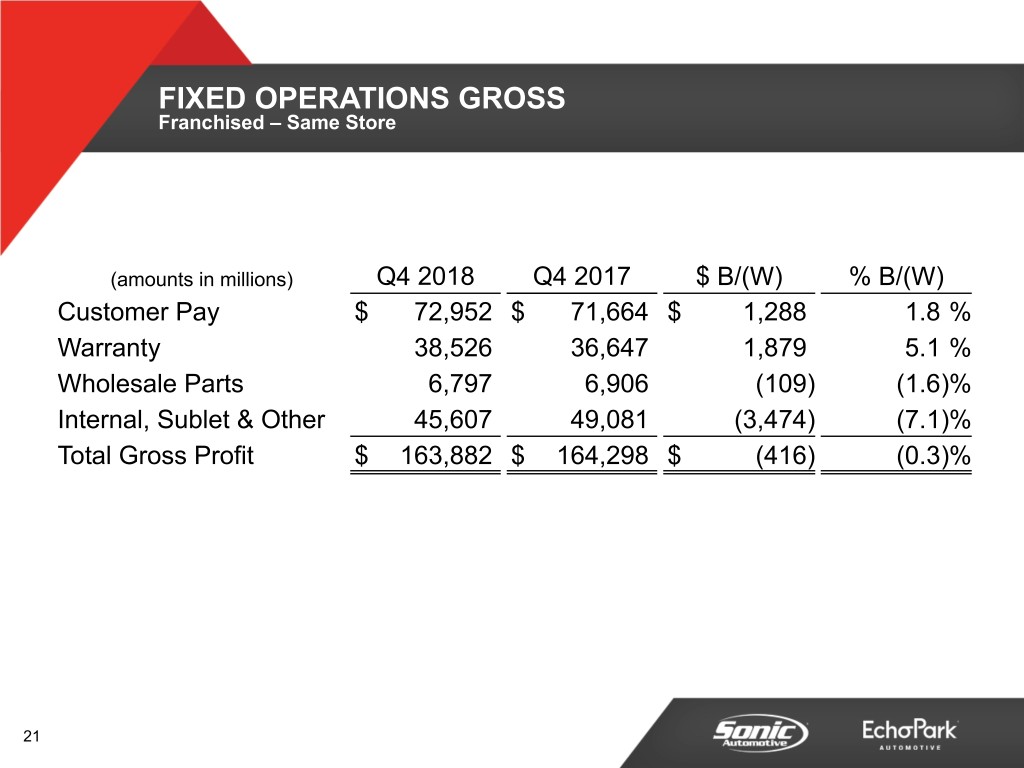
FIXED OPERATIONS GROSS Franchised – Same Store (amounts in millions) Q4 2018 Q4 2017 $ B/(W) % B/(W) Customer Pay $ 72,952 $ 71,664 $ 1,288 1.8 % Warranty 38,526 36,647 1,879 5.1 % Wholesale Parts 6,797 6,906 (109) (1.6)% Internal, Sublet & Other 45,607 49,081 (3,474) (7.1)% Total Gross Profit $ 163,882 $ 164,298 $ (416) (0.3)% 21
Q4 2018 FINANCIAL REVIEW ECHOPARK SEGMENT 22
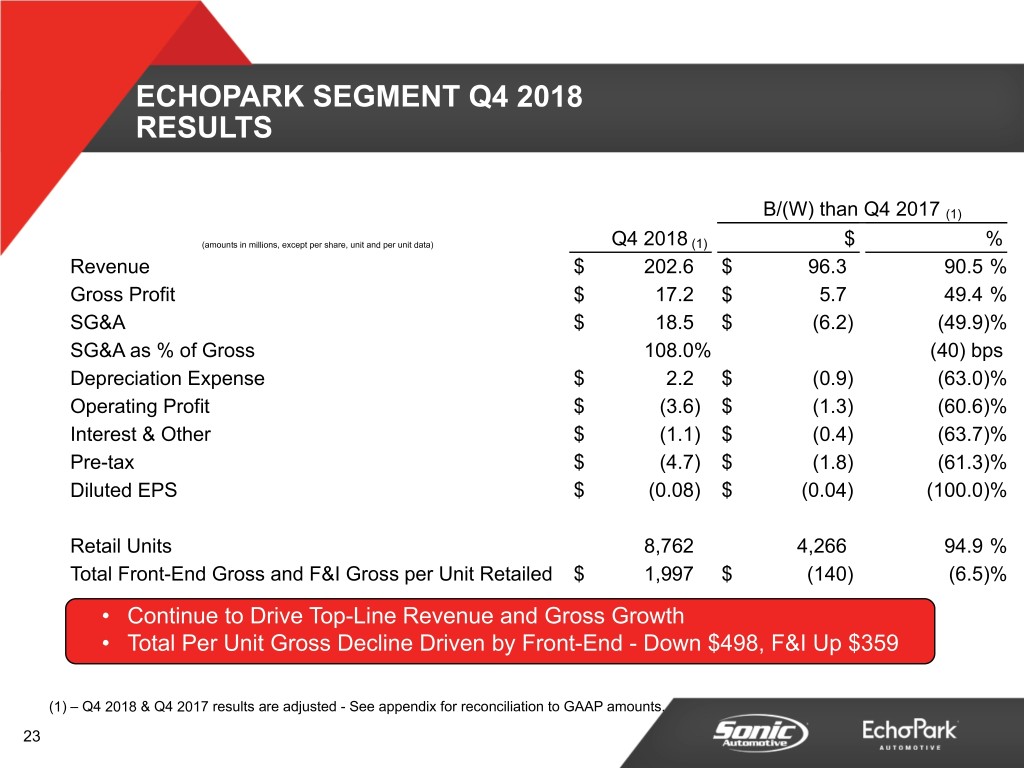
ECHOPARK SEGMENT Q4 2018 RESULTS B/(W) than Q4 2017 (1) (amounts in millions, except per share, unit and per unit data) Q4 2018 (1) $ % Revenue $ 202.6 $ 96.3 90.5 % Gross Profit $ 17.2 $ 5.7 49.4 % SG&A $ 18.5 $ (6.2) (49.9)% SG&A as % of Gross 108.0% (40) bps Depreciation Expense $ 2.2 $ (0.9) (63.0)% Operating Profit $ (3.6) $ (1.3) (60.6)% Interest & Other $ (1.1) $ (0.4) (63.7)% Pre-tax $ (4.7) $ (1.8) (61.3)% Diluted EPS $ (0.08) $ (0.04) (100.0)% Retail Units 8,762 4,266 94.9 % Total Front-End Gross and F&I Gross per Unit Retailed $ 1,997 $ (140) (6.5)% • Continue to Drive Top-Line Revenue and Gross Growth • Total Per Unit Gross Decline Driven by Front-End - Down $498, F&I Up $359 (1) – Q4 2018 & Q4 2017 results are adjusted - See appendix for reconciliation to GAAP amounts. 23
Q4 2018 FINANCIAL REVIEW TOTAL ENTERPRISE 24
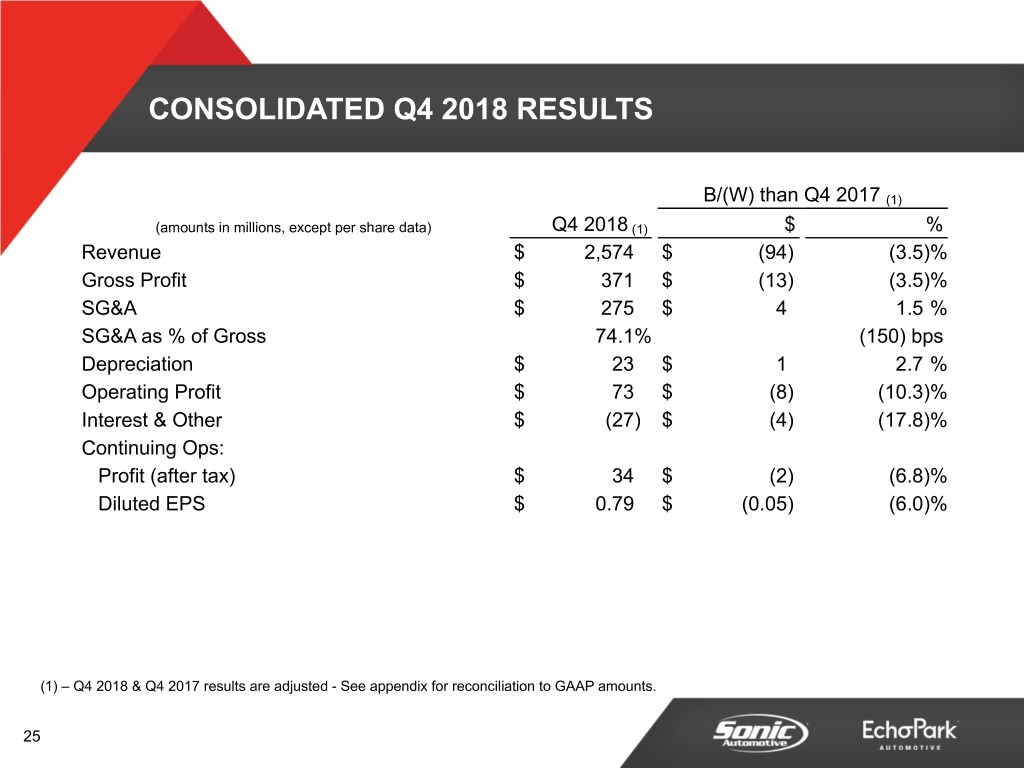
CONSOLIDATED Q4 2018 RESULTS B/(W) than Q4 2017 (1) (amounts in millions, except per share data) Q4 2018 (1) $ % Revenue $ 2,574 $ (94) (3.5)% Gross Profit $ 371 $ (13) (3.5)% SG&A $ 275 $ 4 1.5 % SG&A as % of Gross 74.1% (150) bps Depreciation $ 23 $ 1 2.7 % Operating Profit $ 73 $ (8) (10.3)% Interest & Other $ (27) $ (4) (17.8)% Continuing Ops: Profit (after tax) $ 34 $ (2) (6.8)% Diluted EPS $ 0.79 $ (0.05) (6.0)% (1) – Q4 2018 & Q4 2017 results are adjusted - See appendix for reconciliation to GAAP amounts. 25
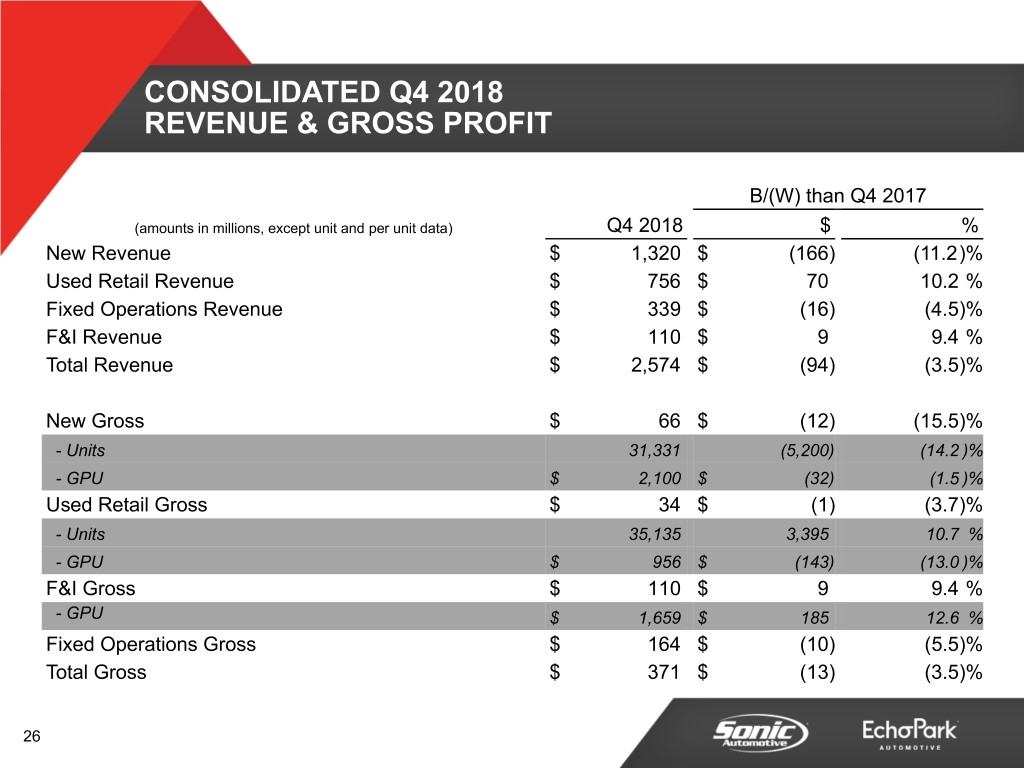
CONSOLIDATED Q4 2018 REVENUE & GROSS PROFIT B/(W) than Q4 2017 (amounts in millions, except unit and per unit data) Q4 2018 $ % New Revenue $ 1,320 $ (166) (11.2)% Used Retail Revenue $ 756 $ 70 10.2 % Fixed Operations Revenue $ 339 $ (16) (4.5)% F&I Revenue $ 110 $ 9 9.4 % Total Revenue $ 2,574 $ (94) (3.5)% New Gross $ 66 $ (12) (15.5)% - Units 31,331 (5,200) (14.2 )% - GPU $ 2,100 $ (32) (1.5 )% Used Retail Gross $ 34 $ (1) (3.7)% - Units 35,135 3,395 10.7 % - GPU $ 956 $ (143) (13.0 )% F&I Gross $ 110 $ 9 9.4 % - GPU $ 1,659 $ 185 12.6 % Fixed Operations Gross $ 164 $ (10) (5.5)% Total Gross $ 371 $ (13) (3.5)% 26
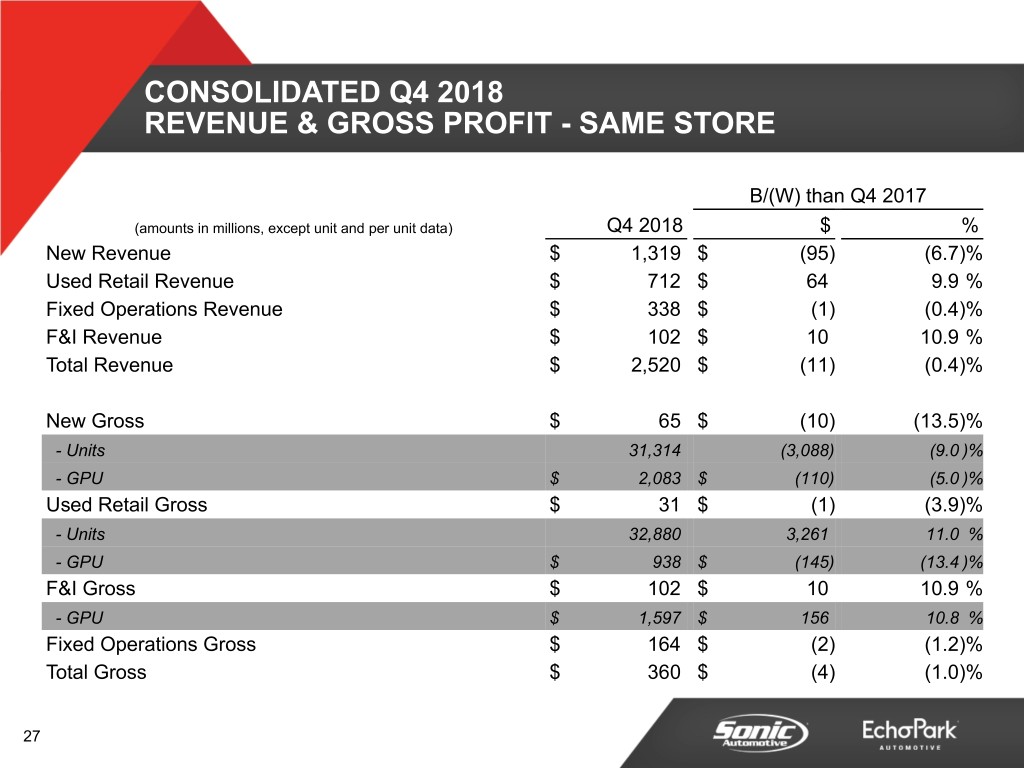
CONSOLIDATED Q4 2018 REVENUE & GROSS PROFIT - SAME STORE B/(W) than Q4 2017 (amounts in millions, except unit and per unit data) Q4 2018 $ % New Revenue $ 1,319 $ (95) (6.7)% Used Retail Revenue $ 712 $ 64 9.9 % Fixed Operations Revenue $ 338 $ (1) (0.4)% F&I Revenue $ 102 $ 10 10.9 % Total Revenue $ 2,520 $ (11) (0.4)% New Gross $ 65 $ (10) (13.5)% - Units 31,314 (3,088) (9.0 )% - GPU $ 2,083 $ (110) (5.0 )% Used Retail Gross $ 31 $ (1) (3.9)% - Units 32,880 3,261 11.0 % - GPU $ 938 $ (145) (13.4 )% F&I Gross $ 102 $ 10 10.9 % - GPU $ 1,597 $ 156 10.8 % Fixed Operations Gross $ 164 $ (2) (1.2)% Total Gross $ 360 $ (4) (1.0)% 27
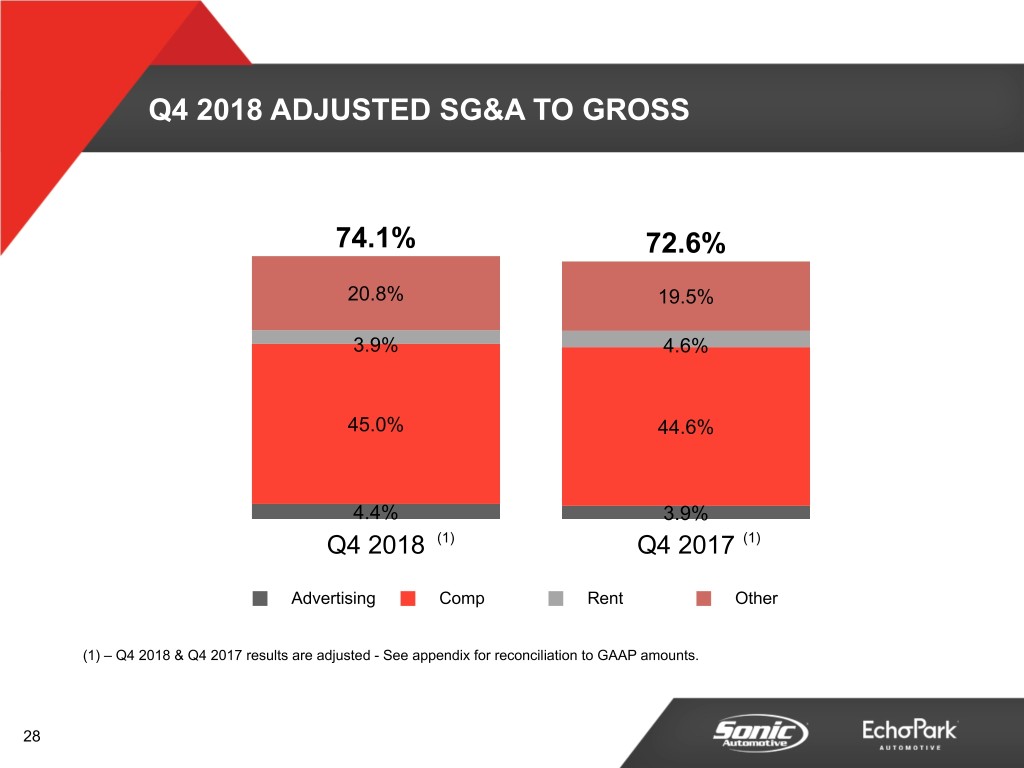
Q4 2018 ADJUSTED SG&A TO GROSS 74.1% 72.6% 20.8% 19.5% 3.9% 4.6% 45.0% 44.6% 4.4% 3.9% Q4 2018 (1) Q4 2017 (1) Advertising Comp Rent Other (1) – Q4 2018 & Q4 2017 results are adjusted - See appendix for reconciliation to GAAP amounts. 28
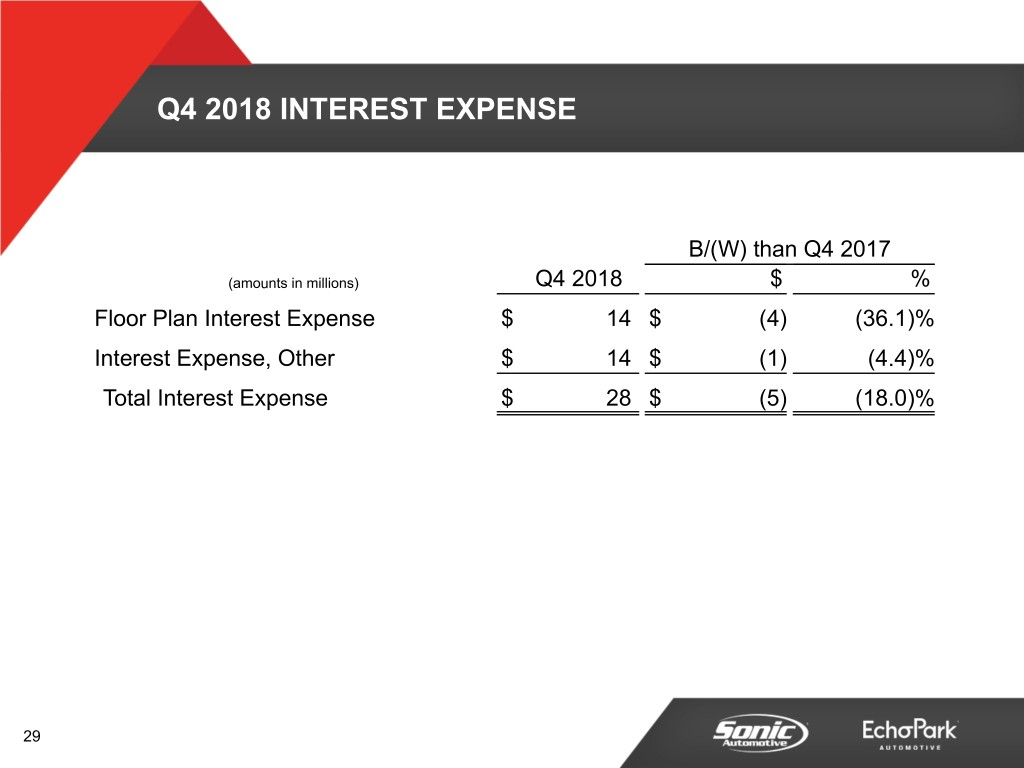
Q4 2018 INTEREST EXPENSE B/(W) than Q4 2017 (amounts in millions) Q4 2018 $ % Floor Plan Interest Expense $ 14 $ (4) (36.1)% Interest Expense, Other $ 14 $ (1) (4.4)% Total Interest Expense $ 28 $ (5) (18.0)% 29
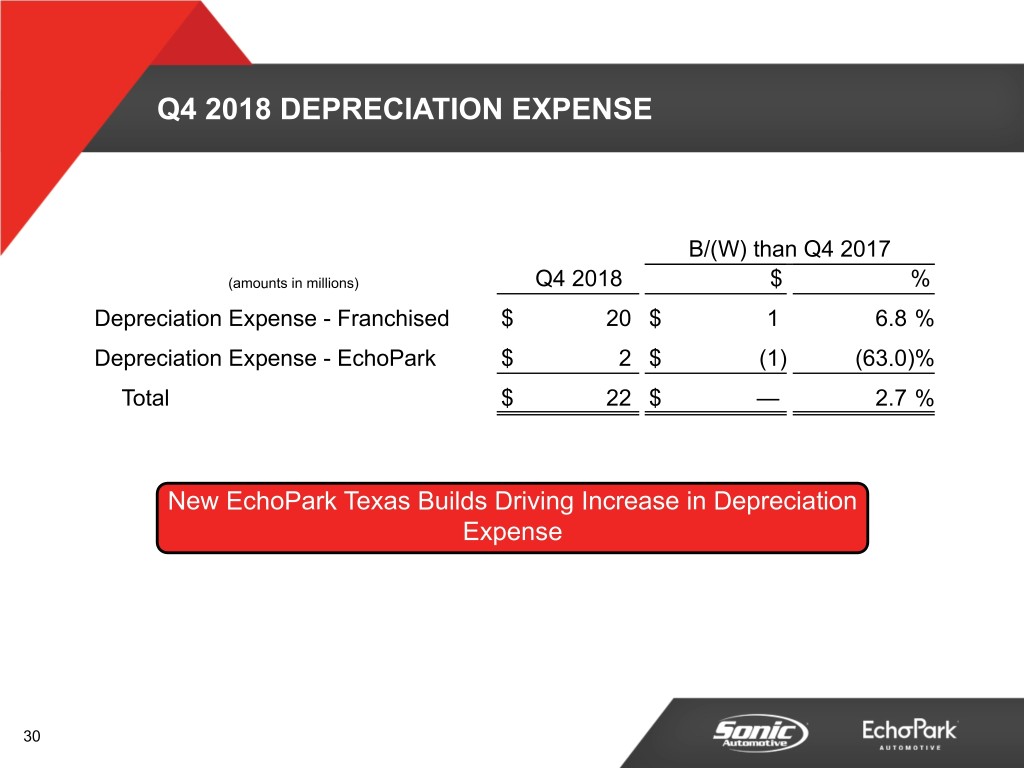
Q4 2018 DEPRECIATION EXPENSE B/(W) than Q4 2017 (amounts in millions) Q4 2018 $ % Depreciation Expense - Franchised $ 20 $ 1 6.8 % Depreciation Expense - EchoPark $ 2 $ (1) (63.0)% Total $ 22 $ — 2.7 % New EchoPark Texas Builds Driving Increase in Depreciation Expense 30

FY 2018 FINANCIAL REVIEW 31
FY 2018 FINANCIAL REVIEW FRANCHISED SEGMENT 32
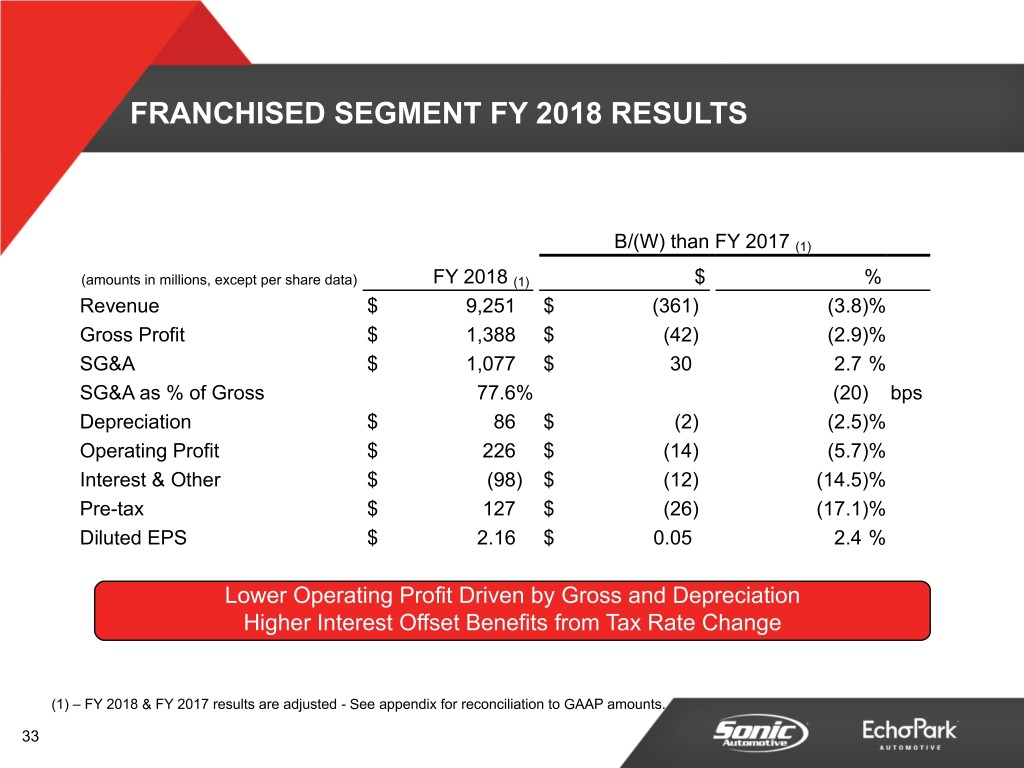
FRANCHISED SEGMENT FY 2018 RESULTS B/(W) than FY 2017 (1) (amounts in millions, except per share data) FY 2018 (1) $ % Revenue $ 9,251 $ (361) (3.8)% Gross Profit $ 1,388 $ (42) (2.9)% SG&A $ 1,077 $ 30 2.7 % SG&A as % of Gross 77.6% (20) bps Depreciation $ 86 $ (2) (2.5)% Operating Profit $ 226 $ (14) (5.7)% Interest & Other $ (98) $ (12) (14.5)% Pre-tax $ 127 $ (26) (17.1)% Diluted EPS $ 2.16 $ 0.05 2.4 % Lower Operating Profit Driven by Gross and Depreciation Higher Interest Offset Benefits from Tax Rate Change (1) – FY 2018 & FY 2017 results are adjusted - See appendix for reconciliation to GAAP amounts. 33
FY 2018 FINANCIAL REVIEW ECHOPARK SEGMENT 34
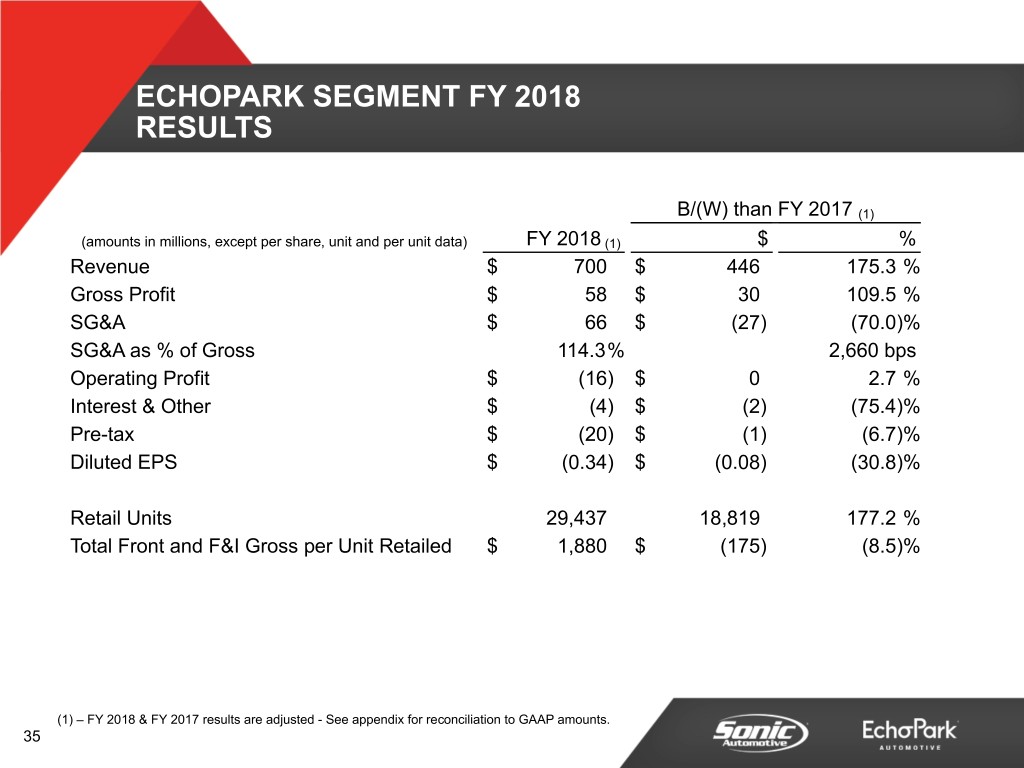
ECHOPARK SEGMENT FY 2018 RESULTS B/(W) than FY 2017 (1) (amounts in millions, except per share, unit and per unit data) FY 2018 (1) $ % Revenue $ 700 $ 446 175.3 % Gross Profit $ 58 $ 30 109.5 % SG&A $ 66 $ (27) (70.0)% SG&A as % of Gross 114.3% 2,660 bps Operating Profit $ (16) $ 0 2.7 % Interest & Other $ (4) $ (2) (75.4)% Pre-tax $ (20) $ (1) (6.7)% Diluted EPS $ (0.34) $ (0.08) (30.8)% Retail Units 29,437 18,819 177.2 % Total Front and F&I Gross per Unit Retailed $ 1,880 $ (175) (8.5)% (1) – FY 2018 & FY 2017 results are adjusted - See appendix for reconciliation to GAAP amounts. 35
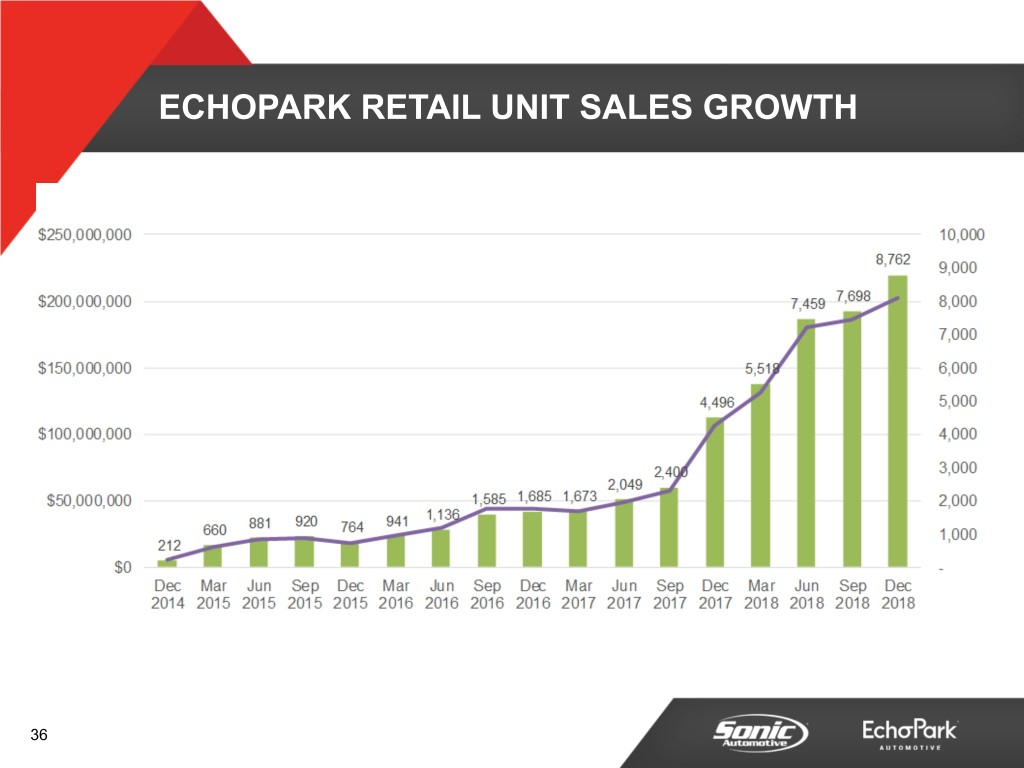
ECHOPARK RETAIL UNIT SALES GROWTH 36
FY 2018 FINANCIAL REVIEW TOTAL ENTERPRISE 37
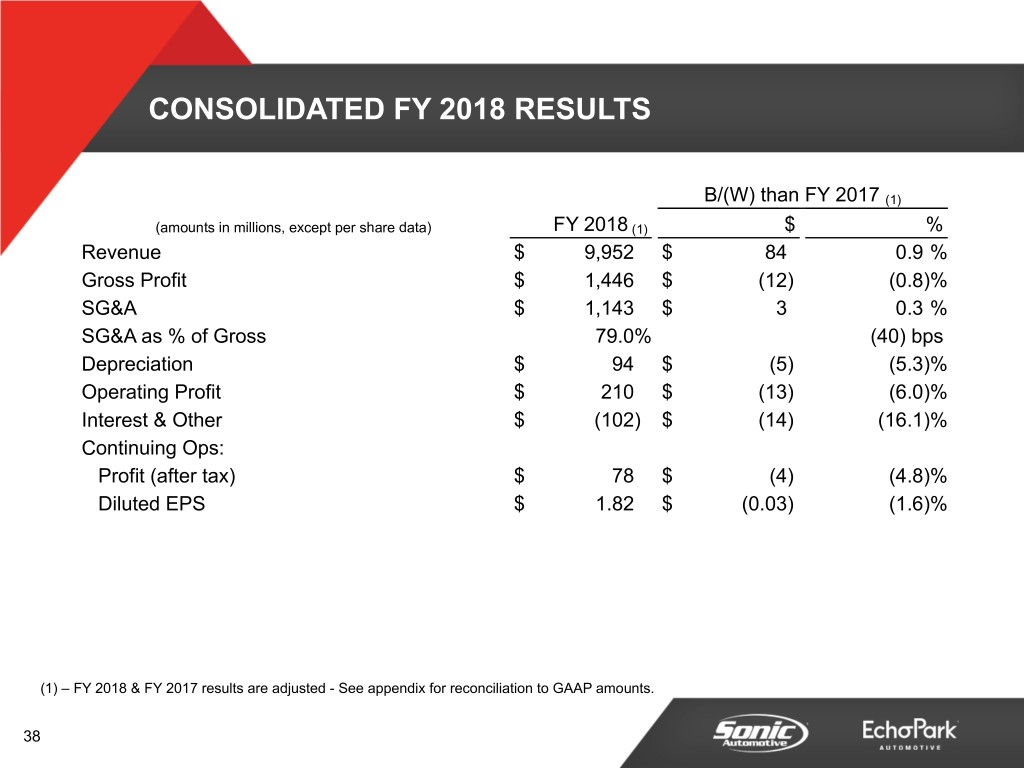
CONSOLIDATED FY 2018 RESULTS B/(W) than FY 2017 (1) (amounts in millions, except per share data) FY 2018 (1) $ % Revenue $ 9,952 $ 84 0.9 % Gross Profit $ 1,446 $ (12) (0.8)% SG&A $ 1,143 $ 3 0.3 % SG&A as % of Gross 79.0% (40) bps Depreciation $ 94 $ (5) (5.3)% Operating Profit $ 210 $ (13) (6.0)% Interest & Other $ (102) $ (14) (16.1)% Continuing Ops: Profit (after tax) $ 78 $ (4) (4.8)% Diluted EPS $ 1.82 $ (0.03) (1.6)% (1) – FY 2018 & FY 2017 results are adjusted - See appendix for reconciliation to GAAP amounts. 38
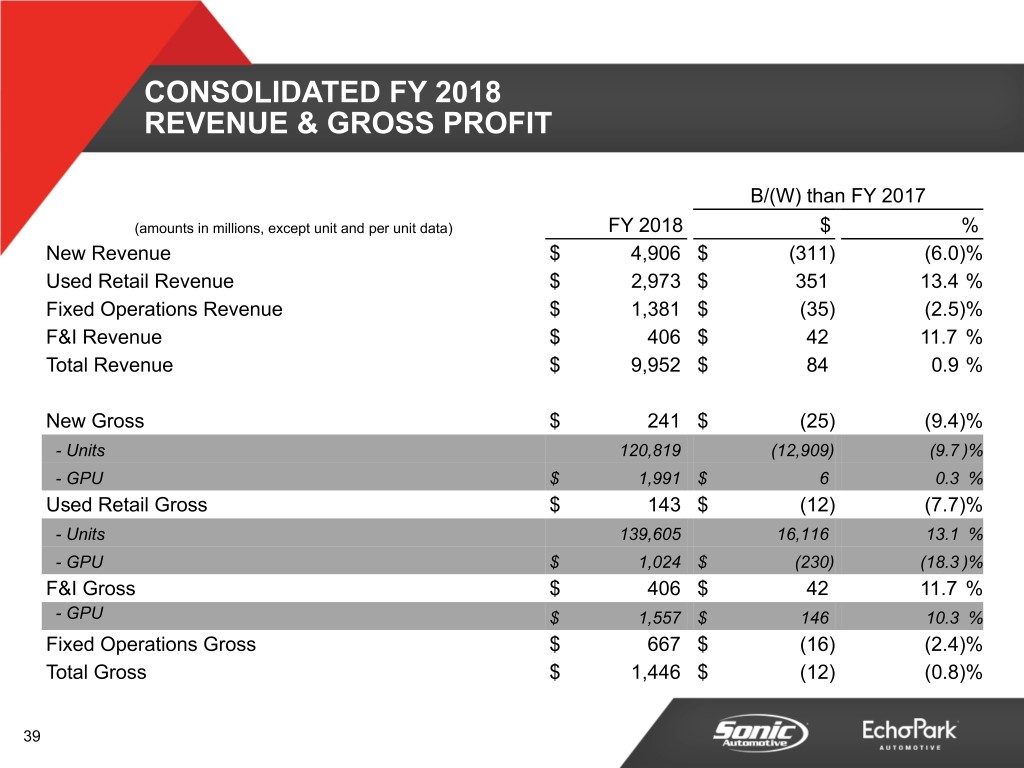
CONSOLIDATED FY 2018 REVENUE & GROSS PROFIT B/(W) than FY 2017 (amounts in millions, except unit and per unit data) FY 2018 $ % New Revenue $ 4,906 $ (311) (6.0)% Used Retail Revenue $ 2,973 $ 351 13.4 % Fixed Operations Revenue $ 1,381 $ (35) (2.5)% F&I Revenue $ 406 $ 42 11.7 % Total Revenue $ 9,952 $ 84 0.9 % New Gross $ 241 $ (25) (9.4)% - Units 120,819 (12,909) (9.7 )% - GPU $ 1,991 $ 6 0.3 % Used Retail Gross $ 143 $ (12) (7.7)% - Units 139,605 16,116 13.1 % - GPU $ 1,024 $ (230) (18.3 )% F&I Gross $ 406 $ 42 11.7 % - GPU $ 1,557 $ 146 10.3 % Fixed Operations Gross $ 667 $ (16) (2.4)% Total Gross $ 1,446 $ (12) (0.8)% 39
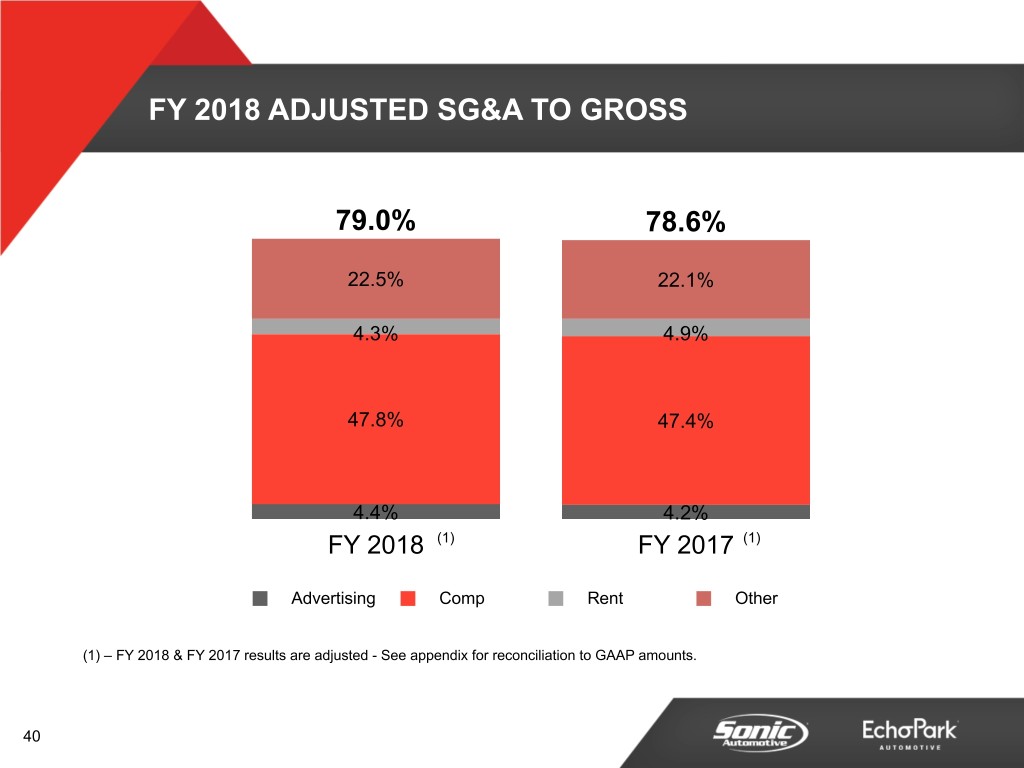
FY 2018 ADJUSTED SG&A TO GROSS 79.0% 78.6% 22.5% 22.1% 4.3% 4.9% 47.8% 47.4% 4.4% 4.2% FY 2018 (1) FY 2017 (1) Advertising Comp Rent Other (1) – FY 2018 & FY 2017 results are adjusted - See appendix for reconciliation to GAAP amounts. 40
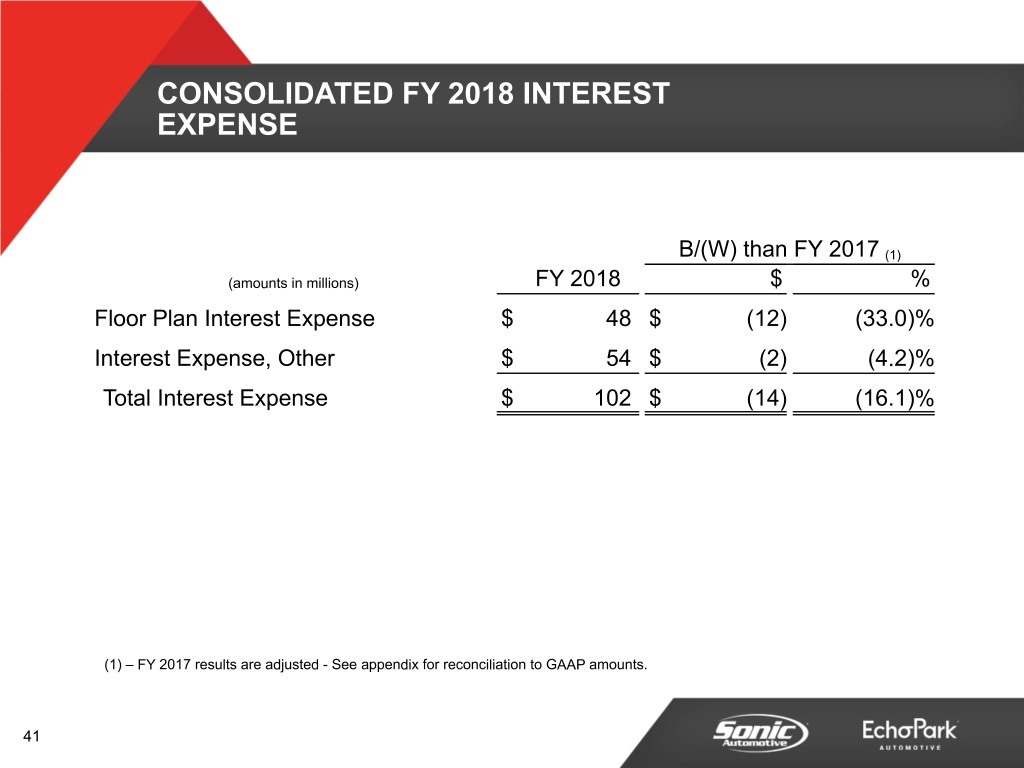
CONSOLIDATED FY 2018 INTEREST EXPENSE B/(W) than FY 2017 (1) (amounts in millions) FY 2018 $ % Floor Plan Interest Expense $ 48 $ (12) (33.0)% Interest Expense, Other $ 54 $ (2) (4.2)% Total Interest Expense $ 102 $ (14) (16.1)% (1) – FY 2017 results are adjusted - See appendix for reconciliation to GAAP amounts. 41
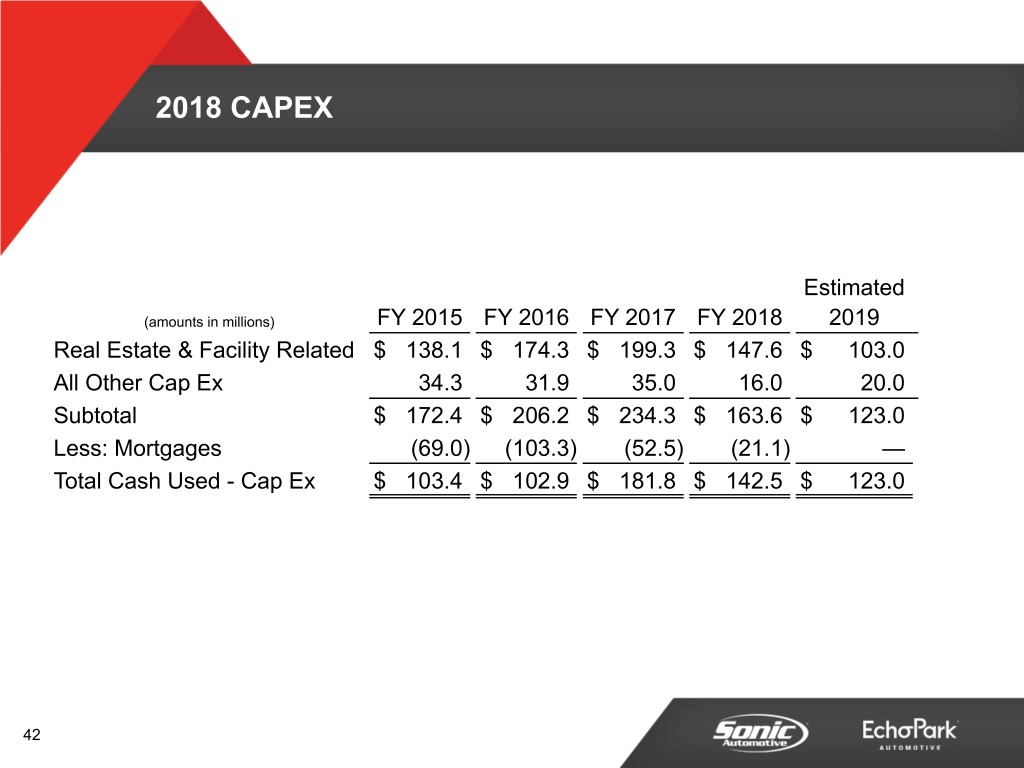
2018 CAPEX Estimated (amounts in millions) FY 2015 FY 2016 FY 2017 FY 2018 2019 Real Estate & Facility Related $ 138.1 $ 174.3 $ 199.3 $ 147.6 $ 103.0 All Other Cap Ex 34.3 31.9 35.0 16.0 20.0 Subtotal $ 172.4 $ 206.2 $ 234.3 $ 163.6 $ 123.0 Less: Mortgages (69.0) (103.3) (52.5) (21.1) — Total Cash Used - Cap Ex $ 103.4 $ 102.9 $ 181.8 $ 142.5 $ 123.0 42
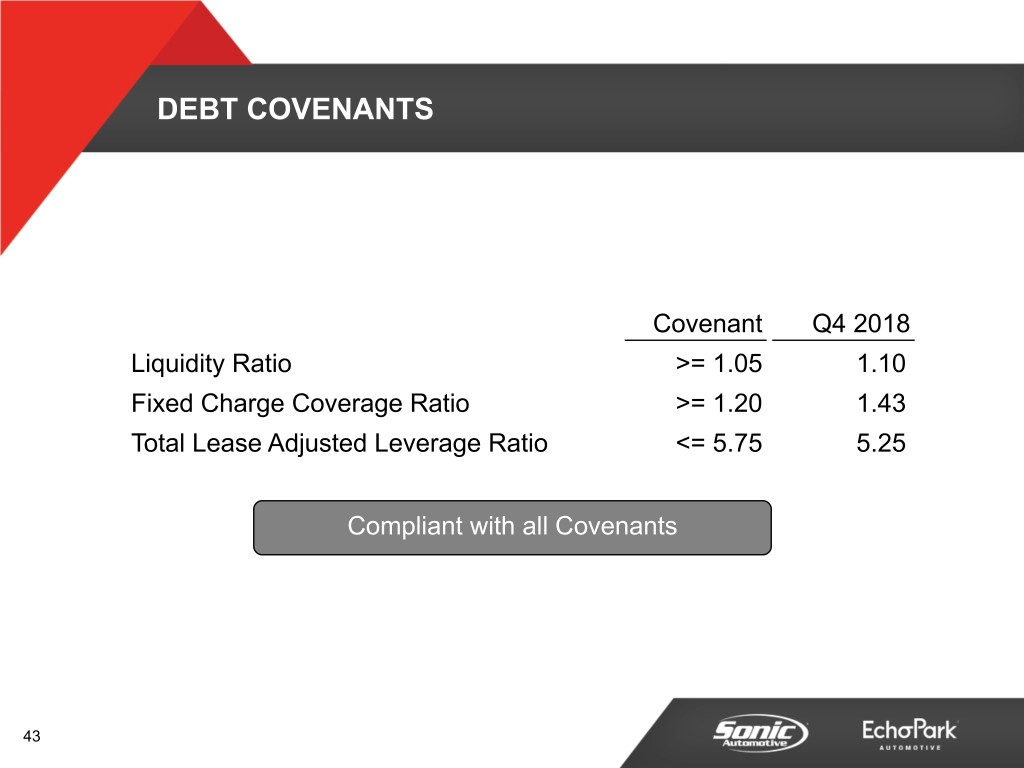
DEBT COVENANTS Covenant Q4 2018 Liquidity Ratio >= 1.05 1.10 Fixed Charge Coverage Ratio >= 1.20 1.43 Total Lease Adjusted Leverage Ratio <= 5.75 5.25 Compliant with all Covenants 43
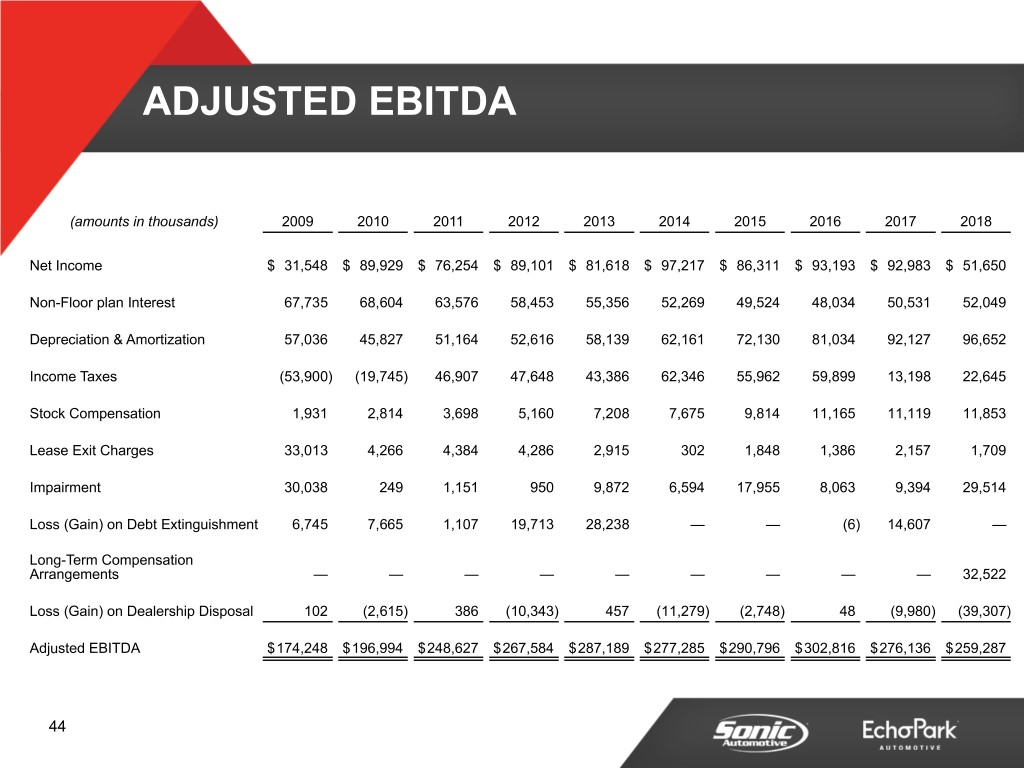
ADJUSTED EBITDA (amounts in thousands) 2009 2010 2011 2012 2013 2014 2015 2016 2017 2018 Net Income $ 31,548 $ 89,929 $ 76,254 $ 89,101 $ 81,618 $ 97,217 $ 86,311 $ 93,193 $ 92,983 $ 51,650 Non-Floor plan Interest 67,735 68,604 63,576 58,453 55,356 52,269 49,524 48,034 50,531 52,049 Depreciation & Amortization 57,036 45,827 51,164 52,616 58,139 62,161 72,130 81,034 92,127 96,652 Income Taxes (53,900) (19,745) 46,907 47,648 43,386 62,346 55,962 59,899 13,198 22,645 Stock Compensation 1,931 2,814 3,698 5,160 7,208 7,675 9,814 11,165 11,119 11,853 Lease Exit Charges 33,013 4,266 4,384 4,286 2,915 302 1,848 1,386 2,157 1,709 Impairment 30,038 249 1,151 950 9,872 6,594 17,955 8,063 9,394 29,514 Loss (Gain) on Debt Extinguishment 6,745 7,665 1,107 19,713 28,238 — — (6) 14,607 — Long-Term Compensation Arrangements — — — — — — — — — 32,522 Loss (Gain) on Dealership Disposal 102 (2,615) 386 (10,343) 457 (11,279) (2,748) 48 (9,980) (39,307) Adjusted EBITDA $174,248 $196,994 $248,627 $267,584 $287,189 $277,285 $290,796 $302,816 $276,136 $259,287 44
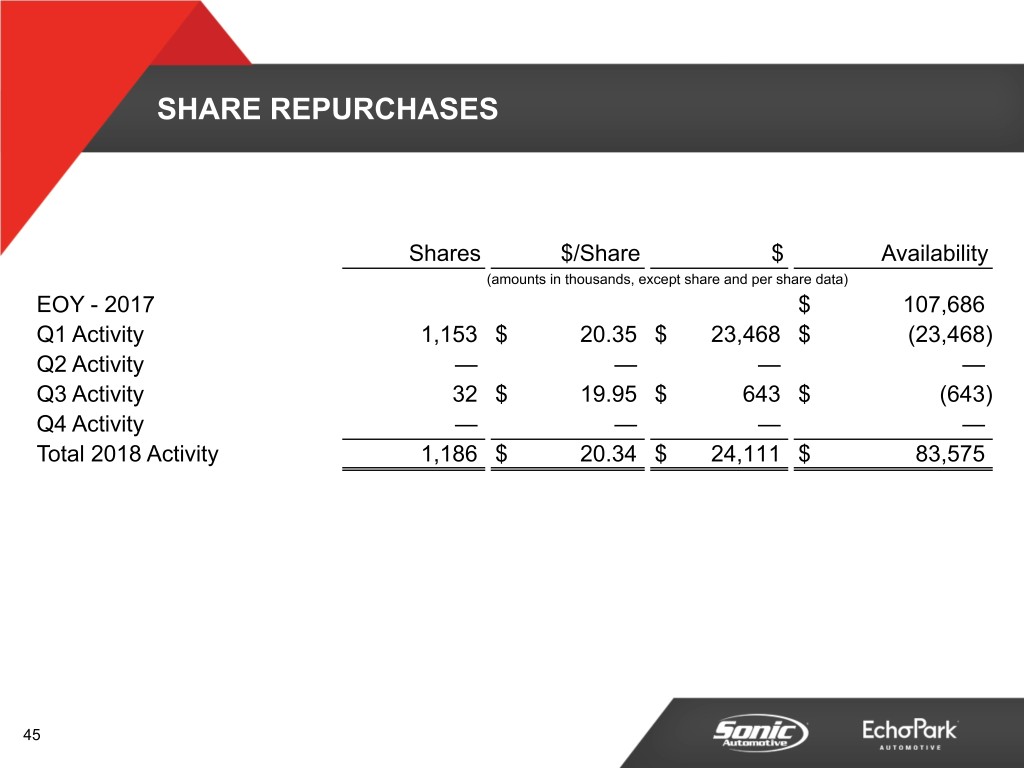
SHARE REPURCHASES Shares $/Share $ Availability (amounts in thousands, except share and per share data) EOY - 2017 $ 107,686 Q1 Activity 1,153 $ 20.35 $ 23,468 $ (23,468) Q2 Activity — — — — Q3 Activity 32 $ 19.95 $ 643 $ (643) Q4 Activity — — — — Total 2018 Activity 1,186 $ 20.34 $ 24,111 $ 83,575 45

APPENDIX 46
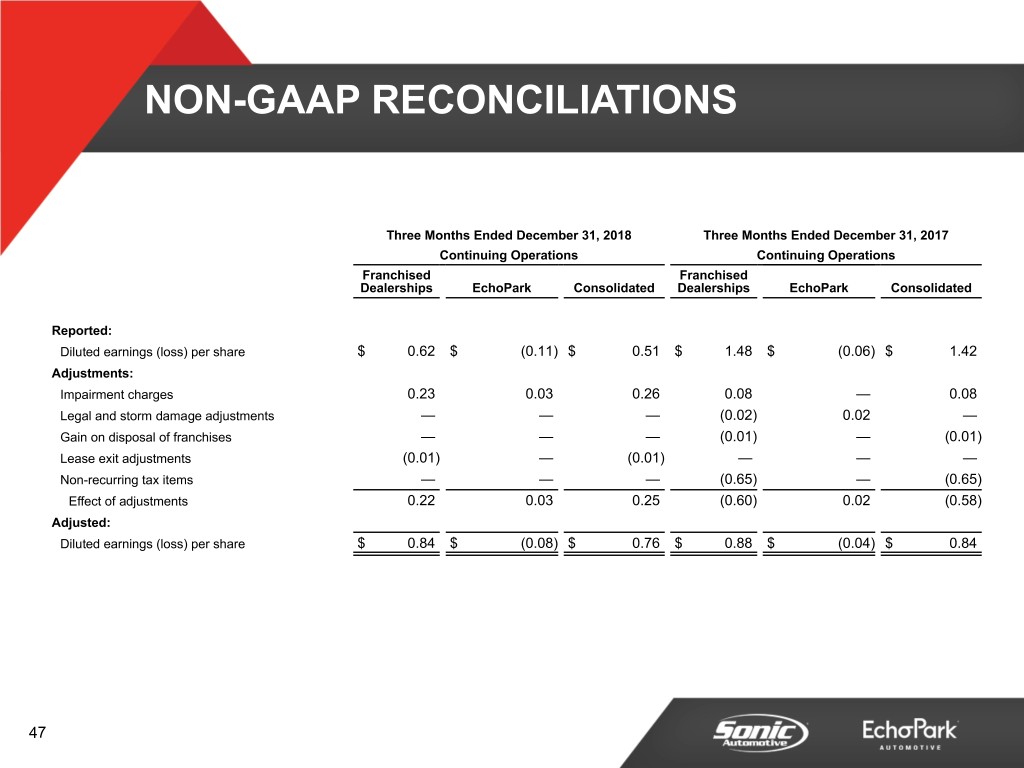
NON-GAAP RECONCILIATIONS Three Months Ended December 31, 2018 Three Months Ended December 31, 2017 Continuing Operations Continuing Operations Franchised Franchised Dealerships EchoPark Consolidated Dealerships EchoPark Consolidated Reported: Diluted earnings (loss) per share $ 0.62 $ (0.11) $ 0.51 $ 1.48 $ (0.06) $ 1.42 Adjustments: Impairment charges 0.23 0.03 0.26 0.08 — 0.08 Legal and storm damage adjustments — — — (0.02) 0.02 — Gain on disposal of franchises — — — (0.01) — (0.01) Lease exit adjustments (0.01) — (0.01) — — — Non-recurring tax items — — — (0.65) — (0.65) Effect of adjustments 0.22 0.03 0.25 (0.60) 0.02 (0.58) Adjusted: Diluted earnings (loss) per share $ 0.84 $ (0.08) $ 0.76 $ 0.88 $ (0.04) $ 0.84 47
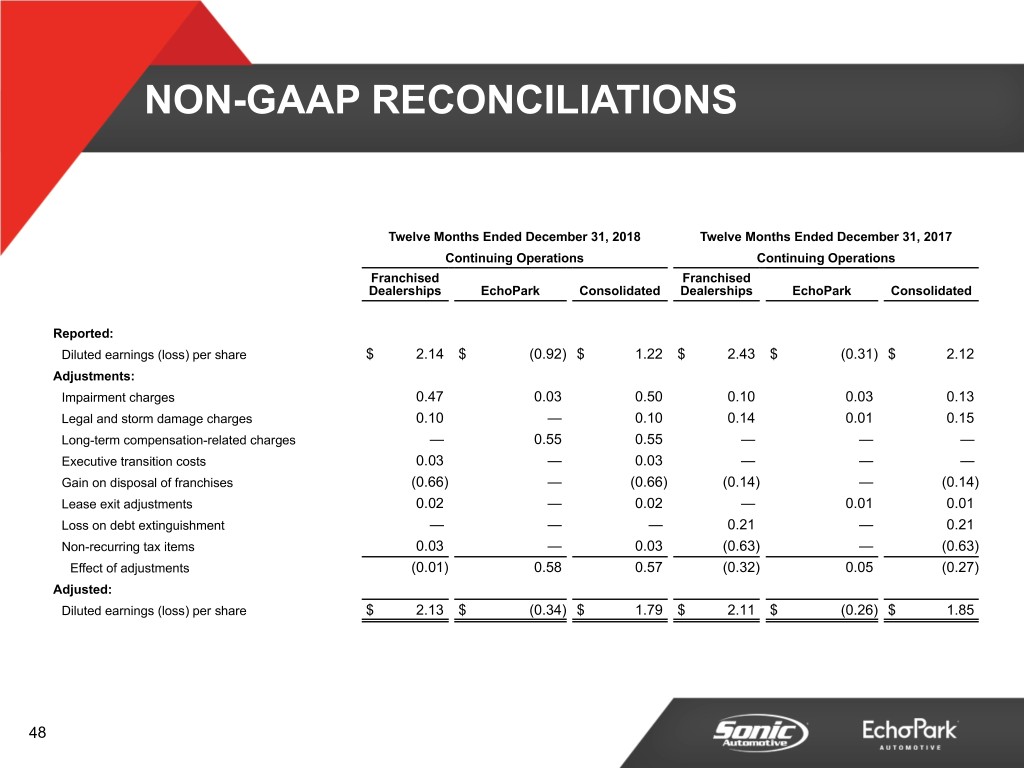
NON-GAAP RECONCILIATIONS Twelve Months Ended December 31, 2018 Twelve Months Ended December 31, 2017 Continuing Operations Continuing Operations Franchised Franchised Dealerships EchoPark Consolidated Dealerships EchoPark Consolidated Reported: Diluted earnings (loss) per share $ 2.14 $ (0.92) $ 1.22 $ 2.43 $ (0.31) $ 2.12 Adjustments: Impairment charges 0.47 0.03 0.50 0.10 0.03 0.13 Legal and storm damage charges 0.10 — 0.10 0.14 0.01 0.15 Long-term compensation-related charges — 0.55 0.55 — — — Executive transition costs 0.03 — 0.03 — — — Gain on disposal of franchises (0.66) — (0.66) (0.14) — (0.14) Lease exit adjustments 0.02 — 0.02 — 0.01 0.01 Loss on debt extinguishment — — — 0.21 — 0.21 Non-recurring tax items 0.03 — 0.03 (0.63) — (0.63) Effect of adjustments (0.01) 0.58 0.57 (0.32) 0.05 (0.27) Adjusted: Diluted earnings (loss) per share $ 2.13 $ (0.34) $ 1.79 $ 2.11 $ (0.26) $ 1.85 48
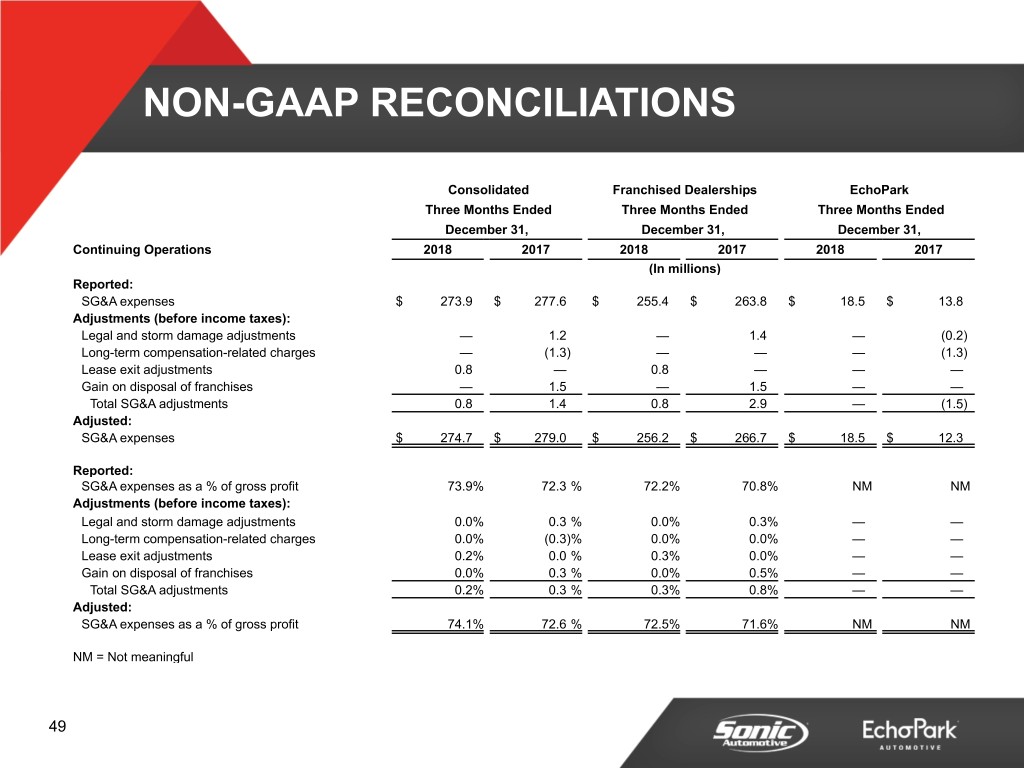
NON-GAAP RECONCILIATIONS Consolidated Franchised Dealerships EchoPark Three Months Ended Three Months Ended Three Months Ended December 31, December 31, December 31, Continuing Operations 2018 2017 2018 2017 2018 2017 (In millions) Reported: SG&A expenses $ 273.9 $ 277.6 $ 255.4 $ 263.8 $ 18.5 $ 13.8 Adjustments (before income taxes): Legal and storm damage adjustments — 1.2 — 1.4 — (0.2) Long-term compensation-related charges — (1.3) — — — (1.3) Lease exit adjustments 0.8 — 0.8 — — — Gain on disposal of franchises — 1.5 — 1.5 — — Total SG&A adjustments 0.8 1.4 0.8 2.9 — (1.5) Adjusted: SG&A expenses $ 274.7 $ 279.0 $ 256.2 $ 266.7 $ 18.5 $ 12.3 Reported: SG&A expenses as a % of gross profit 73.9% 72.3 % 72.2% 70.8% NM NM Adjustments (before income taxes): Legal and storm damage adjustments 0.0% 0.3 % 0.0% 0.3% — — Long-term compensation-related charges 0.0% (0.3)% 0.0% 0.0% — — Lease exit adjustments 0.2% 0.0 % 0.3% 0.0% — — Gain on disposal of franchises 0.0% 0.3 % 0.0% 0.5% — — Total SG&A adjustments 0.2% 0.3 % 0.3% 0.8% — — Adjusted: SG&A expenses as a % of gross profit 74.1% 72.6 % 72.5% 71.6% NM NM NM = Not meaningful 49
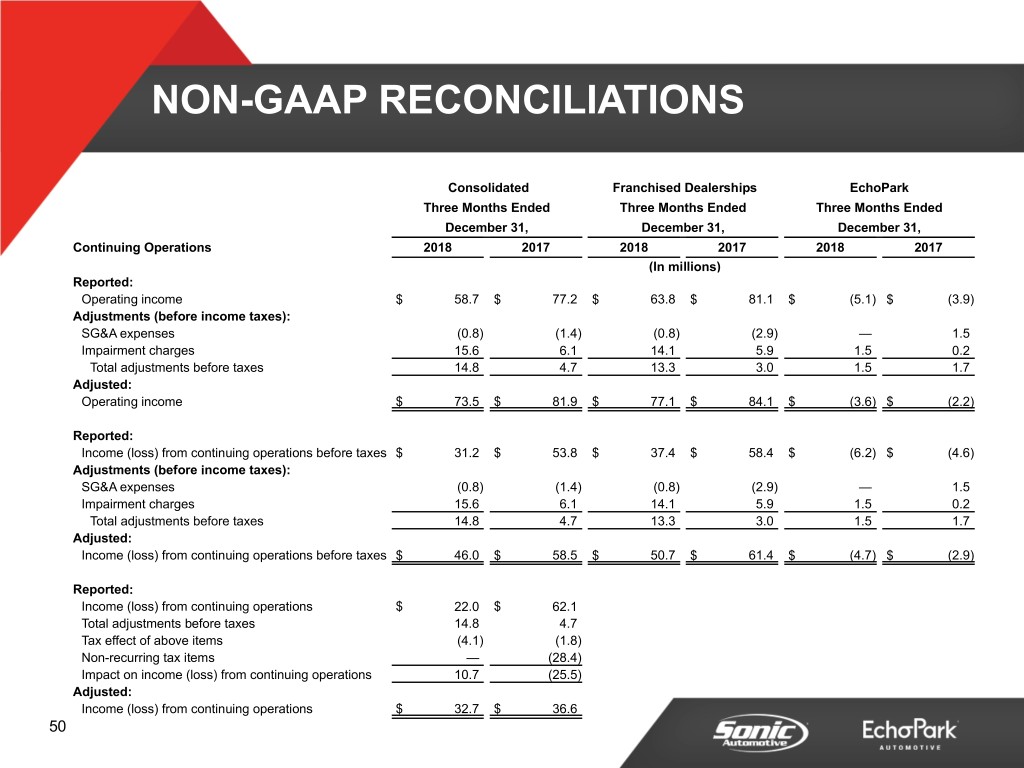
NON-GAAP RECONCILIATIONS Consolidated Franchised Dealerships EchoPark Three Months Ended Three Months Ended Three Months Ended December 31, December 31, December 31, Continuing Operations 2018 2017 2018 2017 2018 2017 (In millions) Reported: Operating income $ 58.7 $ 77.2 $ 63.8 $ 81.1 $ (5.1) $ (3.9) Adjustments (before income taxes): SG&A expenses (0.8) (1.4) (0.8) (2.9) — 1.5 Impairment charges 15.6 6.1 14.1 5.9 1.5 0.2 Total adjustments before taxes 14.8 4.7 13.3 3.0 1.5 1.7 Adjusted: Operating income $ 73.5 $ 81.9 $ 77.1 $ 84.1 $ (3.6) $ (2.2) Reported: Income (loss) from continuing operations before taxes $ 31.2 $ 53.8 $ 37.4 $ 58.4 $ (6.2) $ (4.6) Adjustments (before income taxes): SG&A expenses (0.8) (1.4) (0.8) (2.9) — 1.5 Impairment charges 15.6 6.1 14.1 5.9 1.5 0.2 Total adjustments before taxes 14.8 4.7 13.3 3.0 1.5 1.7 Adjusted: Income (loss) from continuing operations before taxes $ 46.0 $ 58.5 $ 50.7 $ 61.4 $ (4.7) $ (2.9) Reported: Income (loss) from continuing operations $ 22.0 $ 62.1 Total adjustments before taxes 14.8 4.7 Tax effect of above items (4.1) (1.8) Non-recurring tax items — (28.4) Impact on income (loss) from continuing operations 10.7 (25.5) Adjusted: Income (loss) from continuing operations $ 32.7 $ 36.6 50
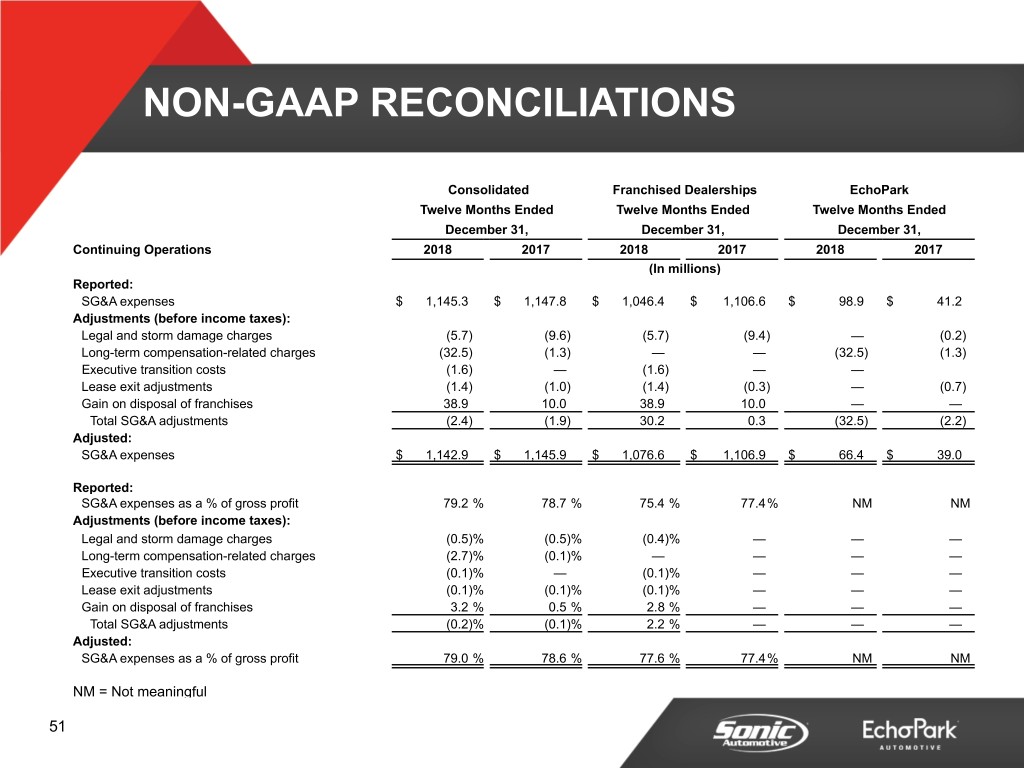
NON-GAAP RECONCILIATIONS Consolidated Franchised Dealerships EchoPark Twelve Months Ended Twelve Months Ended Twelve Months Ended December 31, December 31, December 31, Continuing Operations 2018 2017 2018 2017 2018 2017 (In millions) Reported: SG&A expenses $ 1,145.3 $ 1,147.8 $ 1,046.4 $ 1,106.6 $ 98.9 $ 41.2 Adjustments (before income taxes): Legal and storm damage charges (5.7) (9.6) (5.7) (9.4) — (0.2) Long-term compensation-related charges (32.5) (1.3) — — (32.5) (1.3) Executive transition costs (1.6) — (1.6) — — Lease exit adjustments (1.4) (1.0) (1.4) (0.3) — (0.7) Gain on disposal of franchises 38.9 10.0 38.9 10.0 — — Total SG&A adjustments (2.4) (1.9) 30.2 0.3 (32.5) (2.2) Adjusted: SG&A expenses $ 1,142.9 $ 1,145.9 $ 1,076.6 $ 1,106.9 $ 66.4 $ 39.0 Reported: SG&A expenses as a % of gross profit 79.2 % 78.7 % 75.4 % 77.4% NM NM Adjustments (before income taxes): Legal and storm damage charges (0.5)% (0.5)% (0.4)% — — — Long-term compensation-related charges (2.7)% (0.1)% — — — — Executive transition costs (0.1)% — (0.1)% — — — Lease exit adjustments (0.1)% (0.1)% (0.1)% — — — Gain on disposal of franchises 3.2 % 0.5 % 2.8 % — — — Total SG&A adjustments (0.2)% (0.1)% 2.2 % — — — Adjusted: SG&A expenses as a % of gross profit 79.0 % 78.6 % 77.6 % 77.4% NM NM NM = Not meaningful 51
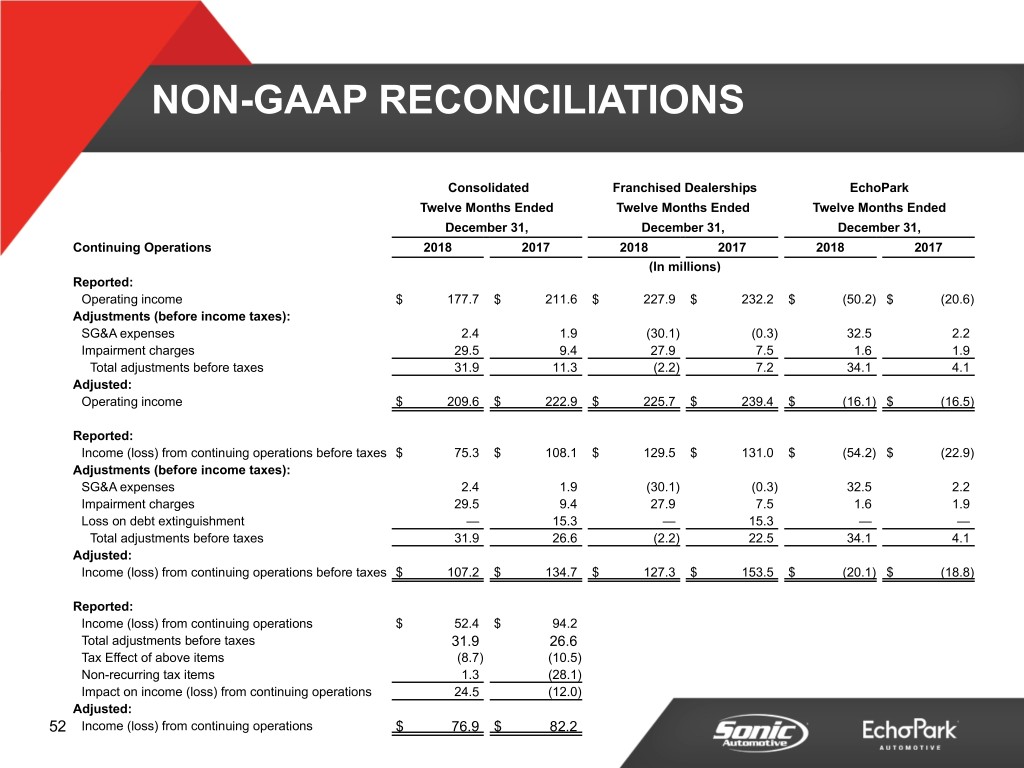
NON-GAAP RECONCILIATIONS Consolidated Franchised Dealerships EchoPark Twelve Months Ended Twelve Months Ended Twelve Months Ended December 31, December 31, December 31, Continuing Operations 2018 2017 2018 2017 2018 2017 (In millions) Reported: Operating income $ 177.7 $ 211.6 $ 227.9 $ 232.2 $ (50.2) $ (20.6) Adjustments (before income taxes): SG&A expenses 2.4 1.9 (30.1) (0.3) 32.5 2.2 Impairment charges 29.5 9.4 27.9 7.5 1.6 1.9 Total adjustments before taxes 31.9 11.3 (2.2) 7.2 34.1 4.1 Adjusted: Operating income $ 209.6 $ 222.9 $ 225.7 $ 239.4 $ (16.1) $ (16.5) Reported: Income (loss) from continuing operations before taxes $ 75.3 $ 108.1 $ 129.5 $ 131.0 $ (54.2) $ (22.9) Adjustments (before income taxes): SG&A expenses 2.4 1.9 (30.1) (0.3) 32.5 2.2 Impairment charges 29.5 9.4 27.9 7.5 1.6 1.9 Loss on debt extinguishment — 15.3 — 15.3 — — Total adjustments before taxes 31.9 26.6 (2.2) 22.5 34.1 4.1 Adjusted: Income (loss) from continuing operations before taxes $ 107.2 $ 134.7 $ 127.3 $ 153.5 $ (20.1) $ (18.8) Reported: Income (loss) from continuing operations $ 52.4 $ 94.2 Total adjustments before taxes 31.9 26.6 Tax Effect of above items (8.7) (10.5) Non-recurring tax items 1.3 (28.1) Impact on income (loss) from continuing operations 24.5 (12.0) Adjusted: 52 Income (loss) from continuing operations $ 76.9 $ 82.2
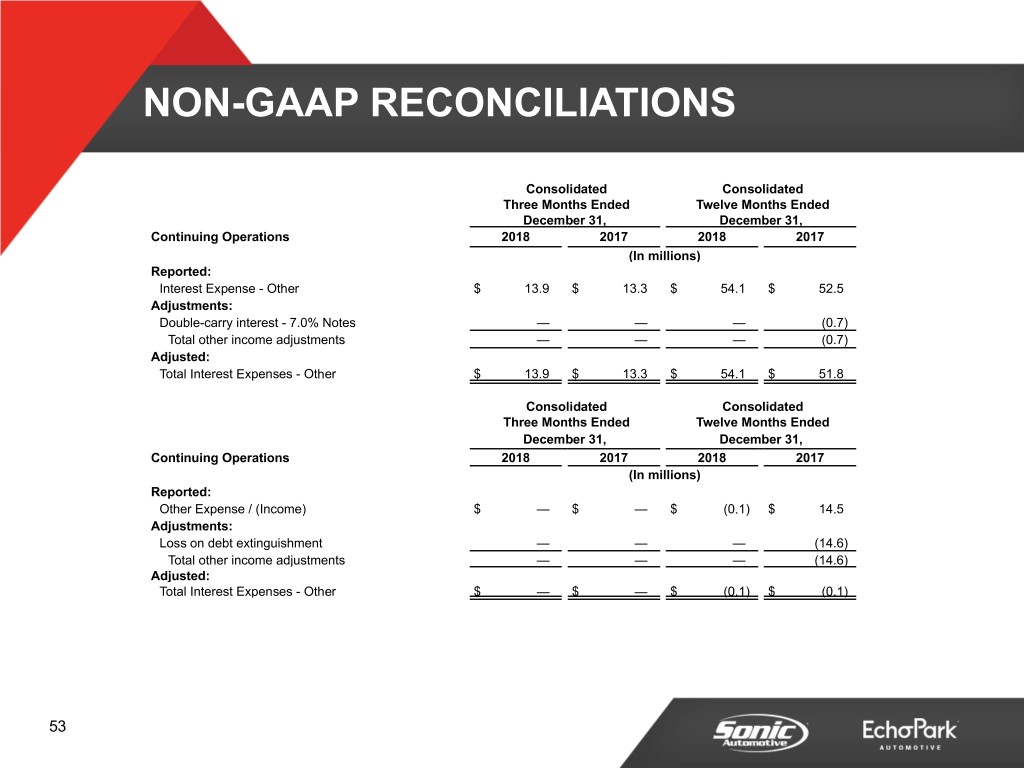
NON-GAAP RECONCILIATIONS Consolidated Consolidated Three Months Ended Twelve Months Ended December 31, December 31, Continuing Operations 2018 2017 2018 2017 (In millions) Reported: Interest Expense - Other $ 13.9 $ 13.3 $ 54.1 $ 52.5 Adjustments: Double-carry interest - 7.0% Notes — — — (0.7) Total other income adjustments — — — (0.7) Adjusted: Total Interest Expenses - Other $ 13.9 $ 13.3 $ 54.1 $ 51.8 Consolidated Consolidated Three Months Ended Twelve Months Ended December 31, December 31, Continuing Operations 2018 2017 2018 2017 (In millions) Reported: Other Expense / (Income) $ — $ — $ (0.1) $ 14.5 Adjustments: Loss on debt extinguishment — — — (14.6) Total other income adjustments — — — (14.6) Adjusted: Total Interest Expenses - Other $ — $ — $ (0.1) $ (0.1) 53
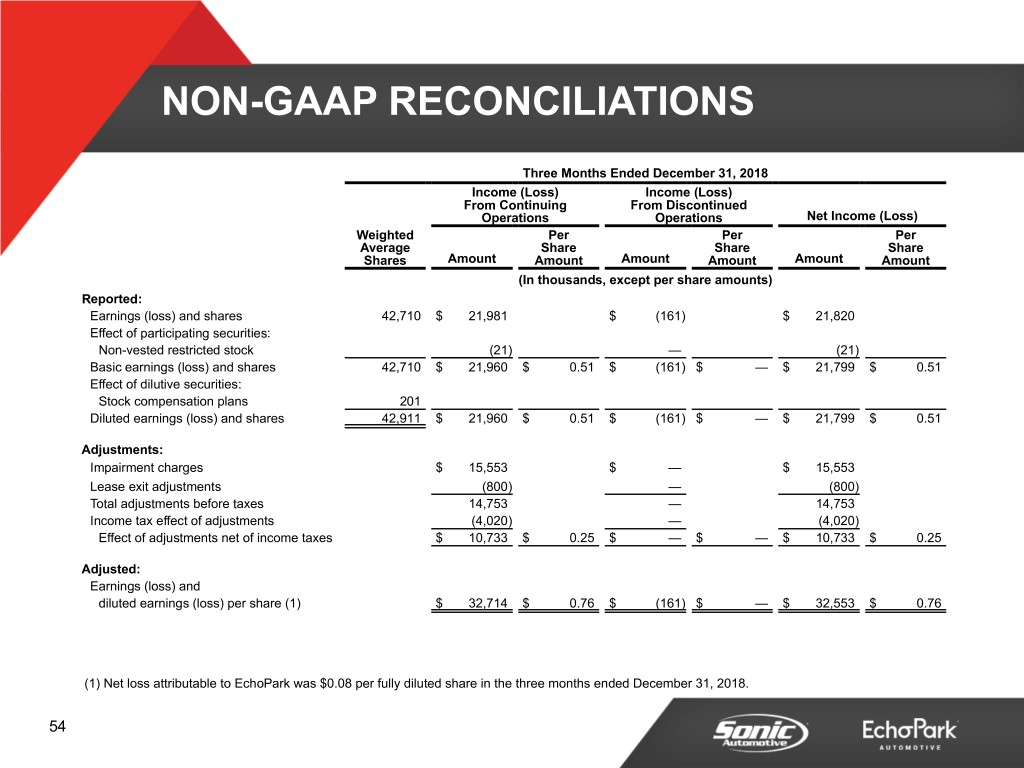
NON-GAAP RECONCILIATIONS Three Months Ended December 31, 2018 Income (Loss) Income (Loss) From Continuing From Discontinued Operations Operations Net Income (Loss) Weighted Per Per Per Average Share Share Share Shares Amount Amount Amount Amount Amount Amount (In thousands, except per share amounts) Reported: Earnings (loss) and shares 42,710 $ 21,981 $ (161) $ 21,820 Effect of participating securities: Non-vested restricted stock (21) — (21) Basic earnings (loss) and shares 42,710 $ 21,960 $ 0.51 $ (161) $ — $ 21,799 $ 0.51 Effect of dilutive securities: Stock compensation plans 201 Diluted earnings (loss) and shares 42,911 $ 21,960 $ 0.51 $ (161) $ — $ 21,799 $ 0.51 Adjustments: Impairment charges $ 15,553 $ — $ 15,553 Lease exit adjustments (800) — (800) Total adjustments before taxes 14,753 — 14,753 Income tax effect of adjustments (4,020) — (4,020) Effect of adjustments net of income taxes $ 10,733 $ 0.25 $ — $ — $ 10,733 $ 0.25 Adjusted: Earnings (loss) and diluted earnings (loss) per share (1) $ 32,714 $ 0.76 $ (161) $ — $ 32,553 $ 0.76 (1) Net loss attributable to EchoPark was $0.08 per fully diluted share in the three months ended December 31, 2018. 54
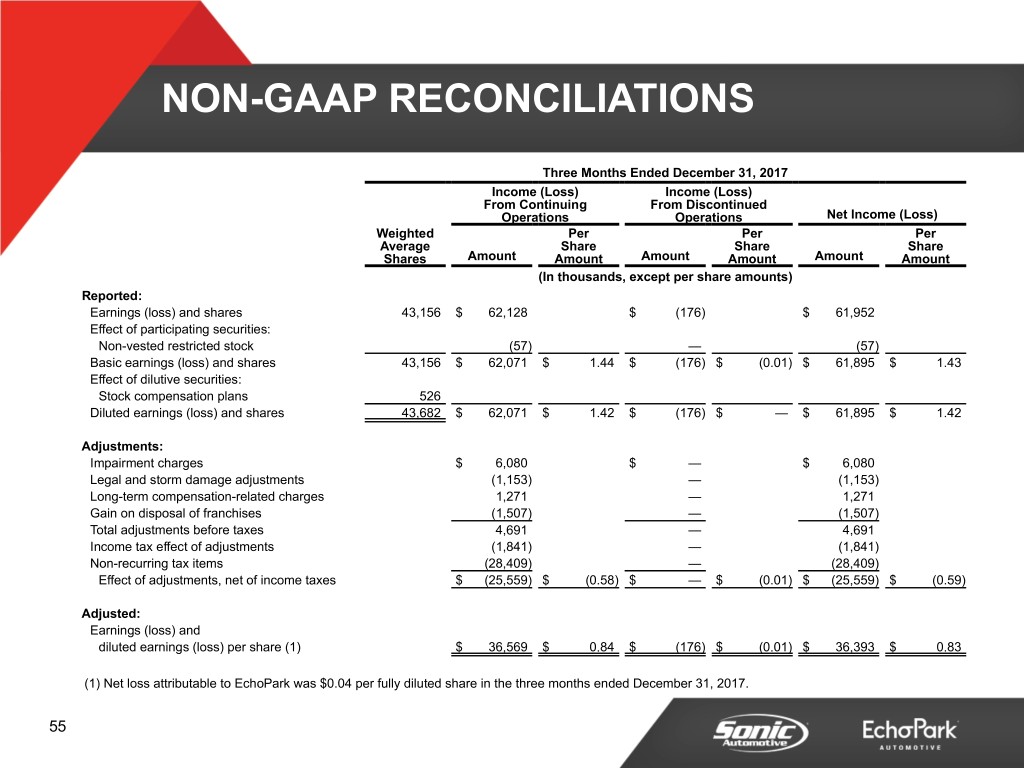
NON-GAAP RECONCILIATIONS Three Months Ended December 31, 2017 Income (Loss) Income (Loss) From Continuing From Discontinued Operations Operations Net Income (Loss) Weighted Per Per Per Average Share Share Share Shares Amount Amount Amount Amount Amount Amount (In thousands, except per share amounts) Reported: Earnings (loss) and shares 43,156 $ 62,128 $ (176) $ 61,952 Effect of participating securities: Non-vested restricted stock (57) — (57) Basic earnings (loss) and shares 43,156 $ 62,071 $ 1.44 $ (176) $ (0.01) $ 61,895 $ 1.43 Effect of dilutive securities: Stock compensation plans 526 Diluted earnings (loss) and shares 43,682 $ 62,071 $ 1.42 $ (176) $ — $ 61,895 $ 1.42 Adjustments: Impairment charges $ 6,080 $ — $ 6,080 Legal and storm damage adjustments (1,153) — (1,153) Long-term compensation-related charges 1,271 — 1,271 Gain on disposal of franchises (1,507) — (1,507) Total adjustments before taxes 4,691 — 4,691 Income tax effect of adjustments (1,841) — (1,841) Non-recurring tax items (28,409) — (28,409) Effect of adjustments, net of income taxes $ (25,559) $ (0.58) $ — $ (0.01) $ (25,559) $ (0.59) Adjusted: Earnings (loss) and diluted earnings (loss) per share (1) $ 36,569 $ 0.84 $ (176) $ (0.01) $ 36,393 $ 0.83 (1) Net loss attributable to EchoPark was $0.04 per fully diluted share in the three months ended December 31, 2017. 55
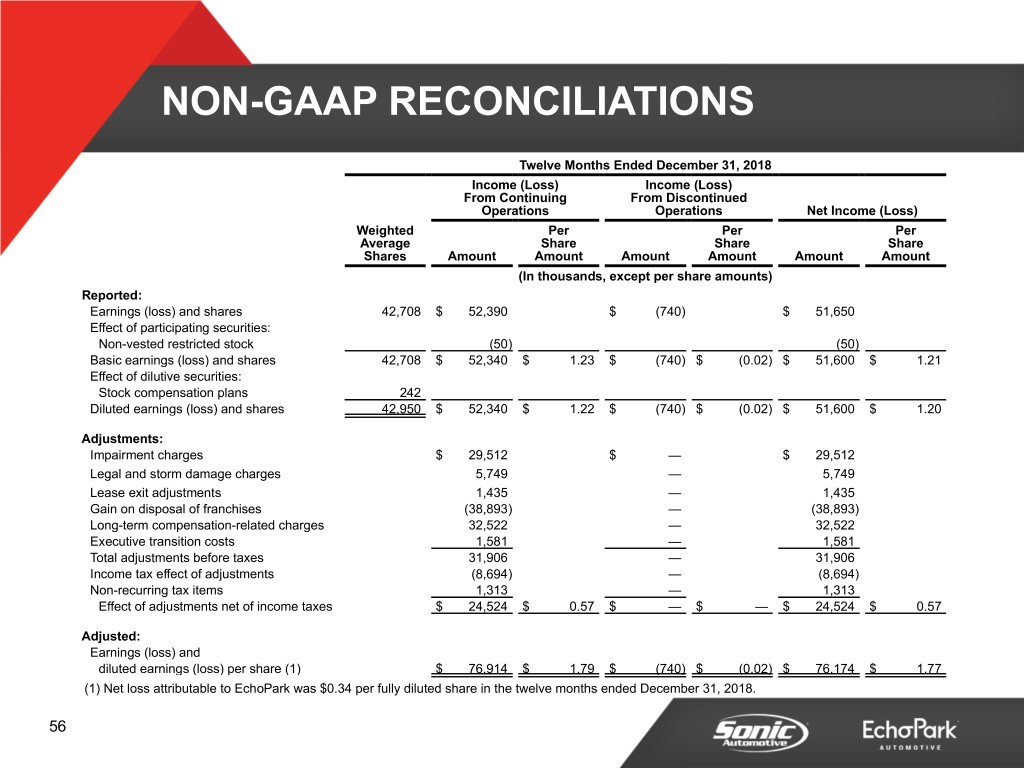
NON-GAAP RECONCILIATIONS Twelve Months Ended December 31, 2018 Income (Loss) Income (Loss) From Continuing From Discontinued Operations Operations Net Income (Loss) Weighted Per Per Per Average Share Share Share Shares Amount Amount Amount Amount Amount Amount (In thousands, except per share amounts) Reported: Earnings (loss) and shares 42,708 $ 52,390 $ (740) $ 51,650 Effect of participating securities: Non-vested restricted stock (50) (50) Basic earnings (loss) and shares 42,708 $ 52,340 $ 1.23 $ (740) $ (0.02) $ 51,600 $ 1.21 Effect of dilutive securities: Stock compensation plans 242 Diluted earnings (loss) and shares 42,950 $ 52,340 $ 1.22 $ (740) $ (0.02) $ 51,600 $ 1.20 Adjustments: Impairment charges $ 29,512 $ — $ 29,512 Legal and storm damage charges 5,749 — 5,749 Lease exit adjustments 1,435 — 1,435 Gain on disposal of franchises (38,893) — (38,893) Long-term compensation-related charges 32,522 — 32,522 Executive transition costs 1,581 — 1,581 Total adjustments before taxes 31,906 — 31,906 Income tax effect of adjustments (8,694) — (8,694) Non-recurring tax items 1,313 — 1,313 Effect of adjustments net of income taxes $ 24,524 $ 0.57 $ — $ — $ 24,524 $ 0.57 Adjusted: Earnings (loss) and diluted earnings (loss) per share (1) $ 76,914 $ 1.79 $ (740) $ (0.02) $ 76,174 $ 1.77 (1) Net loss attributable to EchoPark was $0.34 per fully diluted share in the twelve months ended December 31, 2018. 56
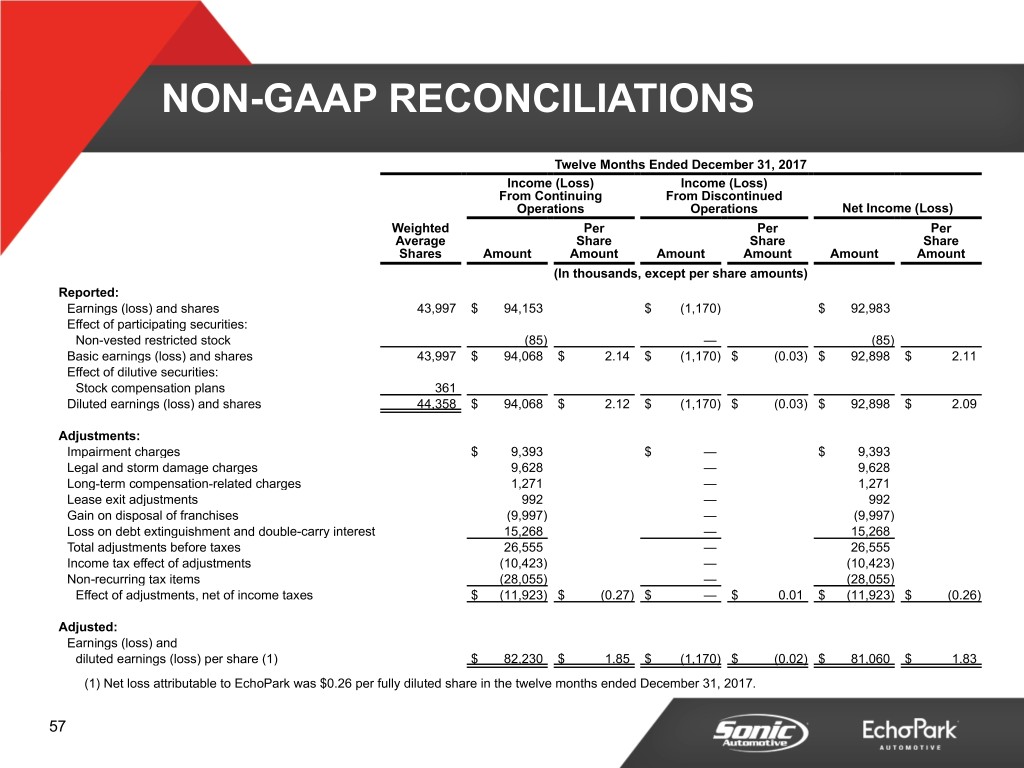
NON-GAAP RECONCILIATIONS Twelve Months Ended December 31, 2017 Income (Loss) Income (Loss) From Continuing From Discontinued Operations Operations Net Income (Loss) Weighted Per Per Per Average Share Share Share Shares Amount Amount Amount Amount Amount Amount (In thousands, except per share amounts) Reported: Earnings (loss) and shares 43,997 $ 94,153 $ (1,170) $ 92,983 Effect of participating securities: Non-vested restricted stock (85) — (85) Basic earnings (loss) and shares 43,997 $ 94,068 $ 2.14 $ (1,170) $ (0.03) $ 92,898 $ 2.11 Effect of dilutive securities: Stock compensation plans 361 Diluted earnings (loss) and shares 44,358 $ 94,068 $ 2.12 $ (1,170) $ (0.03) $ 92,898 $ 2.09 Adjustments: Impairment charges $ 9,393 $ — $ 9,393 Legal and storm damage charges 9,628 — 9,628 Long-term compensation-related charges 1,271 — 1,271 Lease exit adjustments 992 — 992 Gain on disposal of franchises (9,997) — (9,997) Loss on debt extinguishment and double-carry interest 15,268 — 15,268 Total adjustments before taxes 26,555 — 26,555 Income tax effect of adjustments (10,423) — (10,423) Non-recurring tax items (28,055) — (28,055) Effect of adjustments, net of income taxes $ (11,923) $ (0.27) $ — $ 0.01 $ (11,923) $ (0.26) Adjusted: Earnings (loss) and diluted earnings (loss) per share (1) $ 82,230 $ 1.85 $ (1,170) $ (0.02) $ 81,060 $ 1.83 (1) Net loss attributable to EchoPark was $0.26 per fully diluted share in the twelve months ended December 31, 2017. 57
